

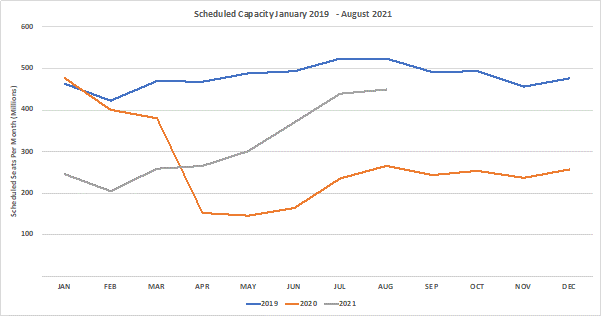
The headline numbers suggest that global airline capacity has seen a slight recovery back to 61.9 million seats this week, a 1.2% increase. However, as the weekly airline capacity was being finalised further significant capacity cuts were yet to be supplied by many of the major Indian airlines and Fiji was about to enter a lockdown; the Fiji numbers are minor but India normally accounts for around 2.6 million seats so in truth global airline capacity is probably down week on week.
Hopes for that airline capacity bounce we are all hoping for and subsequent release of pent-up demand remain some way off. Airlines removed another one million seats for the remainder of April over the last week and worryingly some 13.3 million for May and 12.5 million for June; yes, that’s nearly 26 million seats dropped for the next two months. Airlines are clearly not expecting a recovery in the near future, or at least not as strong a recovery as originally hoped.
Chart 1 – Scheduled Airline Capacity by Month
With such little change in the weekly numbers and therefore China still the largest country market and American Airlines ranking as the largest airline in the world we have taken a look at how the numbers have changed against this week last year. It makes the numbers look a lot better when you change the comparison point, especially when the week of the 27th April 2020 was one of the low points in the Covid-19 pandemic for the industry.
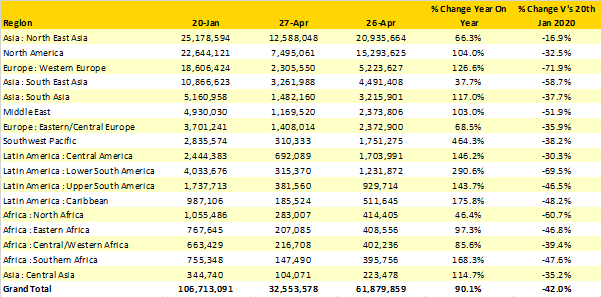
As the table below highlights, every region suddenly looks positive when the comparison is made to the same week last year. Taking Western Europe as one example, airline capacity has doubled since this time last year which would be an exceptional result in most circumstances but in comparison to pre-pandemic volumes remains at just 28% of its normal capacity levels. The Southwest Pacific region has seen capacity increase four-fold when compared to last year with both domestic services and the Tasman Bubble now open.
Table 1 – Scheduled Airline Capacity by Region
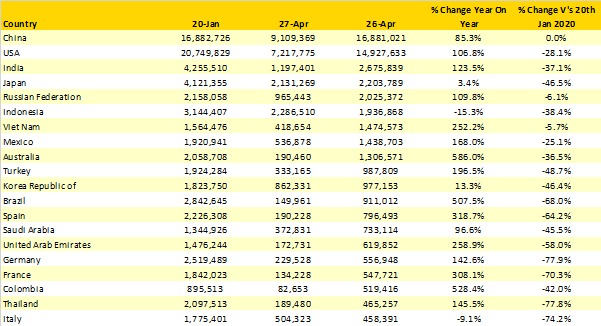
Airline capacity by country provides a reminder of those countries that at least from a capacity perspective there are still country markets with less capacity this week than in the same week last year; both Indonesia and Italy fall into that category amongst the top twenty country markets. Outside of the top twenty, other country markets that still have less capacity than at this stage last year include Hungary, Oman, Venezuela, and Algeria, all of which once again highlights that every country is at a different stage in their “Covid-19 experience” and that we remain a long way from having any confidence in an aviation recovery this year.
Likely reductions in airline capacity from India next week and quite a strong increase in capacity from Japan could result in the two countries swapping positions next week, whilst capacity in Russia increased by some 12% week on week so we are likely to finally see some movement in this chart. A 30% reduction in weekly capacity from Thailand places their position in the top 20 at risk next week should further capacity cuts follow this week; Iran is ready and waiting to take their place if required!
Table 2 - Scheduled Capacity, Top 20 Country Markets
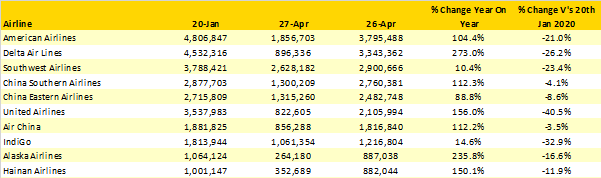
Comparing current airline capacity to those offered twelve months earlier provides an interesting reminder of how airlines tackled the early stages of Covid-19, Southwest Airlines operated some 2.6 million seats and American Airlines 1.8 million in the week of the 27th April; Delta Air Lines meanwhile cut capacity back to 900,000 seats. Roll forward to this week and all three carriers are operating at similar levels of capacity reduction when compared to their pre-Covid-19 levels with between 25%-20% fewer seats on sale.
Amongst the major US carriers, United Airlines remain at just 60% of their pre-pandemic capacity although of course the key measurement of any business is profitability and maybe United Airline’s approach will end up delivering better long-term results.
Table 3 – Top 10 Airlines
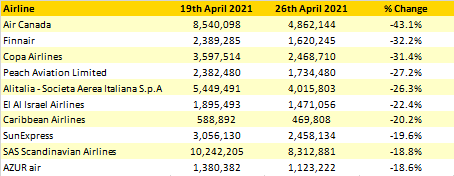
We mentioned earlier that nearly 26 million seats had been removed by airlines for the next two months and in total some 36.3 million for the rolling quarter. Applying a minimum criteria of 100,000 scheduled airline seats a week, we have identified the top ten airlines that have made capacity cuts for May – July in the last seven days and the scale of those cuts. Facing further travel restrictions and lockdowns, Air Canada heads the table cutting some 43% of their planned capacity for the next three months in the last seven days while both Finnair and COPA Airlines have cut nearly one-third of their capacity. Some of these airline capacity cuts are based around adjusting capacity back to the current levels being operated, but they also at the same time reflect how challenging this summer season is likely to be for many airlines.
Table 4 – Major Capacity Cuts, May – July 2021 – Weekly Changes
Tracking global capacity at the moment feels like being on a treadmill; you take a step forward but go nowhere. A small sign of positivity quickly gets quashed by news elsewhere of a new variant or spike in infection rates and the almost inevitable reduction in airline capacity that follows, typically in less than a week. It is therefore important to remember that we have made a number of significant steps in the global capacity recovery when compared to this time last year. We equally still have a long-way to go but we generally know the steps, processes and protocols that will be required to continue the aviation recovery.
This week could be an important step in shaping that recovery when the UK Governments Travel Taskforce announce their traffic light country listings. Not specifically because it is the UK but because it will also provide a broader insight on how the recovery is shaping up and which countries are likely to be open for business in the summer and beyond. Let’s hope that we get some good news later in the week…..surely they can’t mess this up can they?
To learn more about the data behind this article and what OAG has to offer, visit https://www.oag.com/.


Sign up to receive our stories in your inbox.
Data is changing the speed of business. Investors, Corporations, and Governments are buying new, differentiated data to gain visibility make better decisions. Don't fall behind. Let us help.


Sign up to receive our stories in your inbox.
Data is changing the speed of business. Investors, Corporations, and Governments are buying new, differentiated data to gain visibility make better decisions. Don't fall behind. Let us help.