

Source: https://www.oag.com/blog/us-aviation-market-recovery-airlines-experiment-new-network-strategies
Domestic airline capacity, and TSA volumes, a proxy for flight demand have increased significantly in the last few months and forward-looking airline capacity data is extremely positive; exciting times (at last) but what can we read in the schedules data and looking forward what is all of this likely to mean in the coming years. We’ve had a look at some key data points.
In January 2020, surrounded by uncertainty, limited confidence in vaccine roll out programmes and Covid-19 infection rates, US airlines were naturally cautious but equally thinking positively about the first half of the year. In truth, the first quarter of 2021 was a damp squib, the second quarter looks a bit soft but better than Q1 with increasing confidence about the second half of the year. At the beginning of the year, some 449 million domestic airline seats were scheduled for the first half of the year; today that stands at 348 million, a near one-quarter “shaving” off airline capacity. What could that mean for the second half of 2021?
Is it a year of two halves?
We’ve compared flight data for July over the last few years to see where airline capacity currently stands and importantly how the structure of that capacity is changing across the US domestic aviation market. There are certainly some changes taking place although a key question is how many of those are through short-term tactical responses to Covid-19 or deeper strategic changes.
The headline flight data would suggest that by July everything will have returned to near pre Covid-19 levels for both domestic and international airline capacity and whilst that would be a nice thought the reality is probably not quite so optimistic. Certainly, the domestic aviation market looks strong, airline capacity is currently planned at some 86.3 million which is within 2% of 2019 levels and aside from a rapid increase in infection rates that capacity is likely to stick.
Chart 1: US Domestic & International Capacity July 2019 – July 2021
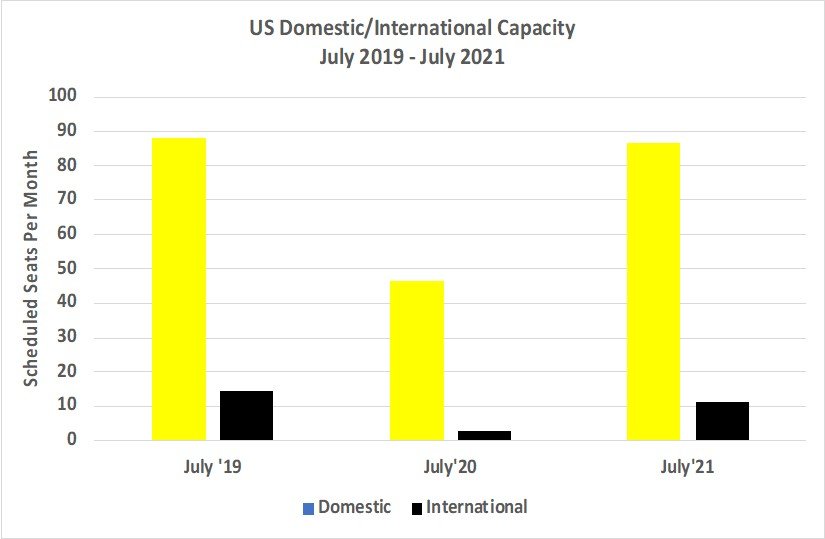
Unfortunately, the same cannot be said for international airline capacity which currently stands at 11.1 million; in May 2021 current international capacity from the US stands at 6.0 million (excluding Puerto Rico) of which one quarter is to Mexico and major markets such as the UK stand at 336,000 optimistic seats compared to 1.2 million in May 2019. Unless the much hoped for US – UK or US – Europe travel corridor, or perhaps more likely motorway appears very quickly then realising 11.1 million seats and supporting demand with a two-month lead looks more optimistic than realistic, especially if it takes six hours to clear immigration at London Heathrow.
Our assessment is that at best perhaps 60% of the current planned July airline capacity will actually operate, and if that is the case then the current planned 11.11 million is likely to be closer to 6.7 million. At that point the US domestic aviation market would account for around a 93% share of all seats offered in July, a dramatic and significant flip from July 2019 when domestic airline capacity held a 14% share.
Airline Domestic Winners & Losers
One of the few interesting things around aviation and Covid-19 is how airlines have responded and adjusted their networks to meet changing market conditions. As is always the case some are quicker and sharper to move than others, although first mover advantage in some cases does not mean winning!
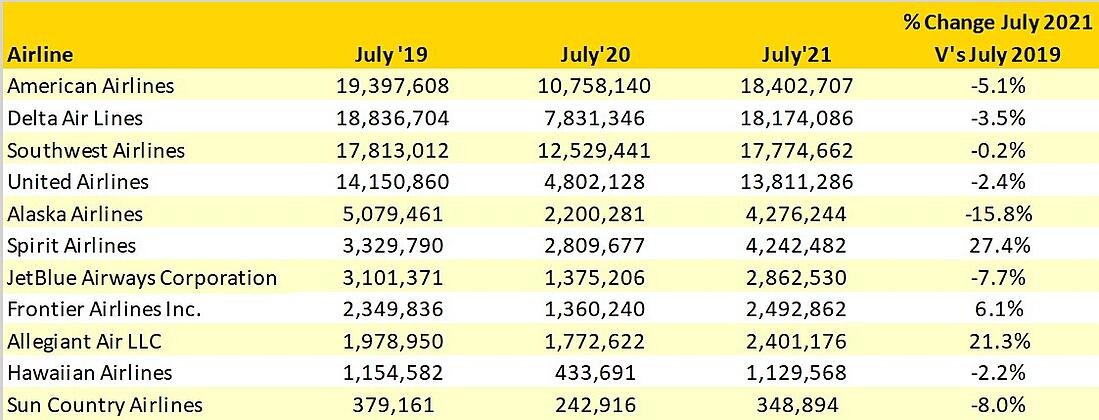
Three airlines lead capacity growth over the last three years, Spirit Airlines, Allegiant Air, and to a lesser degree Frontier, and all three carriers have one thing in common their low-cost operating model and flexibility of network. In fact, the low-cost airline share of domestic airline capacity has crept up to 35% compared to 32% in July 2019 and although that doesn’t sound a lot the impact of those seats in a depressed market on yields for legacy carriers that traditionally operated with high load factors could be dramatic. Just sometimes the type of capacity added can be more important than where or who added those seats.
Table 1: Top 10 US Airlines Domestic Capacity July 2019 – July 2021
Network Structures Continue to Change
Airlines are capable of being very flexible when they need to be and a global pandemic has certainly flexed many airlines. Much has been made of new flight routes being added in the last few months with a real focus on direct “hub by-pass” services and leisure destinations where daily frequencies are not essential.
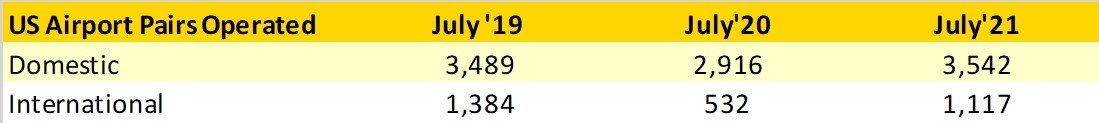
Some fifty-three new domestic airport pairs have been added for service in July compared to 2019 which is quite remarkable in the context of the wider global market but highlights one key factor in the pandemic that we have consistently noted; those airlines with access to large domestic markets have been able to maintain capacity at higher levels than those heavily exposed to international markets.
Table 2: Number of US Domestic Airport Pairs Operated July 2019 – July 2021
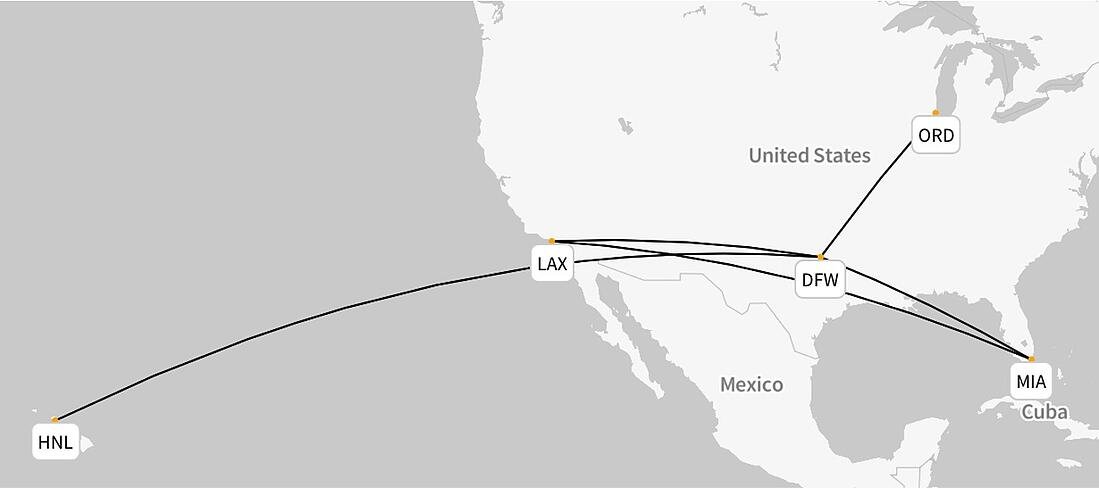
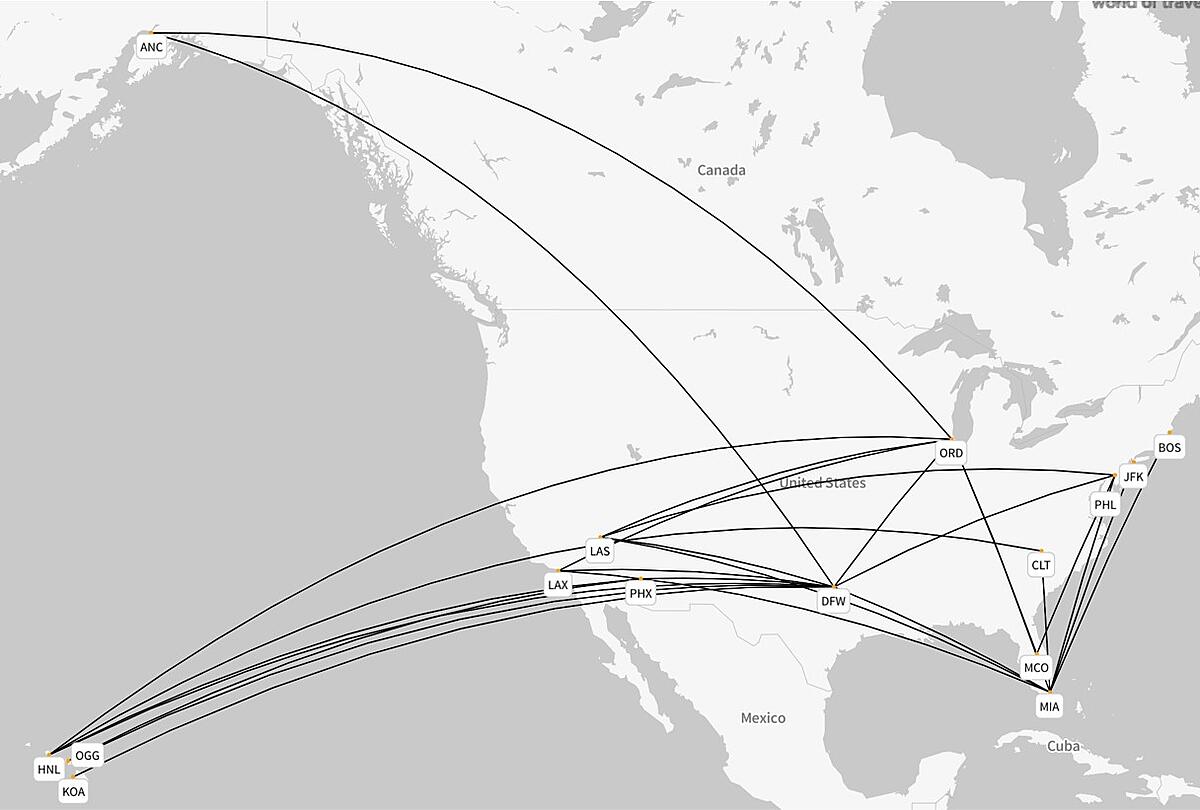
A key factor of course has been the availability of aircraft capacity as some international services were dropped some of the larger legacy carriers have placed more wide-bodied aircraft capacity into the market; American and Delta Air Lines both increasing the number of domestic services being operated. The two flight schedule network maps below highlight how American Airlines have added more wide-bodied services across their network year on year.
In July 2019, American Airlines operated 258 wide-bodied flights between their major hub airports and Honolulu with a focus on maintaining wider domestic flight connectivity through concentrating on a hub and spoke model of connectivity.
Map: 1 American Airlines Wide-bodied Domestic Network, July 2019
This July American Airlines will operate some 3,067 wide-bodied domestic flight services compared to only 1,344 in July 2019 which reflects the availability of such airline capacity at the moment and of course the strong demand for travel. The focus remains on connectivity between the carriers major hubs but twenty-seven domestic routes will “enjoy” wide-bodied capacity compared to fourteen two years earlier.
Map 2: American Airlines Wide-bodied Domestic Network, July 2021
Florida Sinks Under Increased Airline Capacity
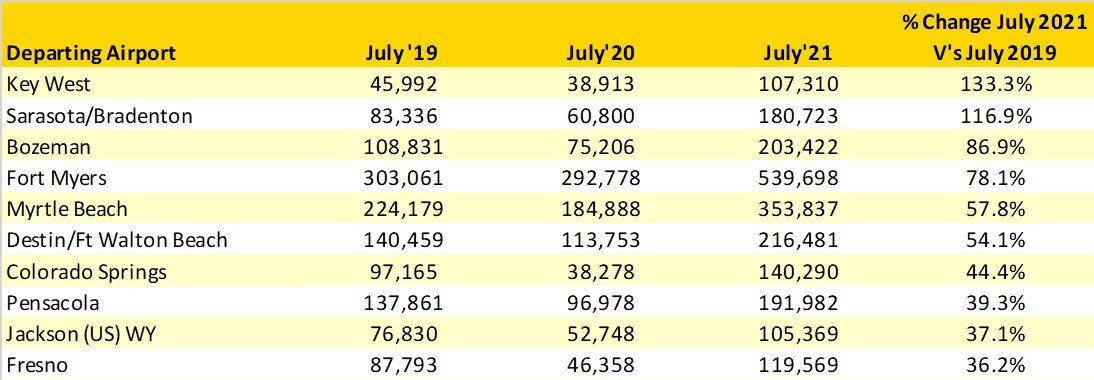
It’s official, Florida is sinking under the weight of new airline capacity being added to the sunshine state. Applying a minimum criteria of at least 100,000 scheduled airline seats in July 2021 the table below reveals the top growth markets compared to 2019. The top ten is dominated by airports in Florida, six of the top ten fastest growing are from the State with both Key West and Sarasota/Bradenton seeing capacity double, beyond the wildest dreams of probably any airport business development executive. For all of those airports seeing exceptional levels of capacity growth this moment in time is an opportunity to demonstrate the strength of their domestic markets and secure long-term services; some will achieve that objective. Others will, unfortunately, once international aviation markets re-open may see some of that new scheduled airline capacity disappear to high yielding opportunities that are again open for service, such network churn is a fact of life but equally an opportunity for some.
Table 3: Top 10 Fastest Growing US Domestic Airports, July 2019 V’s July 2021
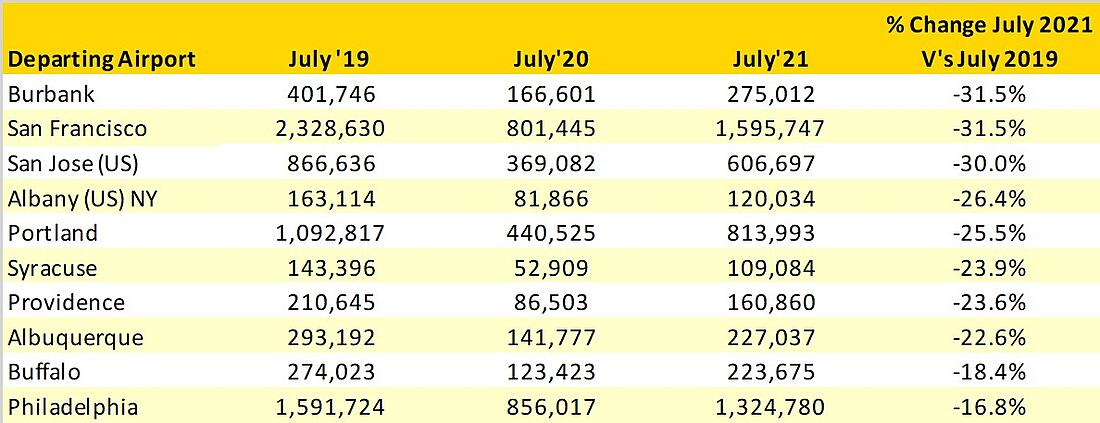
At the other end of the spectrum, there are airports that have seen significant capacity reductions both as a result of Covid-19 and in some cases changes of strategies by airlines and moves to nearby airports offering seemingly better market opportunity. Taking advantage of those opportunities explains the announcement of Avelo, a new US-based carrier launching services from Burbank; with plenty of room at the airport the announcement is a welcome development for the airport and opportunity for an airline.
Table 4: Top 10 Weakest Performing US Domestic Airports, July 2019 V’s July 2021
Normal Service Will Be Resumed Shortly
Covid-19 has had a profound impact on the airline industry, billions of dollars of cash reserves have been wiped out, skilled workers released and the wider economic impact immeasurable. The pace of aviation recovery continues to be slower than anticipated and the hoped-for second half of the year recovery increasingly in doubt. It has also created an environment where network changes and experiments are almost encouraged as airlines hunt the cash. Network planners have never been more challenged, tourism boards creative in their messaging, and airports creative in building new revenue streams; you could almost say it’s been exciting!
However, normal service will be resumed at some point, the key question is when. And when the recovery becomes stronger a clear path towards recovery could slowly lead to the “old normal” becoming the “new normal”. Some airlines will turn their attention towards the more lucrative international networks they previously operated, some of the current “hub by-pass” services will become “one-stop via Atlanta” points on a network and some of the airports enjoying a boom will see airline capacity reduced. It is inevitable.
But, out of all of the experimentation, some of the changes we are seeing now will stick. Increased low-cost airline capacity will by-pass hubs, some airports will have reinvented themselves and secured a larger slice of the market and some new airlines will have created new networks that capitalise on the changes in how we travel. Covid-19 may have caused immeasurable damage but in a bizarre way it has made airlines think long and hard about how they structure their networks and how best to serve their customers, and that has to be some good news surely.
To learn more about the data behind this article and what OAG has to offer, visit https://www.oag.com/.


Sign up to receive our stories in your inbox.
Data is changing the speed of business. Investors, Corporations, and Governments are buying new, differentiated data to gain visibility make better decisions. Don't fall behind. Let us help.


Sign up to receive our stories in your inbox.
Data is changing the speed of business. Investors, Corporations, and Governments are buying new, differentiated data to gain visibility make better decisions. Don't fall behind. Let us help.