Home price growth momentum speeds up further in February, up 12%
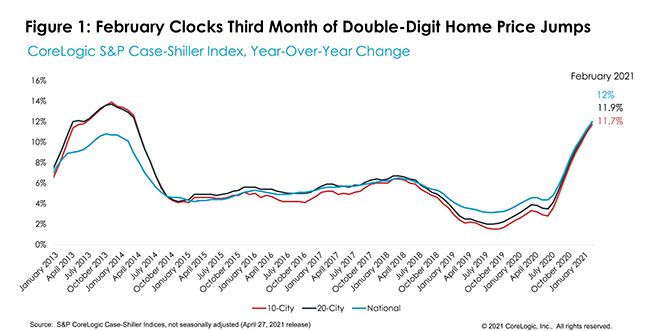
Strong acceleration of S&P CoreLogic Case-Shiller Index continued into early months of 2021 with the third consecutive double-digit increase – up 12% year-over-year in February. The month-to-month index also surged 1.05%, making it the strongest January-February increase since 2005.
Further acceleration in home price growth is reflecting many of the positive and continually improving signs of the economic recovery, including employment gains, consumer savings resulting from less discretionary spending over the last year, and hence more purchase power among home buyers, and still historically low mortgage rates. As a result, competition among buyers continues to intensify leading to fewer days on the market and higher offering prices than would be seasonally the case early in the year. However, as strong demand for housing continues to clash against exceptionally limited for-sale inventories, continued home price growth acceleration will likely narrow the pool of home buyers and diffuse some of the pressure on home prices in the second half of this year.
The 10- and 20-city composite indexes also continued the double-digit increase, up 11.7% and 11.9% year over year, respectively. Last time both indices saw similar rates of growth was in early months of 2014 (Figure 1). Compared to the prior peak, the 10-city composite is now 15% higher, while the 20-city composite is 19% higher than the previous peak both indexes reached in 2006.
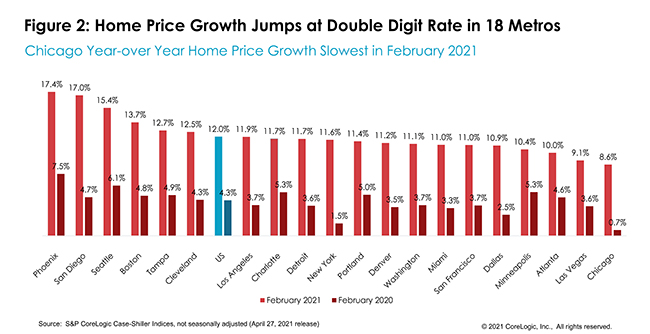
Ranking of metropolitan areas by price growth has remained consistent with previous months. For the 20th consecutive month, Phoenix ranked with the fastest home price growth among the 20 markets – surging 17.4% in February – the fastest acceleration since November 2013 and 3-percent-points higher than the growth registered in January.
San Diego moved to second place, with an annual increase of 17%, also jumping 4-percentage points from its January increase. Seattle is now third, with a 15.4% increase in February. Eighteen of the 20 cities saw double-digit home price growth in February. While San Diego had the strongest jump in price acceleration from a year ago – up 12.3-percent points, New York continued to rank with the second strongest acceleration, jumping 10.1-percent-points since February 2020.
Chicago and Las Vegas continued to be the laggards, both with high single digit price growth, up 8.6% and 9.1% respectively. Chicago and Las Vegas have been ranking lowest in price appreciation in recent months’ releases. Detroit, which has been missing in recent reports, clocked in a second double-digit increase, at 11.7% annual increase in home prices in February. (Figure 2)
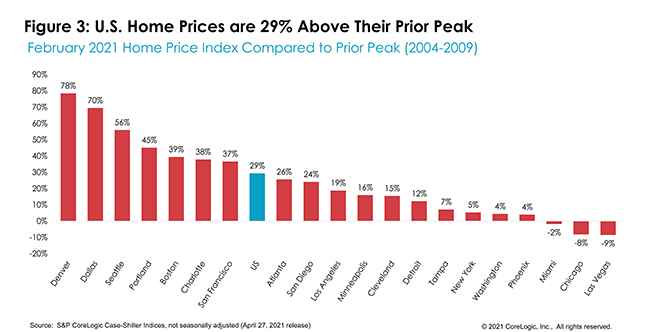
In January, national home prices were 29% higher than the previous peak. Three cities are still below their previous peaks: Las Vegas, Chicago and Miami, with only Miami experiencing some improvement from the month prior. Las Vegas and Chicago are still 8% and 9% below their previous peaks. Phoenix prices have now recovered above its prior peak and are now 4% higher. By contrast, Denver’s prices have leapt 78% above its 2006 peak, followed by Dallas at 70% (Figure 3).
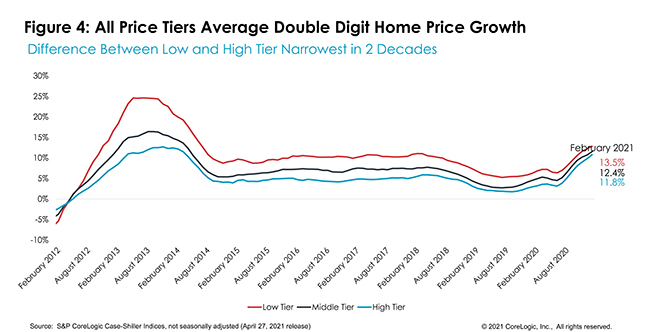
All three price tiers had double-digit growth for the third consecutive month. Home prices in the lower one-third of the price distribution jumped 13.5% on average in February. This was strongest growth among the three tiers as demand for entry-level homes continues to intensify. Still, the average growth among medium-tier priced homes was not far behind at 12.5%, while prices in the highest tier were up 11.8% on average. Interestingly, as demand for homes across all price ranges picked up in the recent year, the price acceleration rates between the low and high tier started to converge, leading to the narrowest difference between the two tiers in at least the last two decades (Figure 4).
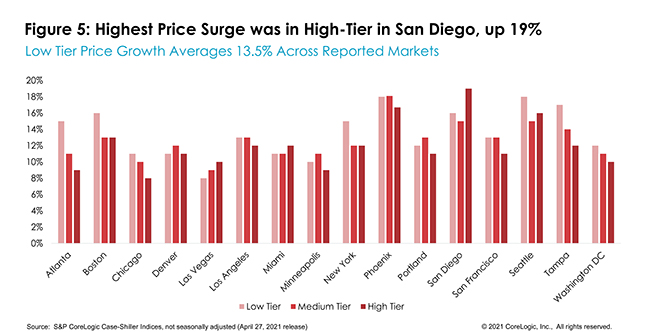
The largest home price increases within the lower one-third continued in Phoenix and Seattle, both up 18%, followed by a 17% increase in Tampa, Florida, and a 16% increase in Boston. Compared to pre-pandemic price growth in April 2020, New York’s low-tier prices had the fastest acceleration of 11 percentage points, followed by San Diego at 9.7 percentage points and San Francisco at 9.3 percentage points. In the high tier, San Diego’s price growth accelerated by 13.5 percentage points since last April, followed by an 11.1 percentage point acceleration in New York and 10.3 in Boston.
San Diego had the fastest acceleration in the high tier among all recorded cities and compared to its lower-priced tiers with a 19% jump in February (Figure 5).
In the early months of 2021, housing-market competition continued while the issue of ever-declining for-sale inventories persisted, driving home prices to new highs and raising concerns of market sustainability. And while affordability concerns are once again in the focal point in housing market discussions, consumers’ budgets have been bolstered by the slowing of discretionary spending over the last year. This is both helping consumers save and preventing potential buyers from making offers well above the asking price as they compete for few available homes. Nevertheless, with early signs of improving inventories and squeeze on many new buyers’ budgets due to high price tags and rising rates, some buyers will face buyer fatigue while the others won’t be able to afford what’s left on the market. As a result, pressure on home price appreciation should ease in coming months but remain in high single digits across most of the country.
To learn more about the data behind this article and what CoreLogic has to offer, visit https://www.corelogic.com/.


Sign up to receive our stories in your inbox.
Data is changing the speed of business. Investors, Corporations, and Governments are buying new, differentiated data to gain visibility make better decisions. Don't fall behind. Let us help.


Sign up to receive our stories in your inbox.
Data is changing the speed of business. Investors, Corporations, and Governments are buying new, differentiated data to gain visibility make better decisions. Don't fall behind. Let us help.