
ATTOM Data Solutions, curator of the nation’s premier property database, today released its first-quarter 2021 U.S. Home Sales Report, which shows that profits for home sellers nationwide were again up on an annual basis in yet another sign of how the housing market is fending off economic damage caused by the Coronavirus pandemic.
The report reveals that the typical first-quarter 2021 home sale in the United States generated a profit of $70,050. That was down from $75,750 in the fourth quarter of 2020 but still up 26 percent from $55,750 in the first quarter of 2020.
The typical $70,050 home-sale profit represented a 34.2 percent return on investment compared to the original purchase price – down from 37.1 percent in the fourth quarter of 2020 but still higher than the 30.8 percent level recorded a year ago.
Small dips in profits are common in the first quarter of the year as the home-buying season goes into its annual cold-weather lull. But the raw-profits as well as the return-on-investments on sales of median-priced homes in the first quarter of 2021, still stood at the second-highest points since the U.S. housing market began recovering from the Great Recession in 2012. They were among the many signs that the nine-year U.S. housing market boom continues to surge ahead even as the broader economy struggles to rebound from the pandemic’s effects.
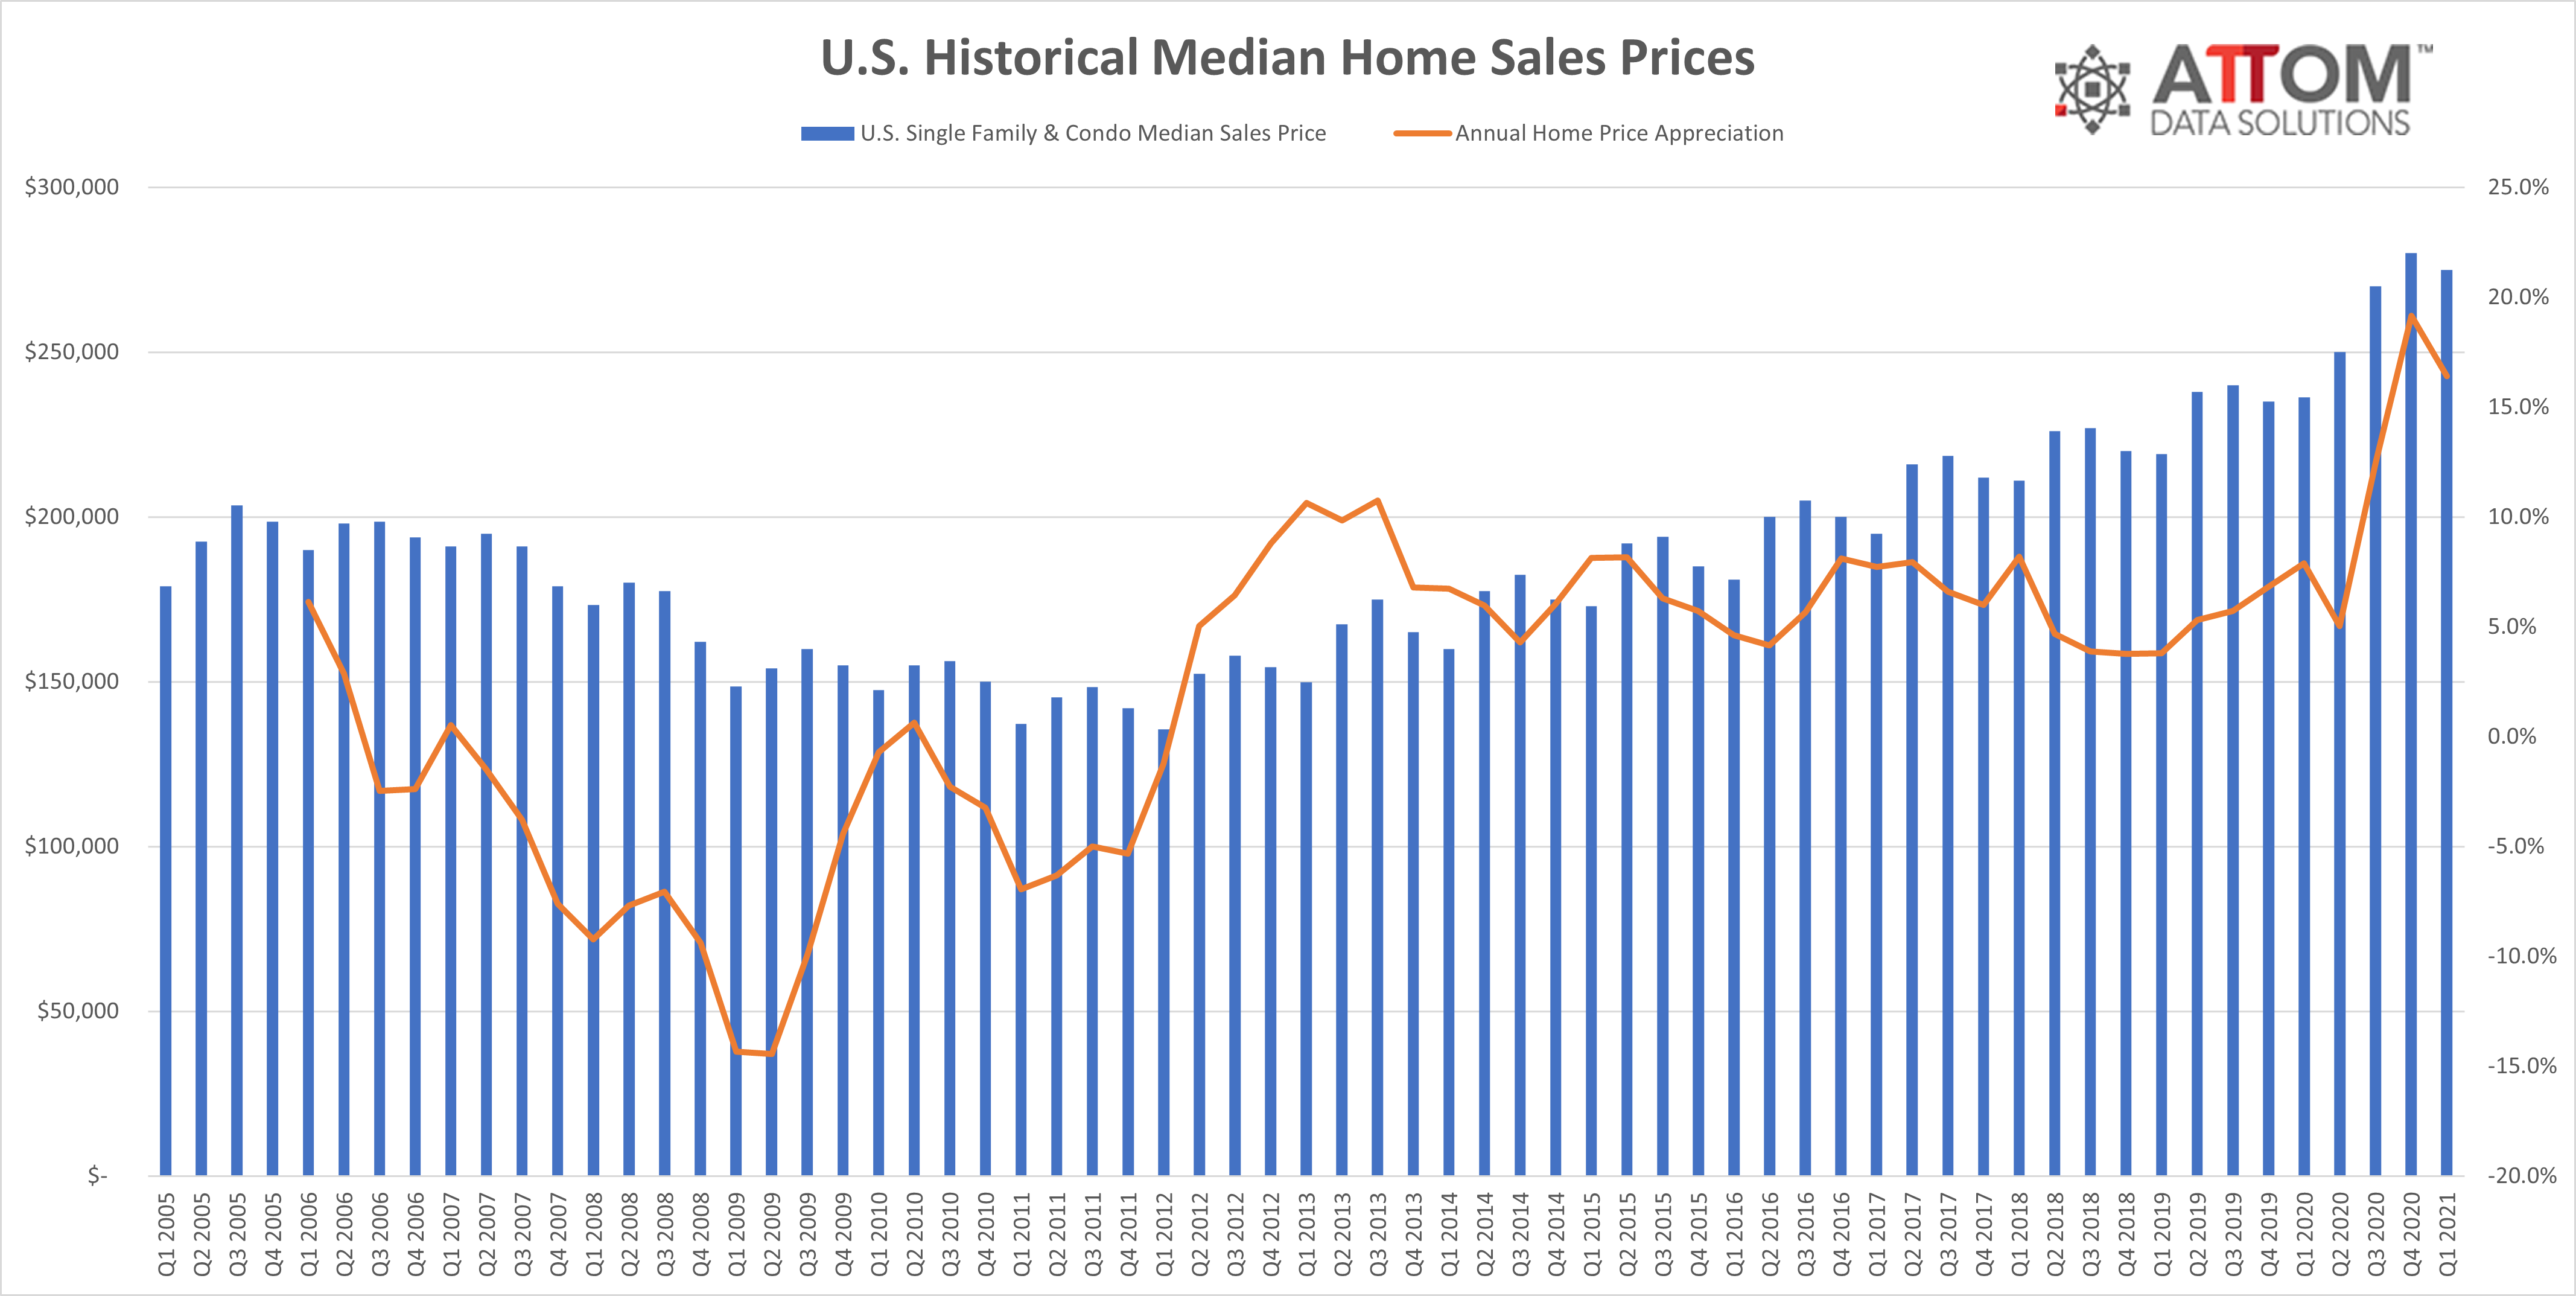
The elevated profits and profit margins in the first quarter of 2021 came as the national median home price decreased 2 percent from the fourth quarter of 2020, to $275,000, but remained 16 percent higher than where it stood a year ago. Median values, measured annually, rose in 97 percent of markets around the country with enough data to analyze, jumping by at least 10 percent in more than three-quarters of them.
“The latest data on home prices and seller profits across the U.S. provide the latest markers of how the U.S. housing market keeps roaring ahead even as major parts of the broader economy try to overcome the impact of the pandemic,” said Todd Teta, chief product officer at ATTOM Data Solutions. “However, the market did take a break from rising prices in the first quarter of 2021, and while that’s not unusual for the beginning of the year, it’s definitely something to keep on eye on as we move into the Spring buying season. The next few months will speak huge volumes about whether the market keeps barreling ahead. For now, though, sellers remain in the drivers seat, ringing up great profits.”
Profit margins climb in almost 90 percent of metro areas around nation
Typical profit margins – the percent change between median purchase and resale prices – rose from the first quarter of 2020 to the first quarter of 2021 in 131 (88 percent) of 149 metropolitan statistical areas around the United States with enough data to analyze. Metro areas were included if they had at least 1,000 single-family home and condo sales in the first quarter of 2021 and a population of at least 200,000.
The biggest annual increases in profit margins came in the metro areas of Knoxville, TN (margin up from 45 percent in the first quarter of 2020 to 122.1 percent in the first quarter of 2021); Nashville, TN (up from 48.2 percent to 92.1 percent); Boise, ID (up from 60.6 percent to 102.8 percent); Crestview-Fort Walton Beach, FL (up from 23.7 percent to 58.7 percent) and Chattanooga, TN (up from 38.1 percent to 72.5 percent).
Aside from Nashville, the biggest annual profit-margin increases in metro areas with a population of at least 1 million were in Columbus, OH (margin up from 38.6 percent to 60.6 percent); Baltimore, MD (up from 19.9 percent to 41.1 percent); Phoenix, AZ (up from 37.1 percent to 55.4 percent) and Seattle, WA (up from 66.7 percent to 83.3 percent).
Profit margins dropped, year over year, in just 18 of the 149 metro areas analyzed (12 percent). The biggest decreases were in Memphis, TN (margin down from 34.8 percent to 8 percent); Columbus, GA (down from minus 3.4 percent to minus 17.6 percent); Prescott, AZ (down from 48.9 percent to 36.4 percent); Barnstable, MA (down from 48.7 percent to 36.4 percent) and Santa Rosa, CA (down from 56.4 percent to 48.1 percent).
Aside from Memphis, the biggest annual decreases in metro areas with a population of at least 1 million were in Boston, MA (margin down from 45.5 percent to 39.2 percent); New Orleans, LA (down from 25.8 percent to 20.6 percent); Pittsburgh, PA (down from 36.4 percent to 31.7 percent) and St. Louis, MO (down from 25 percent to 21.6 percent).
Profit margins again highest in western markets
The West continued to have the largest profit margins on typical home sales around the country, with 16 of the top 20 returns on investment in the first quarter of 2021, from among the 149 metropolitan statistical areas with enough data to analyze. The top five, which also included two southern metros, were in Knoxville, TN (122.1 percent return); Boise, ID (102.8 percent); Nashville, TN (92.1 percent); San Jose, CA (89.8 percent) and Salem, OR (88.5 percent).
Sixteen of the 20 smallest margins were in the Southern region. The lowest were in Columbus, GA (minus 17.6 percent); Memphis, TN (8 percent); Shreveport, LA (8.6 percent); Lafayette, LA (9.3 percent) and Montgomery, AL (10.6 percent).
Almost every major metro area seeing home values rise
Despite the economic fallout from the Coronavirus pandemic, median home prices in the first quarter of 2021 surpassed figures from a year earlier in 97 percent of metropolitan statistical areas with enough data to analyze. Nationally, the median home price of $275,000 in the first quarter was up 16 percent from $236,250 in the first quarter of 2020, despite a 2 percent drop from the peak of $280,000 in the fourth quarter of last year.
The biggest year-over-year increases in median home prices during the first quarter of 2021 came in the metro areas of Crestview-Fort Walton Beach, FL (up 38 percent); East Stroudsburg, PA (up 34 percent); Montgomery, AL (up 33 percent); Ocean City, NJ (up 31 percent) and Mobile, AL (up 31 percent).
The largest annual increases in metro areas with a population of at least 1 million in the first quarter of 2021 were in Phoenix, AZ (up 20 percent); Seattle, WA (up 20 percent); Philadelphia, PA (up 20 percent); New York, NY (up 19 percent) and Buffalo, NY (up 19 percent).
Home prices in the first quarter of 2021 hit or tied new peaks in 40 percent of the metro areas in the report, including New York, NY; Los Angeles, CA; Houston, TX; Miami, FL and Boston, MA.
The largest year-over-year decreases, or the smallest increases, in median prices during the first quarter of 2021 were in Pittsburgh, PA (down 10 percent); Harrisburg, PA (down 2 percent); Charleston, SC (down 2 percent); Santa Rosa, CA (down less than 1 percent) and Brownsville, TX (up less than 1 percent).
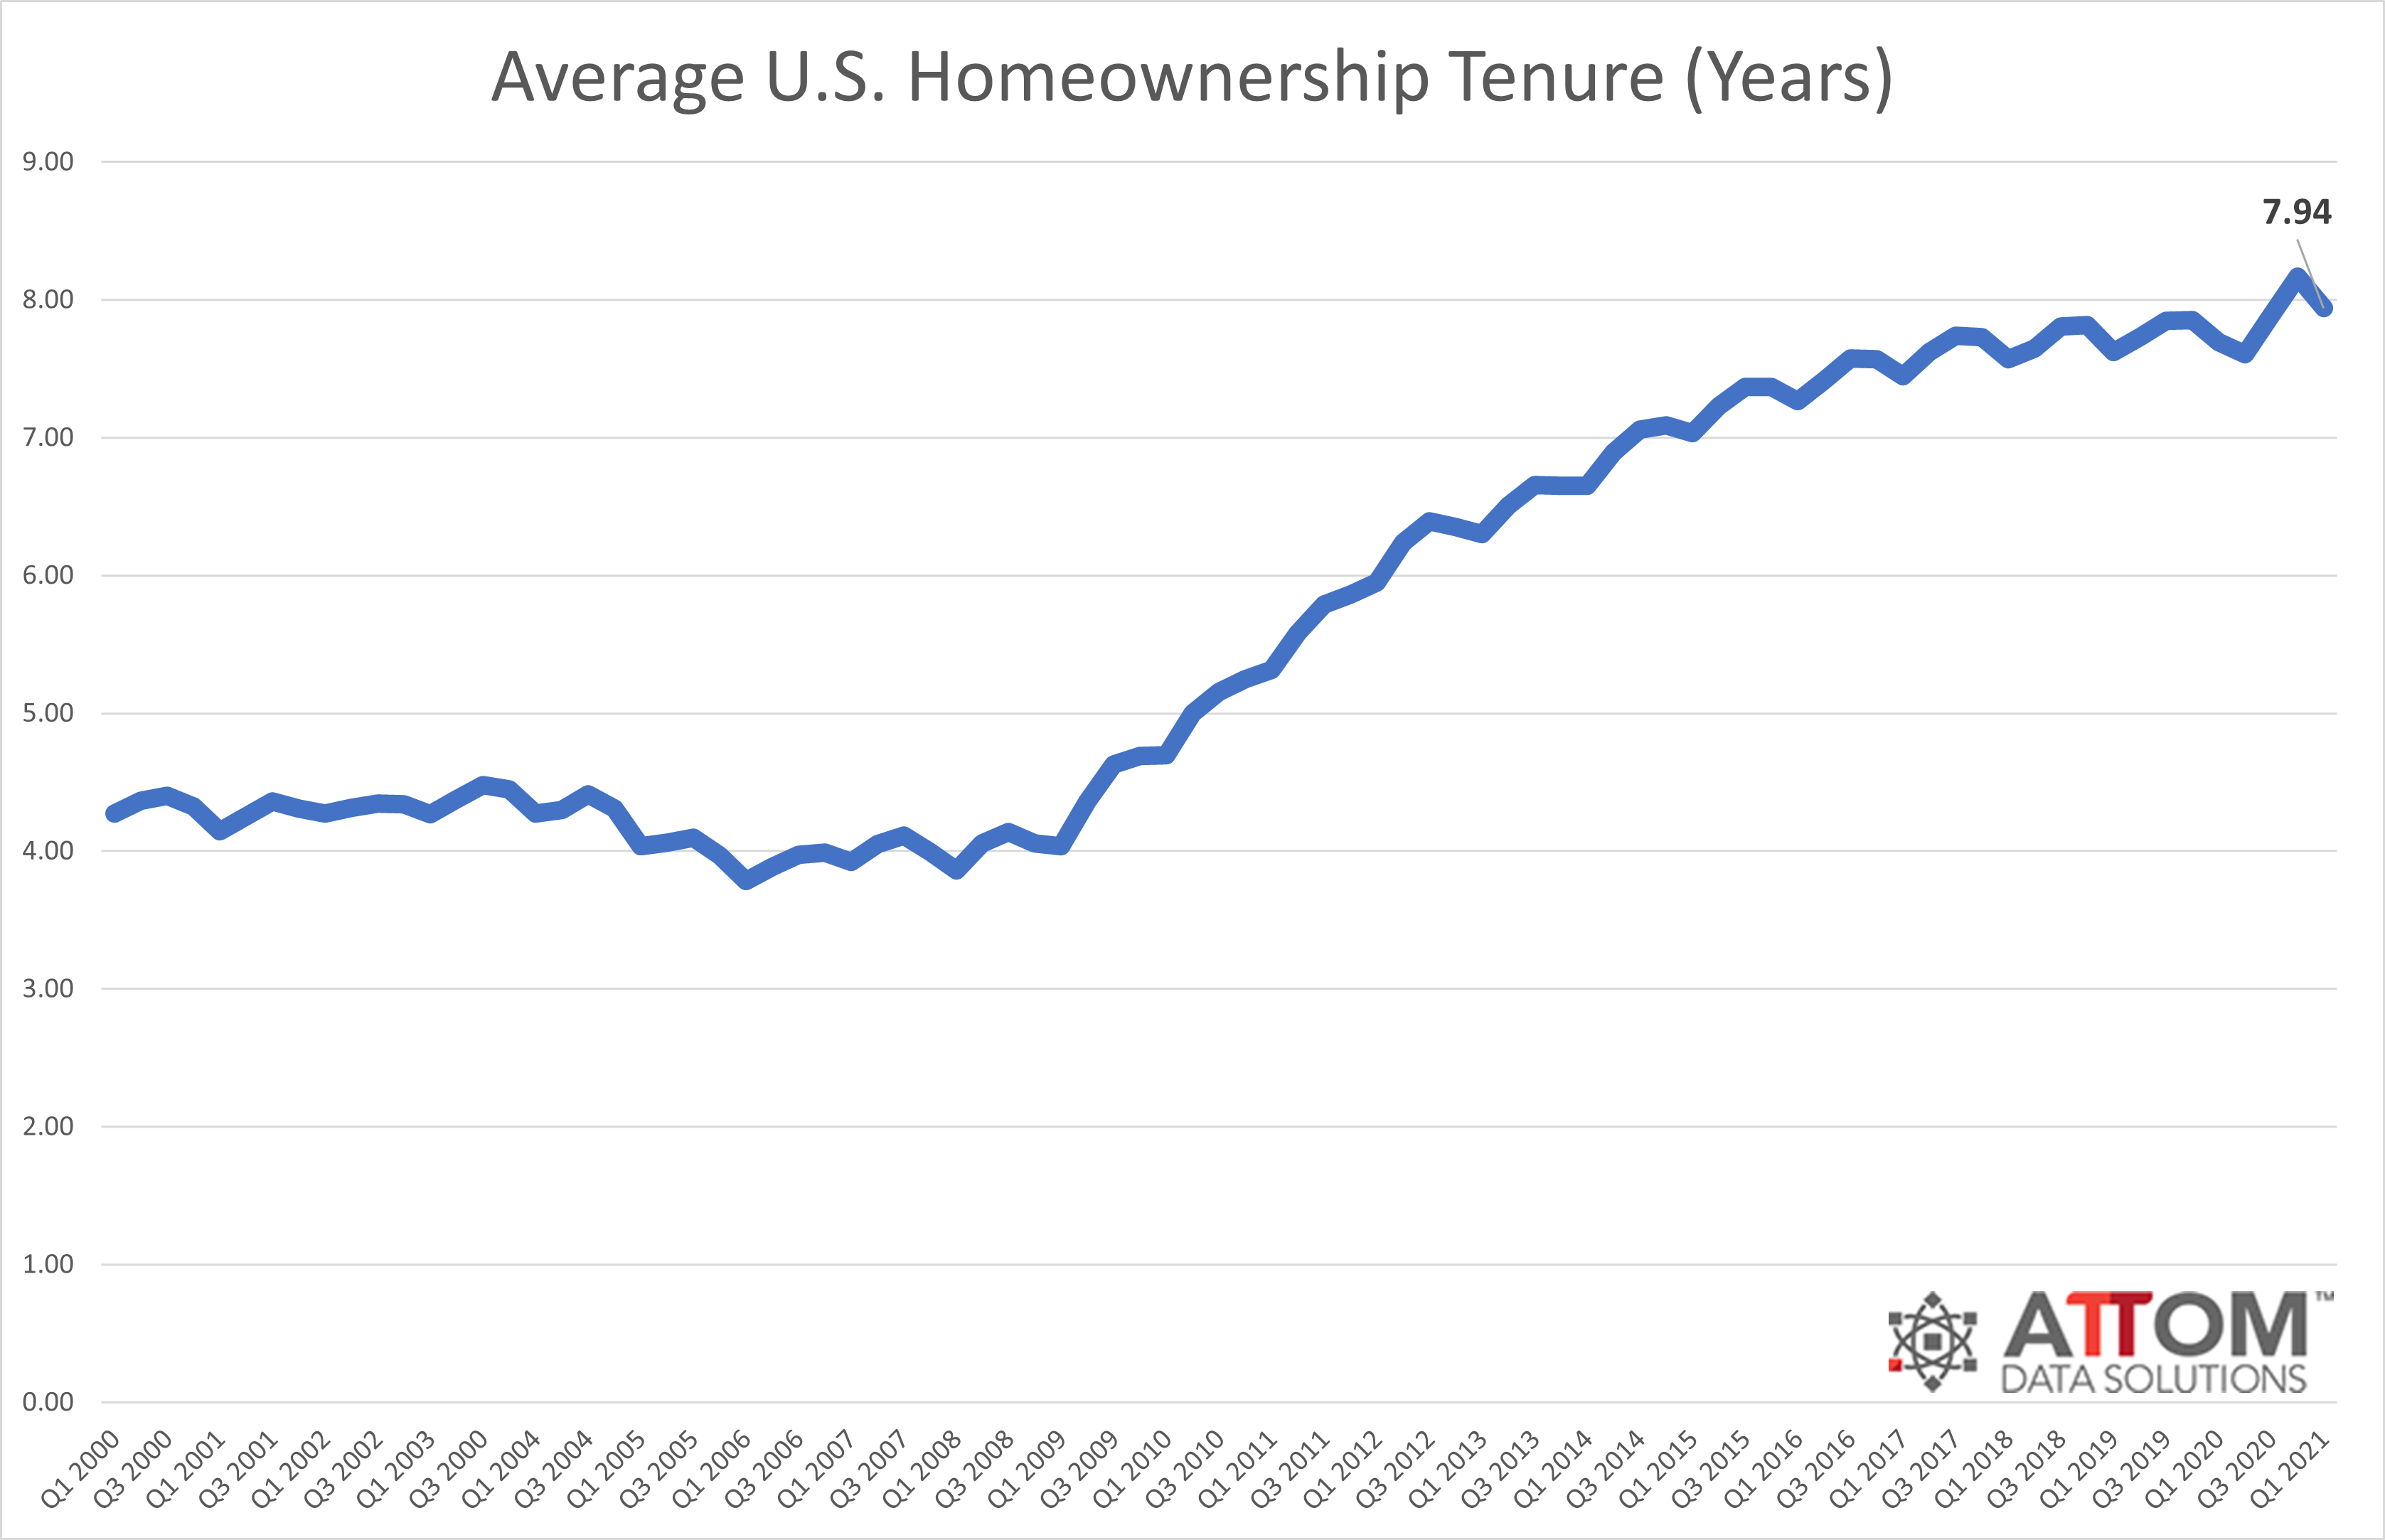
Homeownership tenure declines slightly nationwide
Homeowners who sold in the first quarter of 2021 had owned their homes an average of 7.94 years, down from the high for this century of 8.17 years in the fourth quarter of 2020, but up from 7.7 years in the first quarter of 2020.
Among metro areas with sufficient data, 61 percent saw increases in average tenure from the first quarter of 2020 to the first quarter of 2021. They were led by Manchester, NH (tenure up 25 percent); Madera, CA (up 15 percent); Atlantic City, NJ (up 12 percent); Stockton, CA (up 12 percent) and Cleveland, OH (up 9 percent).
The 25 longest average tenures among sellers in the first quarter of 2021 were all on the east or west coasts, with the top seven in California. They were led by Madera, CA (11.48 years); Oxnard, CA (11.29 years); San Luis Obispo, CA (11.21 years); Santa Rosa, CA (11.16 years) and Truckee, CA (11.04 years).
The smallest tenures during the first quarter of 2021 were in Crestview-Fort Walton Beach, FL (5.62 years); San Antonio, TX (5.65 years); Panama City, FL (5.66 years); Pensacola, FL (5.92 years) and Punta Gorda, FL (6.14 years).
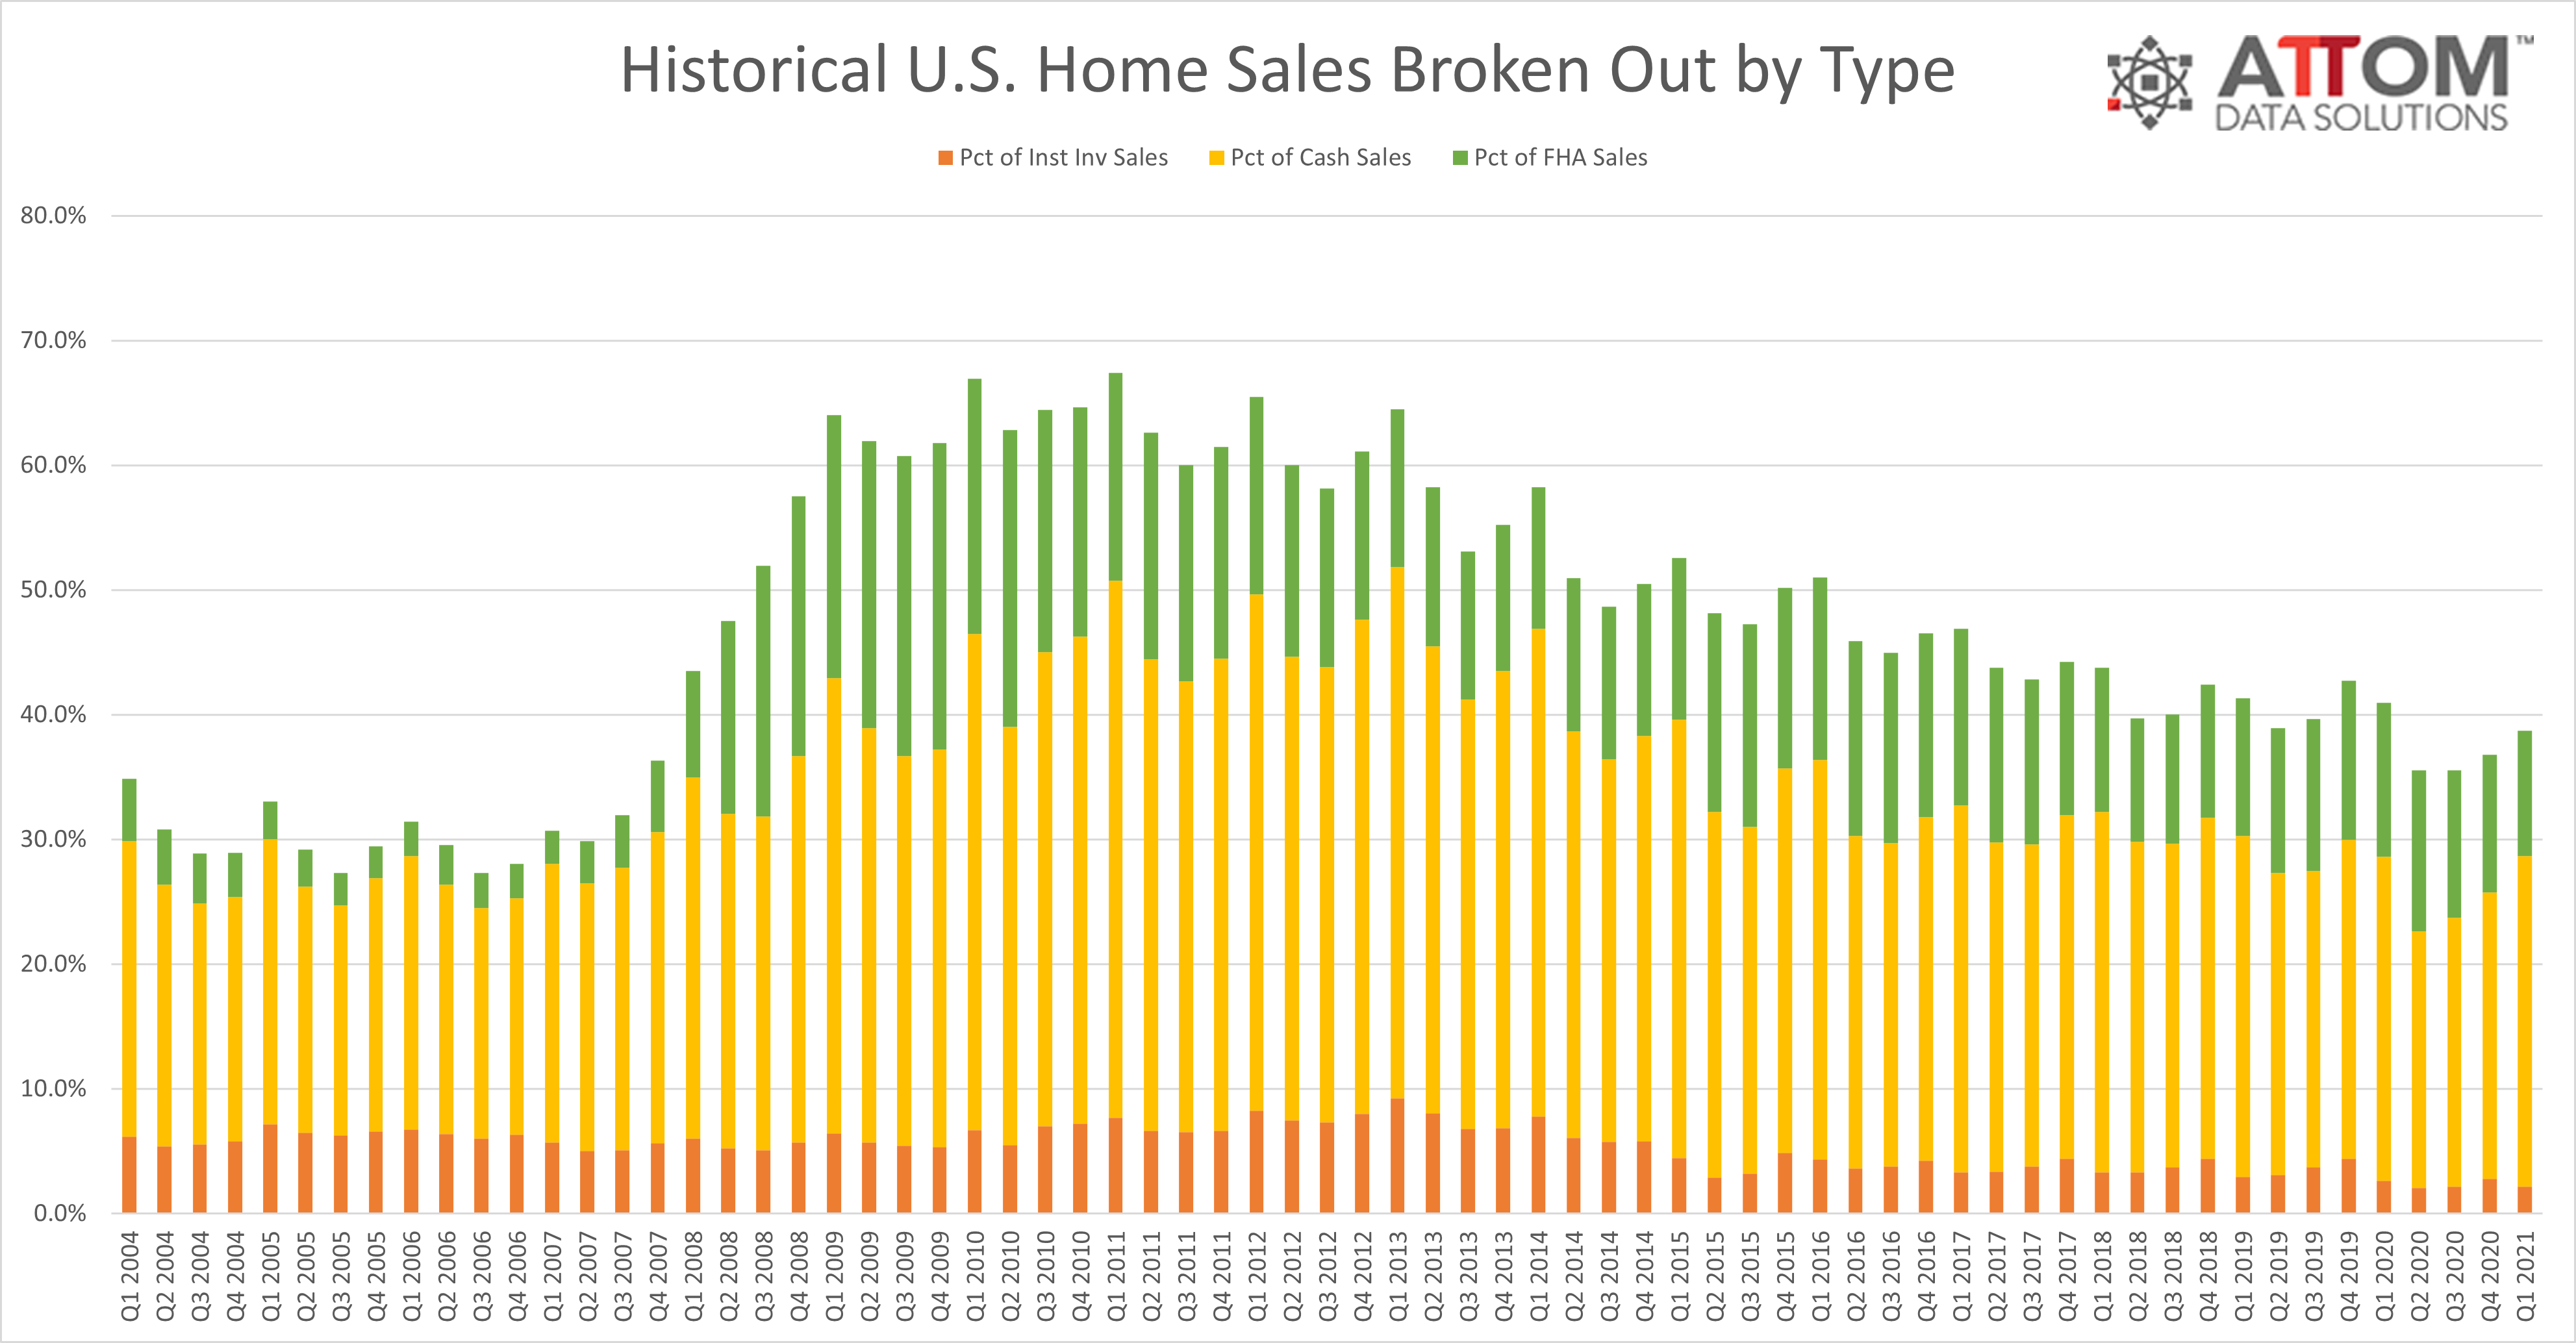
Cash sales up in first quarter of 2021
Nationwide, all-cash purchases accounted for 26.5 percent of single-family home and condo sales in the first quarter of 2021, the highest level since the first quarter of 2019. The first-quarter 2021 number was up from the 22.9 percent in the fourth quarter of 2020 and from 26 percent in the first quarter of last year.
Among metropolitan statistical areas with a population of at least 200,000 and sufficient cash-sales data, those where cash sales represented the smallest share of all transactions in the first quarter of 2021, included Myrtle Beach, SC (9.7 percent); Vallejo, CA (10.7 percent); Kennewick, WA (11.1 percent); Olympia, WA (11.7 percent) and Bremerton, WA (12.2 percent).
Those where cash sales represented the largest shares were Reno, NV (62.4 percent); Macon, GA (59 percent); Naples, FL (53.5 percent); Ocala, FL (51.2 percent) and Prescott, AZ (47.5 percent).
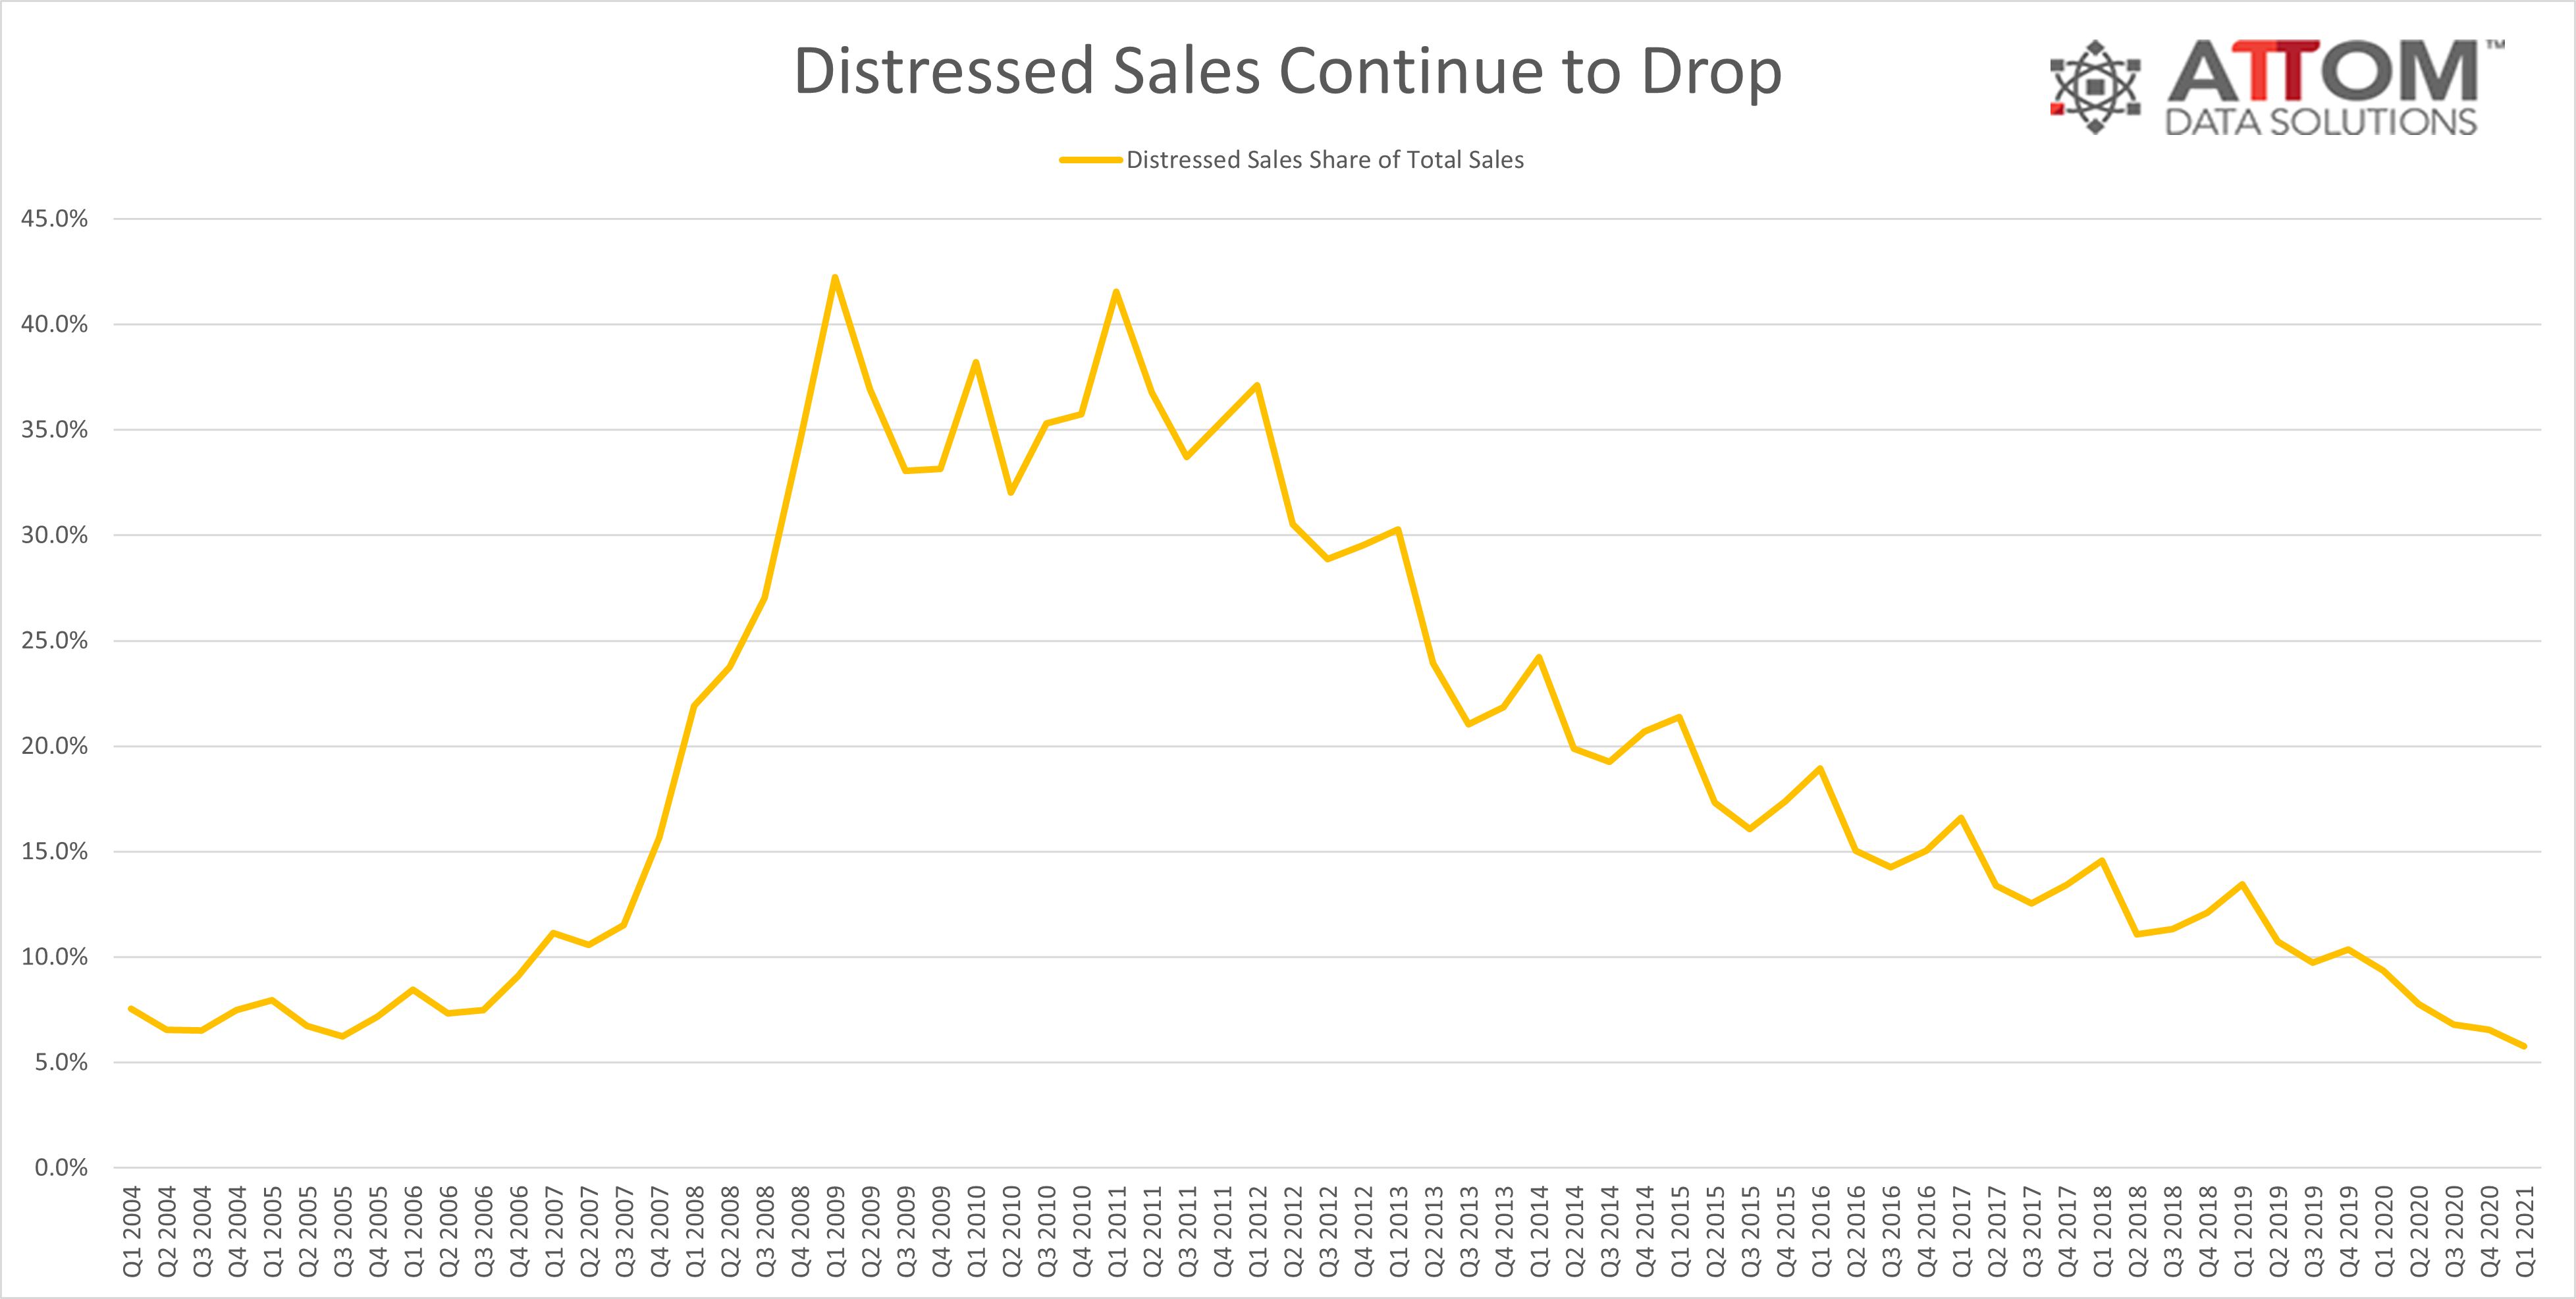
U.S. distressed sales drop further, now at a nearly 18-year low
Distressed home sales — including bank-owned (REO) sales, third-party foreclosure auction sales and short sales — accounted for just 5.8 percent of all U.S. single-family home and condo sales in the first quarter of 2021, the smallest portion since the fourth quarter of 2003. The latest figure was down from 6.6 percent in the fourth quarter of 2020 and from 9.4 percent in the first quarter of last year, to a point that was less than one-seventh of the 42.2 percent level hit in first quarter of 2009.
Among metropolitan statistical areas with a population of at least 200,000 and sufficient data, those where distressed sales represented the largest portion of all sales in the first quarter of 2021 included Chico, CA (19.3 percent of sales); Lynchburg, VA (18 percent); Akron, OH (14.9 percent); Cleveland, OH (14.8 percent) and Peoria, IL (12.8 percent).
Aside from Cleveland, metro areas with a population of at least 1 million that had the highest levels of distressed sales in the first quarter of 2021 were Baltimore, MD (12.2 percent of sales); Milwaukee, WI (11.3 percent); St. Louis, MO (10.7 percent) and Oklahoma City, OK (10.4 percent).
Metro areas with a population of at least 1 million where distressed sales made up the smallest portion of all sales in the first quarter of 2021 were Boston, MA (0.9 percent of sales); San Antonio, TX (1.8 percent); Nashville, TN (1.9 percent); Providence, RI (2 percent) and Hartford, CT (2.6 percent).
States where distressed sales comprised the largest portion of total sales in the first quarter of 2021 were Delaware (11.3 percent of all sales), Maryland (11.2 percent), Missouri (10.2 percent), Oklahoma (9.6 percent) and New York (9.6 percent).
The biggest annual declines in distressed sales rates were in Connecticut (down from 20.9 percent in the first quarter of 2020 to 2.7 percent in the first quarter of 2021), Rhode Island (down from 18 percent to 1.9 percent), Massachusetts (down from 13.8 percent to 1.4 percent), Nebraska (down from 10.6 percent to 0.9 percent) and New Hampshire (down from 10.2 percent to 1.3 percent).
South Dakota was the only state where the share of sales represented by properties in distress increased annually, going from 1.7 percent to 2 percent.
Institutional investment sales still near 20-year low
Institutional investors nationwide accounted for just 2.1 percent of all single-family home and condo sales in the first quarter of 2021, the second lowest level since 2000. The latest figure was down from 2.8 percent in the fourth quarter of 2020 and from 2.6 percent in the first quarter of 2020.
Among states with enough data to analyze, those with the smallest percentages of sales by institutional investors in the first quarter of 2021 were New York (0.4 percent of all sales), Virginia (0.6 percent) Pennsylvania (0.6 percent), Massachusetts (0.6 percent) and Louisiana (0.6 percent).
States with the largest levels of sales by institutional investors in the first quarter of 2021 were Mississippi (9.2 percent of all sales), Georgia (5.9 percent), Arizona (5.1 percent), North Carolina (4.9 percent) and Tennessee (4 percent).
FHA-financed purchases at nearly 13-year low
Nationwide, buyers using Federal Housing Administration (FHA) loans accounted for only 10 percent of all single-family home and condo purchases in the first quarter of 2021, the second-lowest level since 2008. The latest figure was down from 11.1 percent in the previous quarter and from 12.3 percent a year earlier.
Among metropolitan statistical areas with a population of at least 200,000 and sufficient FHA-buyer data, those with the highest levels of FHA buyers in the first quarter of 2021 were Beaumont, TX (27.2 percent of all sales); Amarillo, TX (25 percent); Visalia, CA (24.2 percent); Las Cruces, NM (24 percent) and Merced, CA (23.4 percent).
Definitions
All-cash purchase: sale where no loan is recorded at the time of sale and where ATTOM has coverage of loan data.
Homeownership tenure: for a given market and given quarter, the average time between the most recent sale date and the previous sale date, expressed in years.
Home seller price gains: the difference between the median sales price of homes in a given market in a given quarter and the median sales price of the previous sale of those same homes, expressed both in a dollar amount and as a percentage of the previous median sales price.
Institutional investor purchases: residential property sales to non-lending entities that purchased at least 10 properties in a calendar year.
REO sale: a sale of a property that occurs while the property is actively bank owned (REO).
Short sale: a sale of a property where the sale price is less than (short) the combined amount of loans secured by the property.
Third-party foreclosure auction sale: a sale of a property that occurs at the public foreclosure auction (trustee’s sale or sheriff’s sale) in which the property is sold to a third-party buyer and does not transfer back to the foreclosing bank.
To learn more about the data behind this article and what Attom Data Solutions has to offer, visit https://www.attomdata.com/.


Sign up to receive our stories in your inbox.
Data is changing the speed of business. Investors, Corporations, and Governments are buying new, differentiated data to gain visibility make better decisions. Don't fall behind. Let us help.


Sign up to receive our stories in your inbox.
Data is changing the speed of business. Investors, Corporations, and Governments are buying new, differentiated data to gain visibility make better decisions. Don't fall behind. Let us help.