U.S. Market Recovery Monitor - 24 April 2021
Hotel performance growth appears to be on hold when compared with the solid gains seen during the spring break period. In a week-over-week comparison, U.S. hotel occupancy was flat during 18-24 April at 57.3%. On a total-room-inventory (TRI) basis, which includes temporarily closed hotels, occupancy was 54.4%. Weekly room demand increased slightly and remained above 21 million for a sixth consecutive week.
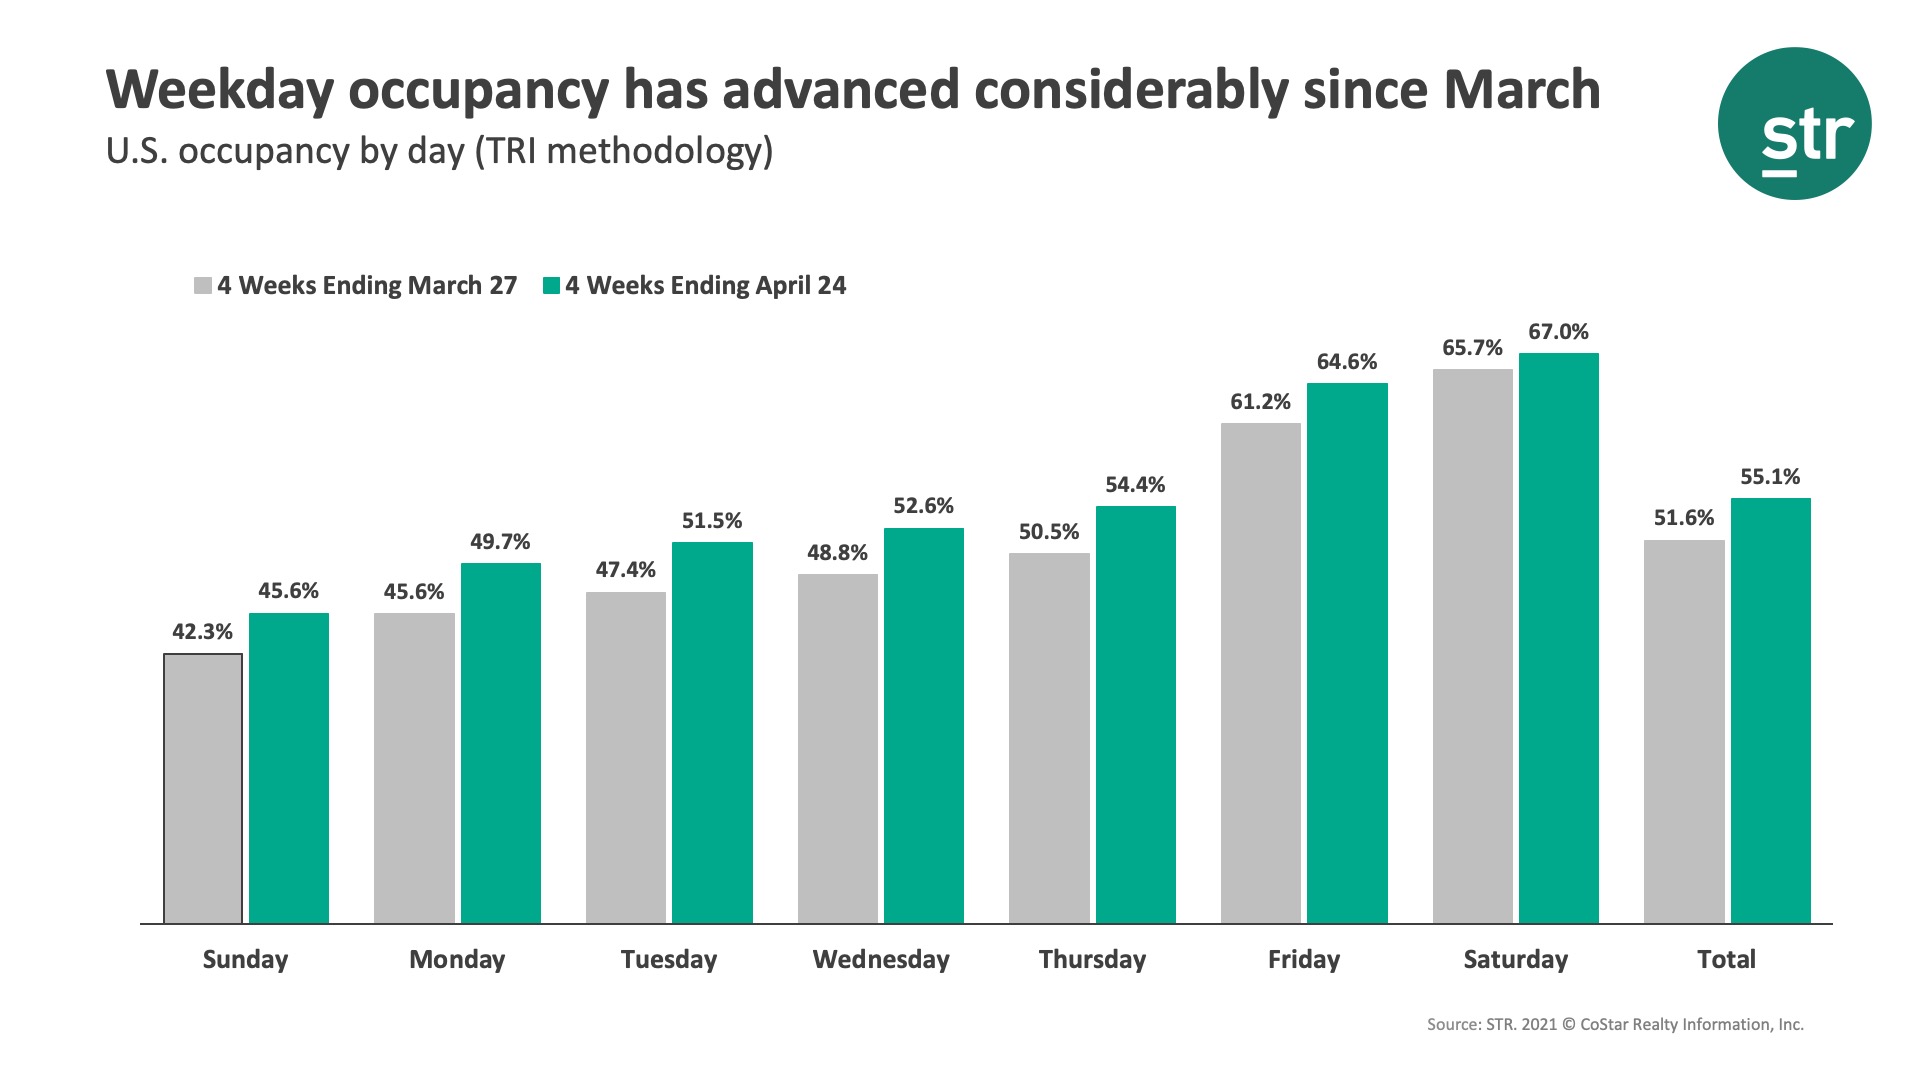
Like in the previous week, weekend occupancy was above 70% (67% TRI). The emerging story is the gain in weekday occupancy, which has been growing steadily over the last month. In reviewing the room demand growth in the past four weeks versus the previous four weeks, weekday demand increased an average of 16% over the period versus a 10% increase on weekends.
The percentage of hotels with weekly occupancy above 60% went unchanged and remained above 52%. Large hotels, those with 300+ rooms, had the largest weekly occupancy gain week on week (+0.4pts) but occupancy stayed low on an absolute basis. When indexed to the comparable week in 2019, room demand for large hotels was less than half. Room demand for small (under 75 rooms) and medium (75-299 rooms) hotels continued to be strong as these types of hotels have regained 90%+ of the demand they had in 2019 during the past six weeks. Occupancy for small to medium hotels was 60% in the fortnight.
Room demand fell across the big three states (Texas, Florida & California), where weekly room demand has been above two million for the past six weeks. Florida had the largest room demand decrease, but weekly occupancy remained solid at 65% (TRI) and among the highest in the country. Occupancy in Texas, where demand fell the least of the three, was 62% (TRI) and flat from the previous week. Demand in both Texas and Florida was close to the level seen in the comparable week of 2019. Twenty-two states captured more than 90% of their 2019 room demand this past week with several surpassing the 2019 level.
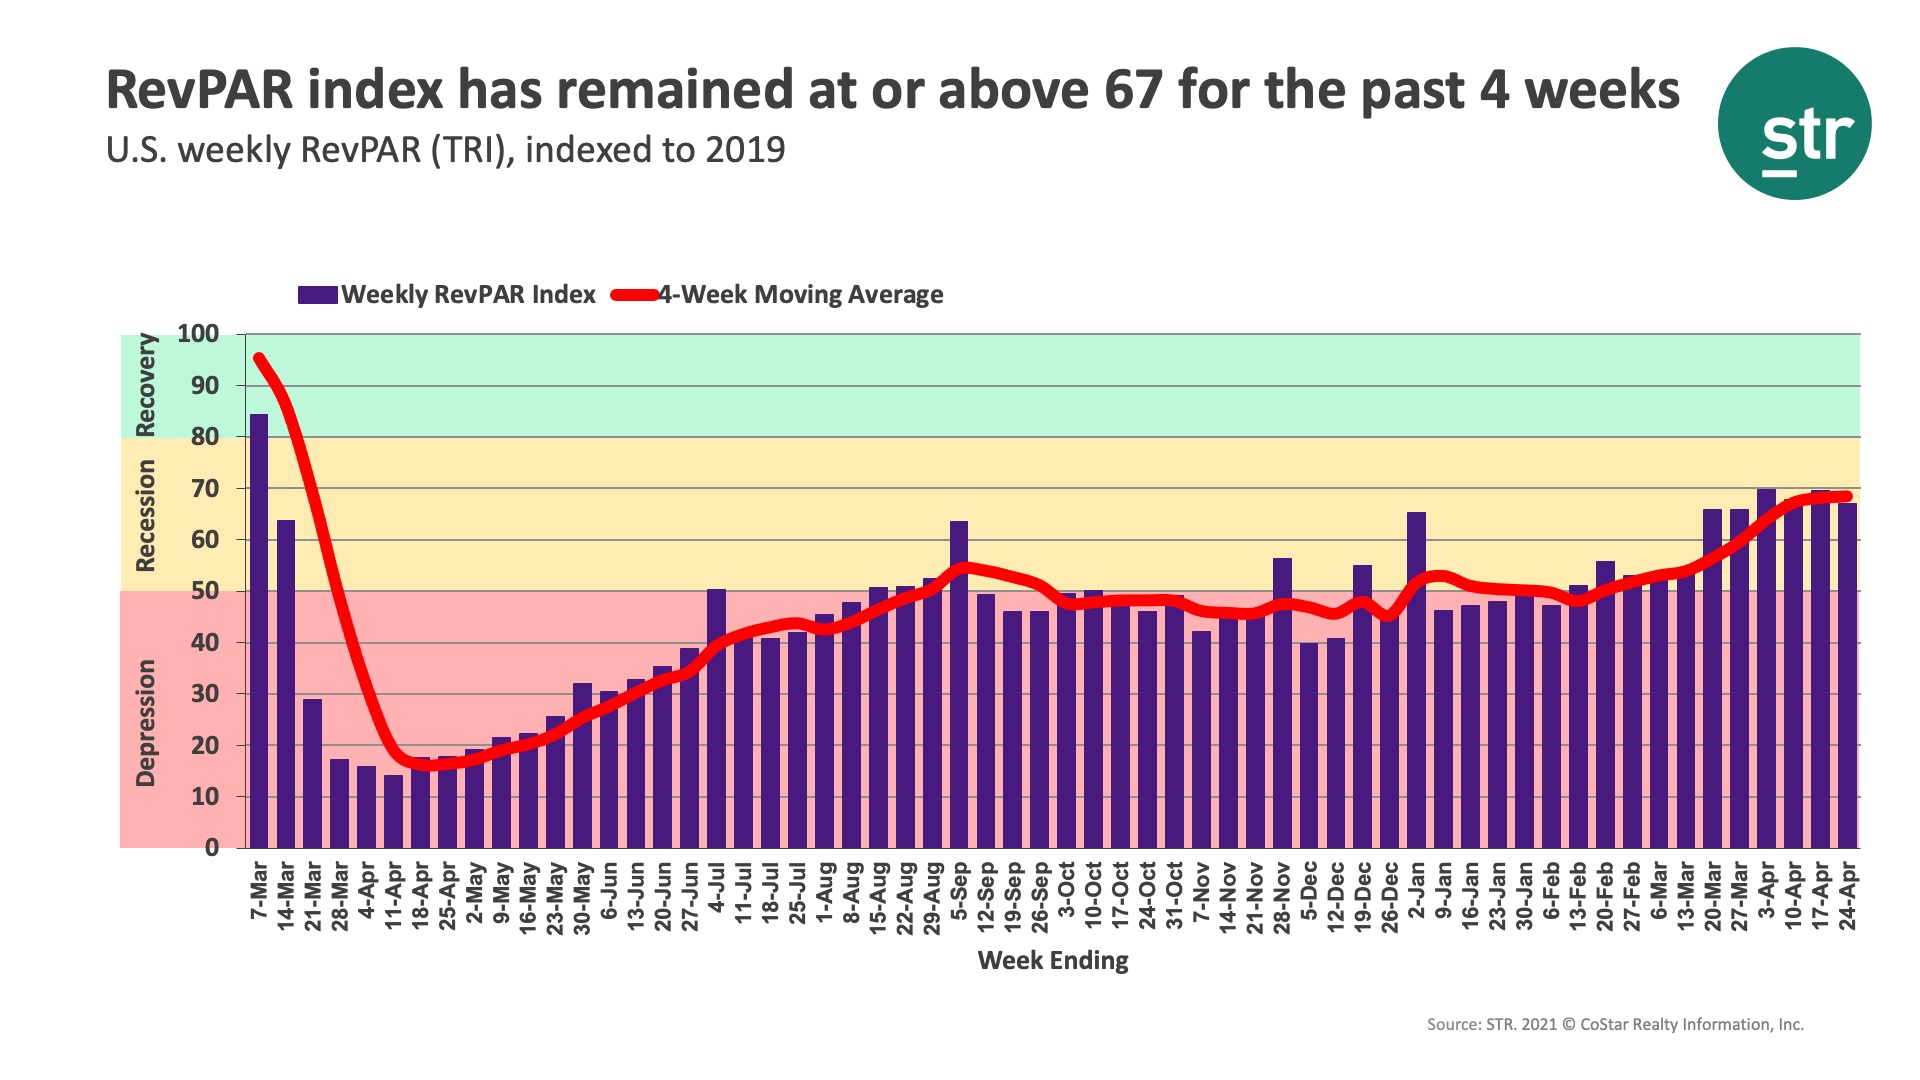
Revenue per available room (RevPAR) rose 1% week on week (0.7% TRI) and indexed at 70 (67 TRI) when compared with 2019, meaning that RevPAR was 70% of what it was in the corresponding week of 2019. Thus, the industry is still in the “Recession” stage, as defined by STR. RevPAR indexed to 2019 has been at or above 70 for the past four weeks.
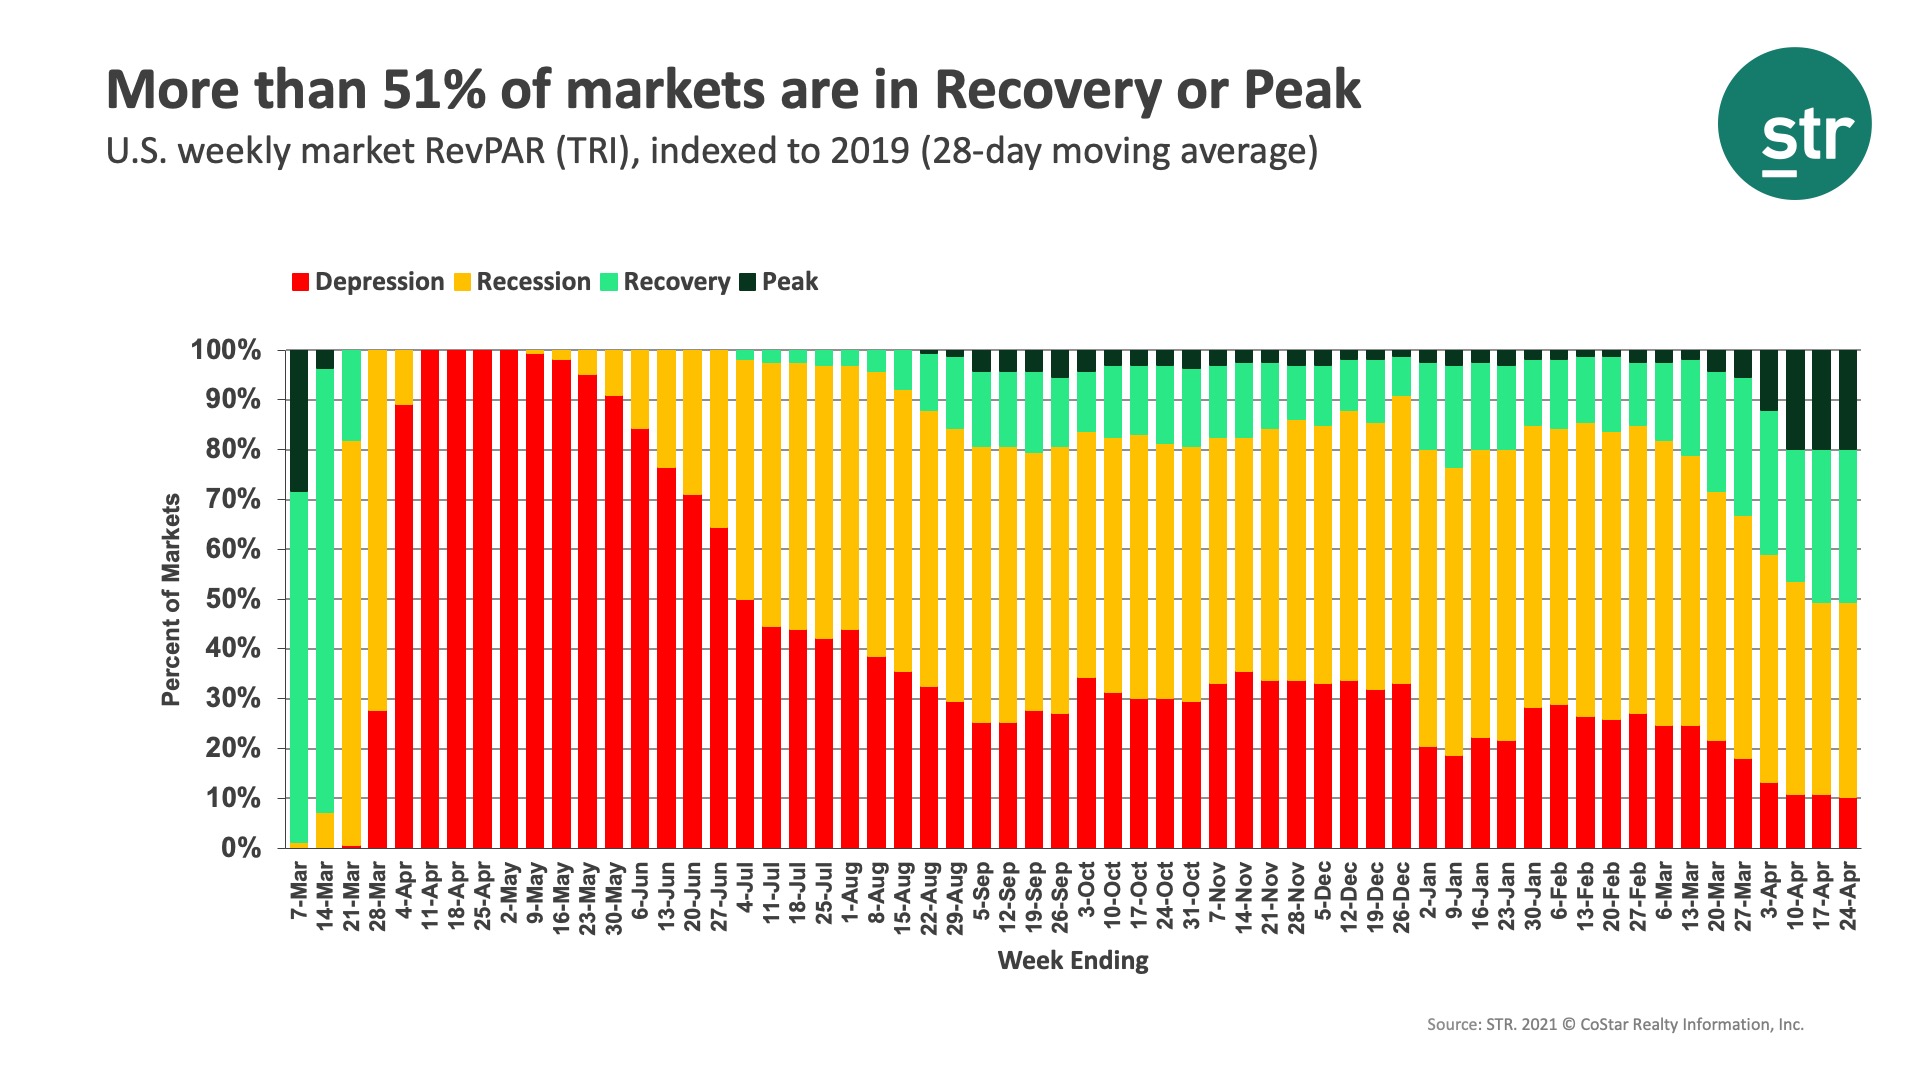
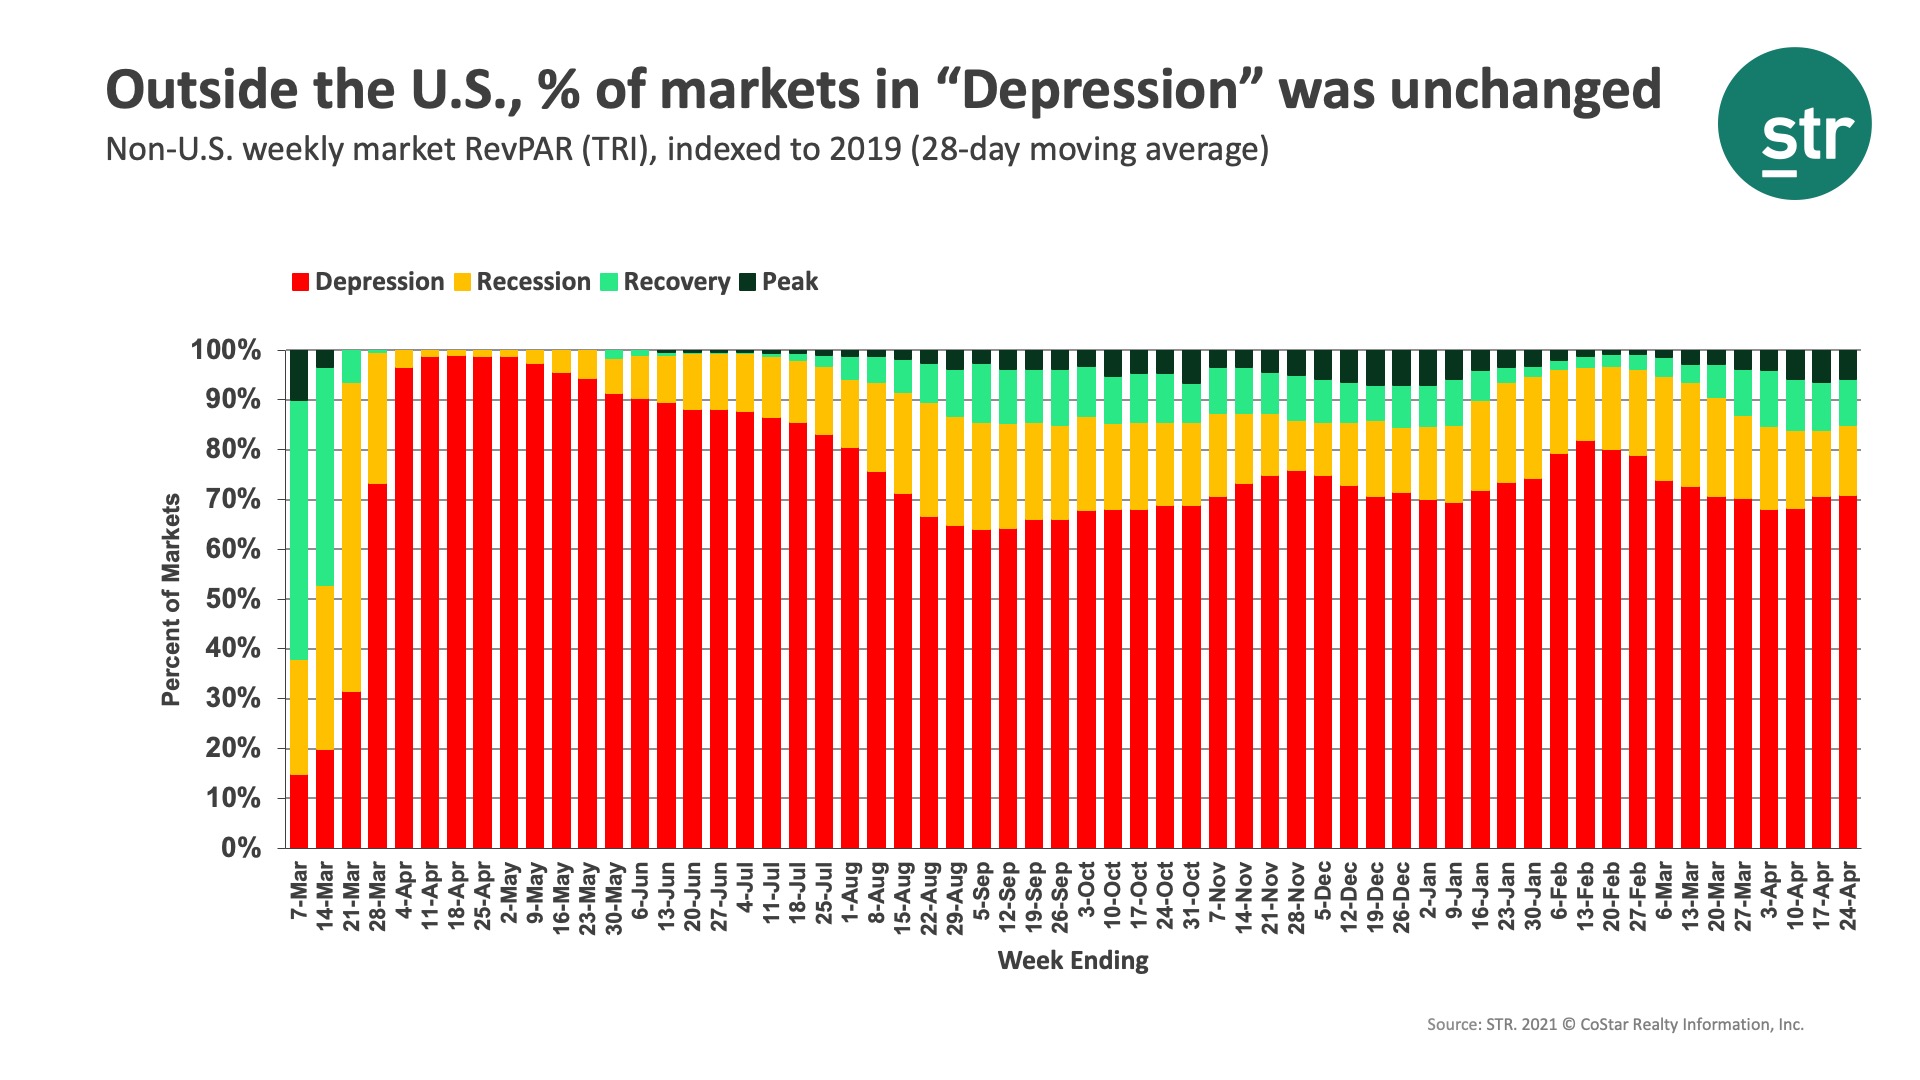
More markets were in the “Recovery” or “Peak” categories since the start of the pandemic. This week, 51% of the 166 markets were in one of those two categories on a TRI basis. Seventeen markets, down from 18 in the past two weeks, remained in the “Depression” category. San Francisco and New York were at the bottom with an index under 22. Outside the U.S., the percentage of markets in “Depression” remained unchanged from the previous week at 71%.
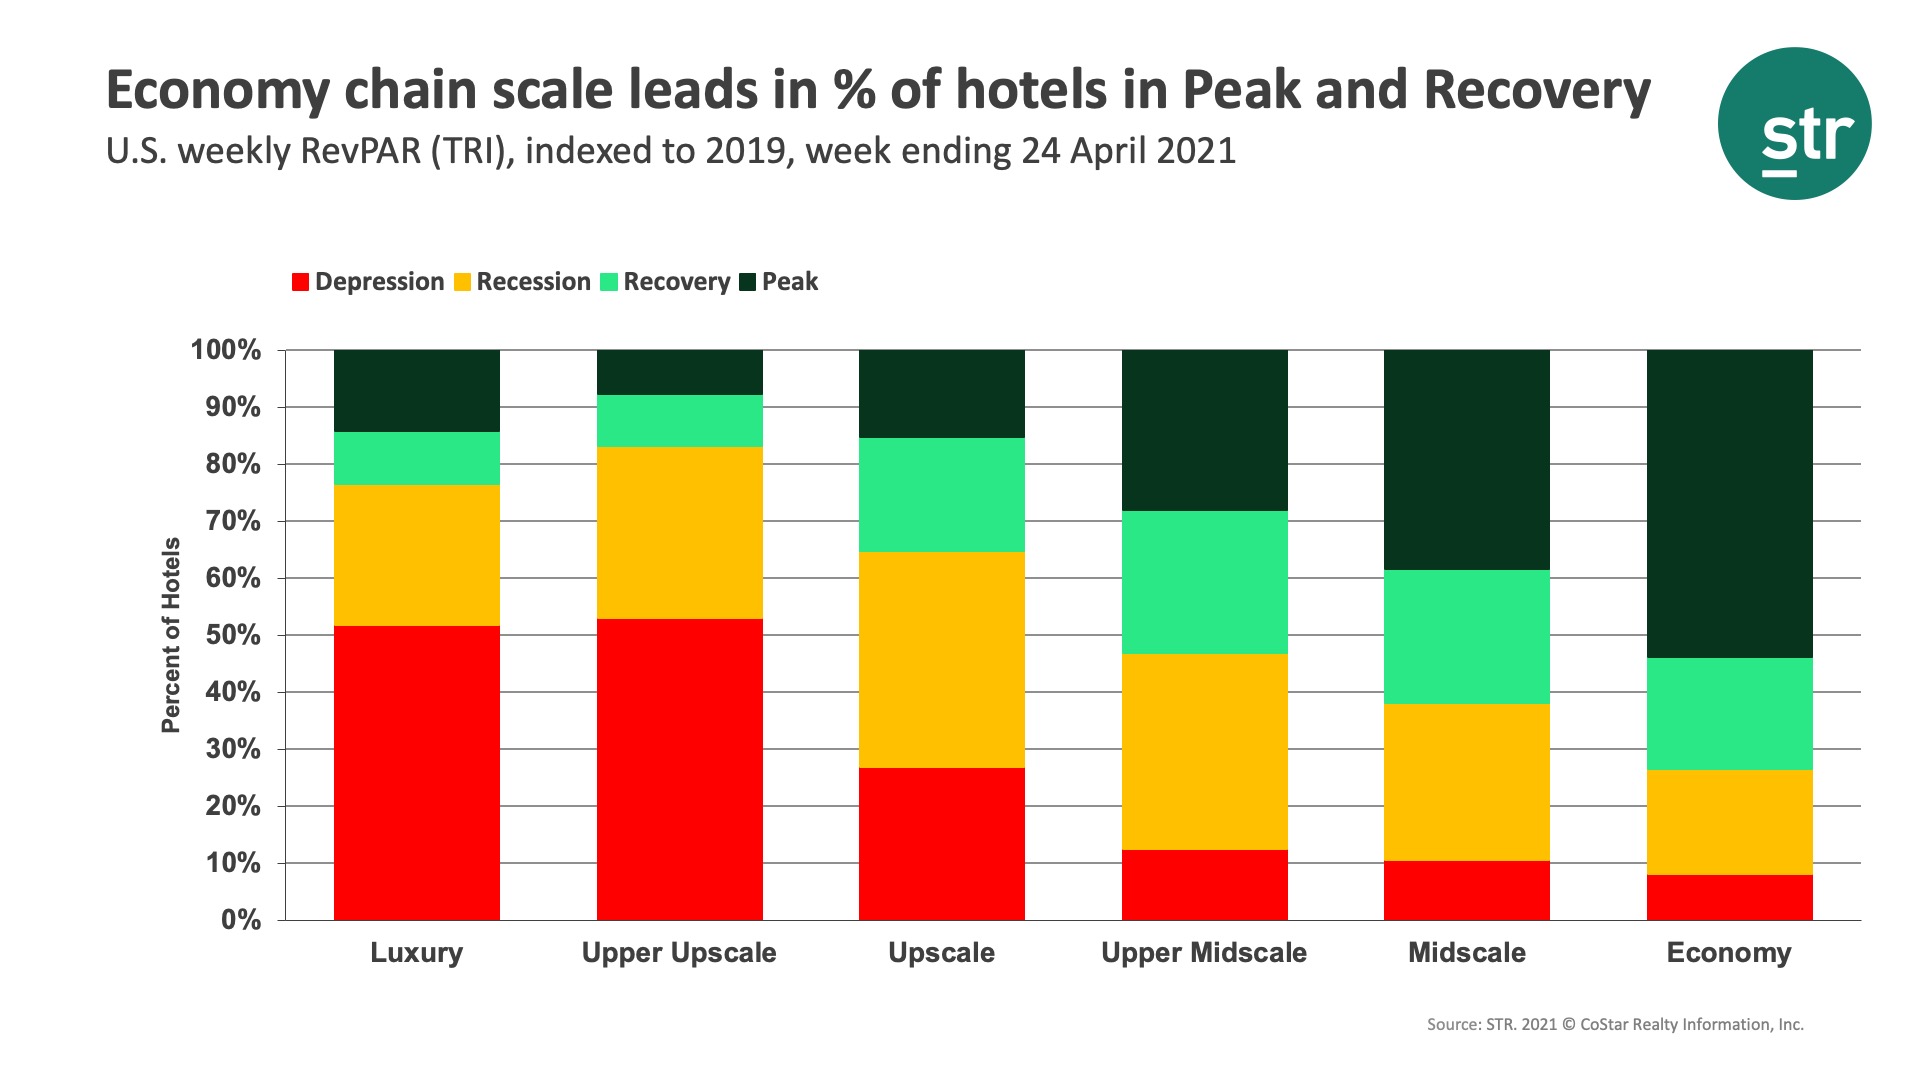
Looking at the U.S. chain scale demand relative to 2019, Economy had the highest weekly index (99) as it has for most of the year, whereas Upper Upscale had the lowest (44). Taking a closer look, 54% of reporting hotels in the Economy chain scale were in the “Peak” category with a weekly RevPAR higher than corresponding weeks in 2019. In comparison, only 8% of Upper Upscale hotels were at peak RevPAR with 53% in the “Depression” category. Upper Midscale, the largest branded chain scale, had 28% of its hotels in the “Peak” category this week. At the beginning of the year, 19% of Upper Midscale hotels were at “Peak” and a third were in “Depression.”
Overall U.S. ADR increased by a little less than 1% week on week with the Top 25 markets having slightly better gains than elsewhere. Overall, ADR was at 84% of the level achieved during the comparable week in 2019 and has been trending upward since early March.
As seen over the past two weeks, hotel performance will continue to meander until the start of the summer travel season. As a result, expect most metrics to remain flattish with only slight upward movement. However, recent trends in weekday demand are encouraging and could be a signal of returning business demand. Only time will tell if this is so.
To learn more about the data behind this article and what STR has to offer, visit https://str.com/.


Sign up to receive our stories in your inbox.
Data is changing the speed of business. Investors, Corporations, and Governments are buying new, differentiated data to gain visibility make better decisions. Don't fall behind. Let us help.


Sign up to receive our stories in your inbox.
Data is changing the speed of business. Investors, Corporations, and Governments are buying new, differentiated data to gain visibility make better decisions. Don't fall behind. Let us help.