Downward Trend in Delinquencies Halt
Loan Performance Insights Report Highlights: February 2021
In February 2021, 5.7% of home mortgages were in some stage of delinquency (30 days or more past due, including those in foreclosure)[1], a small increase from January 2021, and a 2.1-percentage point increase from February 2020 according to the latest CoreLogic Loan Performance Insights Report. The slight (0.1 percentage point) increase over January 2021 marked the first uptick in month-to-month national delinquency since August 2020.
Overall Delinquency Rates
The share of mortgages that were 30 to 59 days past due — considered early-stage delinquencies — was 1.5% in February 2021, down sharply from a post-pandemic high of 4.2% in April 2020, but up from 1.3% in January 2021. The share of mortgages 60 to 89 days past due was 0.5% in February 2021, down from 0.6% in February 2020 and down from 2.8% in May 2020. The increase in early-stage delinquencies was most likely seasonal and due to overspending during the year-end holiday season; during each of the last five years, the 30 to 59-day delinquency rate moved higher from January to February.
The serious delinquency rate — defined as 90 days or more past due, including loans in foreclosure — was 3.7% in February, more than three times that of a year earlier, but down from a recent high of 4.3% in August 2020. The CARES Act provides relief to mortgage holders and has worked to keep delinquencies from progressing to foreclosure, and therefore, the foreclosure inventory rate — the share of mortgages in some stage of the foreclosure process — remained low at 0.3% in February 2021, down from 0.4% from February 2020. The decrease in the serious delinquency rate from the August high and increases in home equity as prices continued to increase in 2021 lessen the likelihood of a foreclosure wave later in the year when homeowners emerge from forbearance.
Stage of Delinquency: Rate of Transition
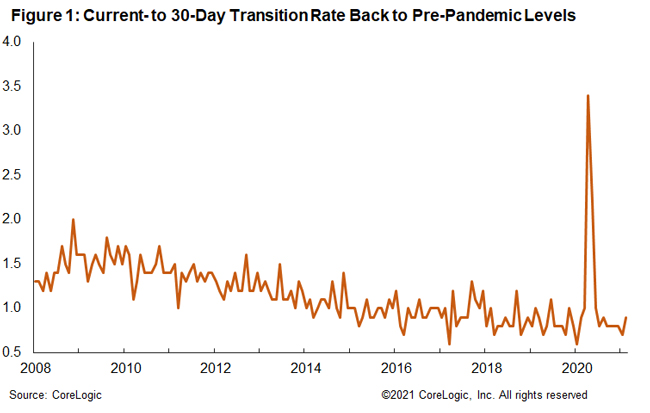
In addition to delinquency rates, CoreLogic tracks the rate at which mortgages transition from one stage of delinquency to the next, such as going from current to 30 days past due (Figure 1).

The share of mortgages that transitioned from current to 30 days past due was 0.9% in February 2021 — a decrease from the peak of 3.4% in April 2020. Low transition rates indicate that while the rate of mortgages in any stage of delinquency remained elevated, fewer borrowers slipped into delinquency than early in the recession.

State and Metro Level Delinquencies
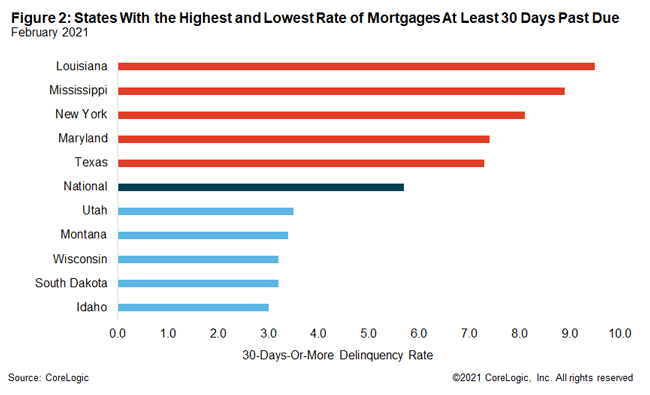
Figure 2 shows the states with the highest and lowest share of mortgages 30 days or more delinquent. In February 2021, that rate was highest in Louisiana at 9.5% and lowest in Idaho at 3%. All U.S. states posted annual gains in their overall delinquency rate in February 2021, and places with large job losses during the last year experienced large increases in delinquencies. Hawaii and Nevada, both of which rely heavily on tourism and the hospitality industry, had the largest 12-month spike in delinquency rates, both increasing 4 percentage points. These states also had large increases in unemployment rates from a year earlier, up 7.1 percentage points in Hawaii and 4.7 percentage points in Nevada compared with 2.7 percentage points on average for the U.S.

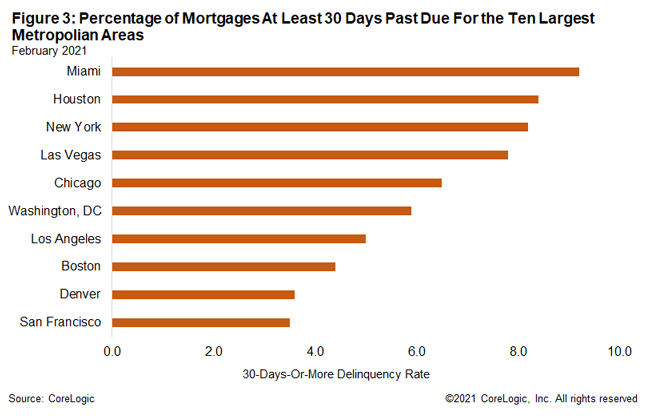
Figure 3 shows the 30-plus-day past-due rate for February 2021 for 10 large metropolitan areas.[2] Miami had the highest rate at 9.2% and San Francisco had the lowest rate at 3.5%. Miami’s rate increased 4.3 percentage points from a year earlier. Outside of the largest 10, all but two metros recorded an increase in the overall delinquency rate. Oil reliant Odessa, Texas, experienced the largest annual increase with 9.9 percentage points — the unemployment rate in Odessa increased to 11.8% in February, an 8.5 percentage point increase from the prior year.
Mortgage delinquencies have been slowing decreasing after peaking in mid-2020, and the rate of foreclosures remains at a 22-year low due to ongoing forbearance provisions. Improvements in the economy and job market this year will help borrowers remain current on their payments when forbearance is lifted later this year. For more housing trends and data, visit the CoreLogic Insights Blog: www.corelogic.com/insights.
[1] Data in this report is provided by TrueStandings Servicing. https://www.corelogic.com/products/truestandings-servicing.aspx. The CARES Act provided forbearance for borrowers with federally backed mortgage loans who were economically impacted by the pandemic. Borrowers in a forbearance program who have missed a mortgage payment are included in the CoreLogic delinquency statistics, even if the loan servicer has not reported the loan as delinquent to credit repositories.
[2] Metropolitan areas used in this report are the ten most populous Metropolitan Statistical Areas. The report uses Metropolitan Divisions where available.
To learn more about the data behind this article and what CoreLogic has to offer, visit https://www.corelogic.com/.


Sign up to receive our stories in your inbox.
Data is changing the speed of business. Investors, Corporations, and Governments are buying new, differentiated data to gain visibility make better decisions. Don't fall behind. Let us help.


Sign up to receive our stories in your inbox.
Data is changing the speed of business. Investors, Corporations, and Governments are buying new, differentiated data to gain visibility make better decisions. Don't fall behind. Let us help.


