The 2021 summer travel season has officially begun, and roughly half the US adult population is inoculated against the coronavirus. Is travel poised to recover from its near-death experience last year? We take a look at travel performance to date below. (See our prior analyses in this vaccinated-recovery series, including our general overview, our focus on dining, and on gyms).
Note that parts of this analysis calculate growth relative to two years prior – written throughout as “Yo2Y” – in order to benchmark current performance against “normal” consumer levels.
Key Takeaways
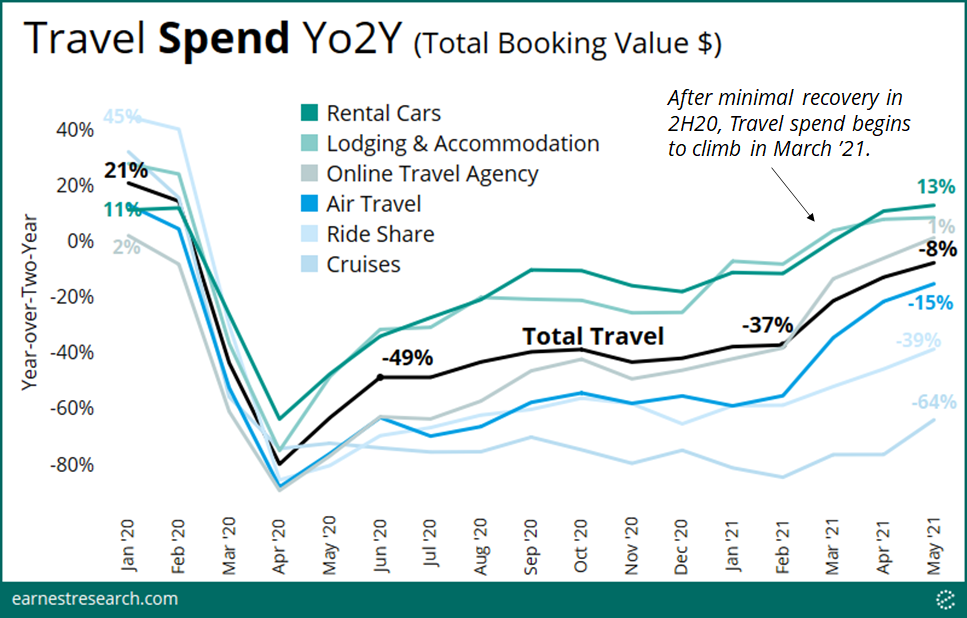
Total Travel booking spend was down 8% Yo2Y in May ‘21, materially down from pre-pandemic growth levels of ~15-20%, but importantly up from the ~40% declines in the back half of last year. Actual traveler traffic was not as strong, as inflated booking prices drove much of the spending recovery.
Recoveries manifested across Rental Cars, Lodging, OTAs, and Air Travel, while Ride Sharing and Cruises remained depressed. For Rental Cars and Lodging in particular, their recovery to ~10% Yo2Y growth in May was heavily driven by inflated booking sizes; their actual number of bookings were still down ~20%.
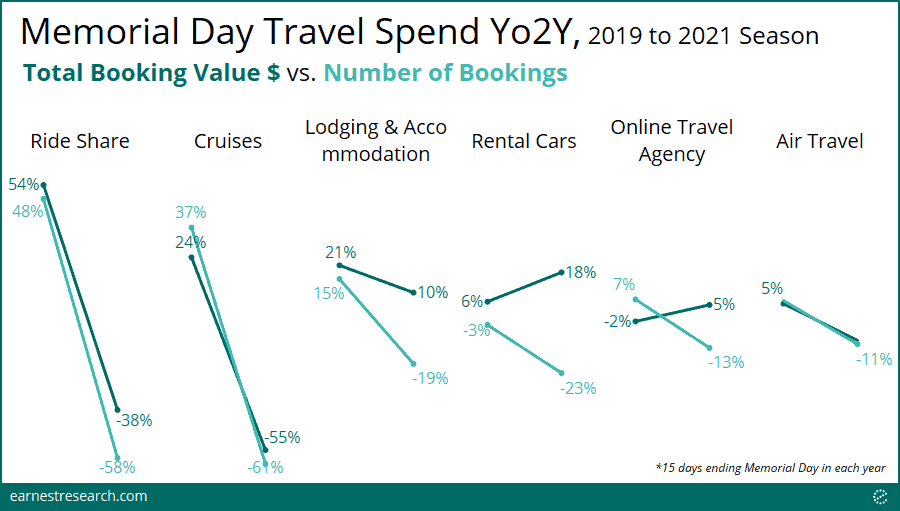
The number of bookings this Memorial Day season was down ~40% vs. 2019. Ride Sharing and Cruises absorbed the most acute Yo2Y decelerations this Memorial Day; Air Travel fell the least.
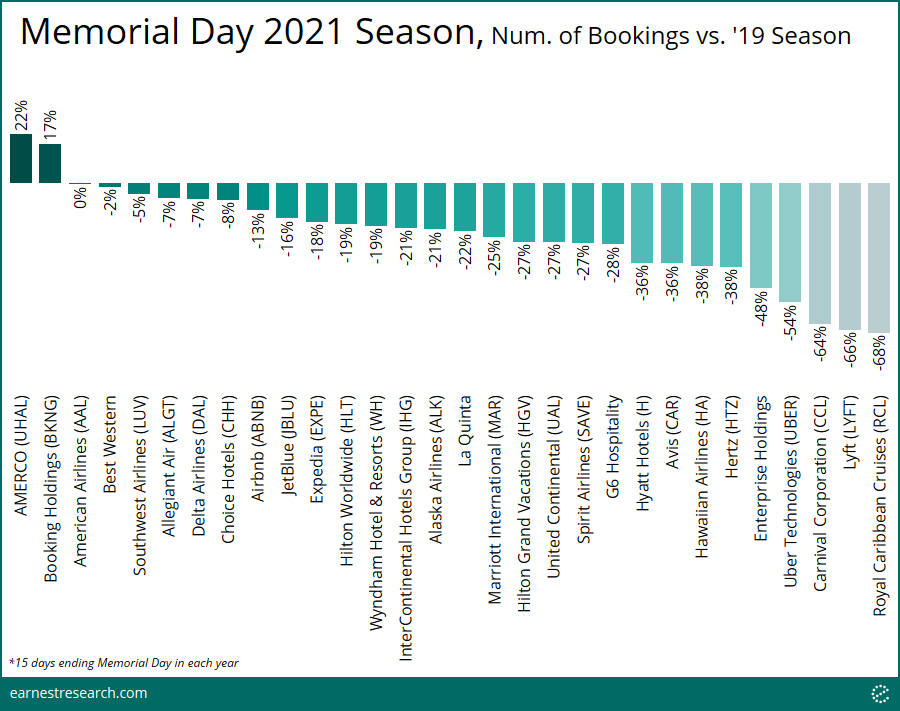
U-Haul (+22% Yo2Y) and Priceline (+17%) saw rare positive bookings growth this Memorial Day period. Within Air Travel, American Airlines (0%) fared best, while Hawaiian Air (-38%) fared worst. Lodging was led by Best Western (-2%), while Hyatt (-36%) dragged last. Uber, Lyft, Carnival, and Royal Caribbean fell ~50-70%.
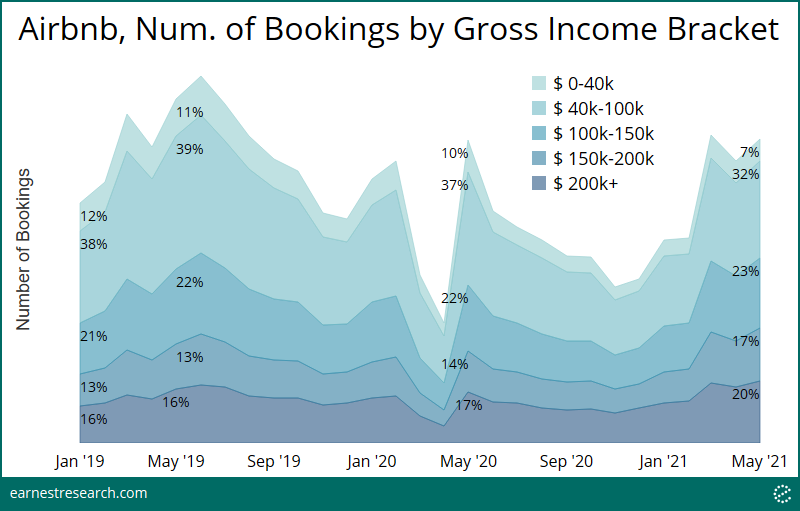
Airbnb is becoming increasingly reliant on higher-income brackets. The $200k+ bracket now accounts for 20% of bookings, up 4 points from May ’19, and the $150k-$200k bracket similarly increased 5 points, to now 17% of bookings.
Travel Down, but on the Runway
Total Travel booking spend was down 8% Yo2Y in May ‘21, still materially down from pre-pandemic growth levels of ~15-20%, but importantly up from the ~40% declines in the back half of last year. The recovery began to accelerate in March, likely aided by the stimulus package, and manifested across several sectors, including Rental Cars, Lodging, OTAs, and Air Travel. Recoveries within Ride Sharing and Cruises remain depressed.
Inflated Tickets
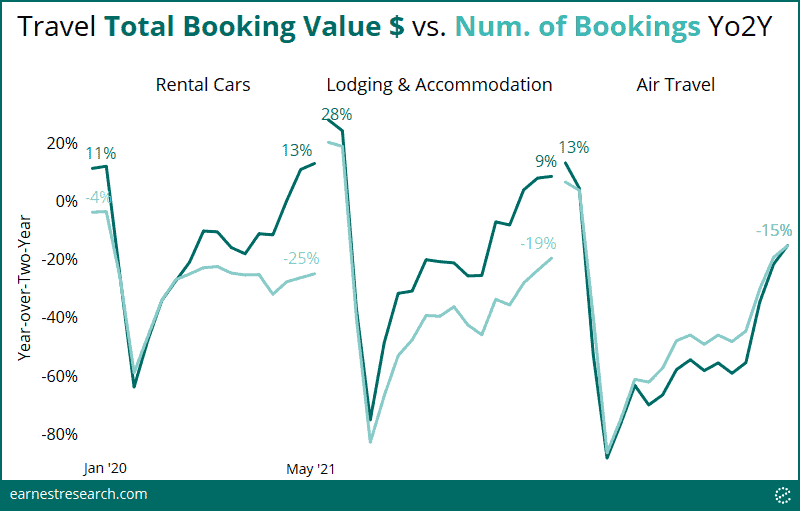
As we wrote about in a recent Data Bite, the average booking size continues to be inflated for Rental Cars with the number of bookings trailing, due to reduced fleets causing car shortages. It’s curious to note a similar pattern for Lodging (without the same capacity constraints), which is likely driven by category leader Airbnb’s extended-stay booking behavior this past year, which carry higher price points. The net effect is that the number of bookings for both categories is still well below pre-pandemic levels, declining ~20-25% in May, even as the total dollar value of bookings reached ~10% growth in May.
Traveler Traffic Still Down
While booking behavior is an important signal of a consumer’s willingness to travel in a vaccinated world, we looked at our foot traffic data to measure actual travel trends to date, rather than just the intention to do so.
Performance mostly mirrors the number of bookings behavior above. Total traveler traffic declined 23% Yo2Y in May, well below the low single digit growth pre-pandemic, but importantly up from the 40% declines during most of last year. Recovery began to accelerate in March, and manifested more in Rental Cars, Lodging, and Air Travel/Airports. Interestingly, visitations to Cruise Ship Ports are still down about 70%, showing no signs of recovery from their pandemic-driven drop in April of last year.
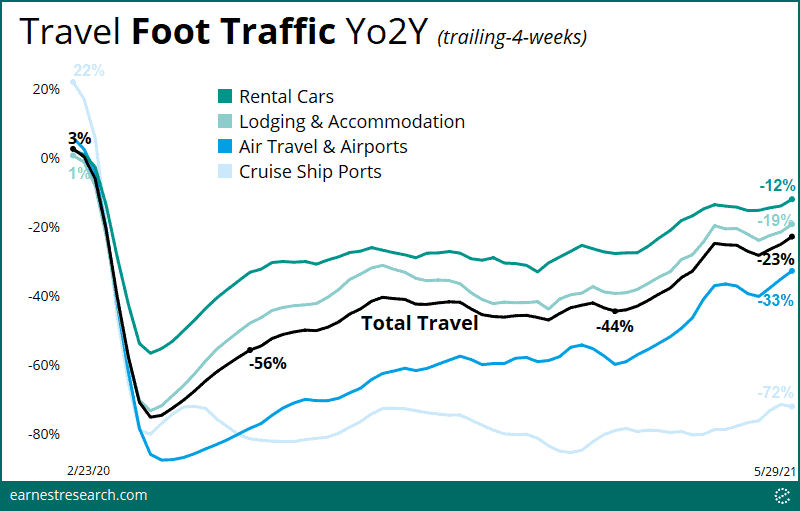
*Air Travel refers to traffic at the terminal gate; Airports refers to traffic anywhere at the airport. Earnest covers traffic at 30 of the major national US airports. The following airports are excluded from this analysis due to lack of history two years prior: ATL, BWI, DEN, DFW, DTW, IAD, LAS, LGA, MSP, PDX, SAN.
Less Busy Memorial Day
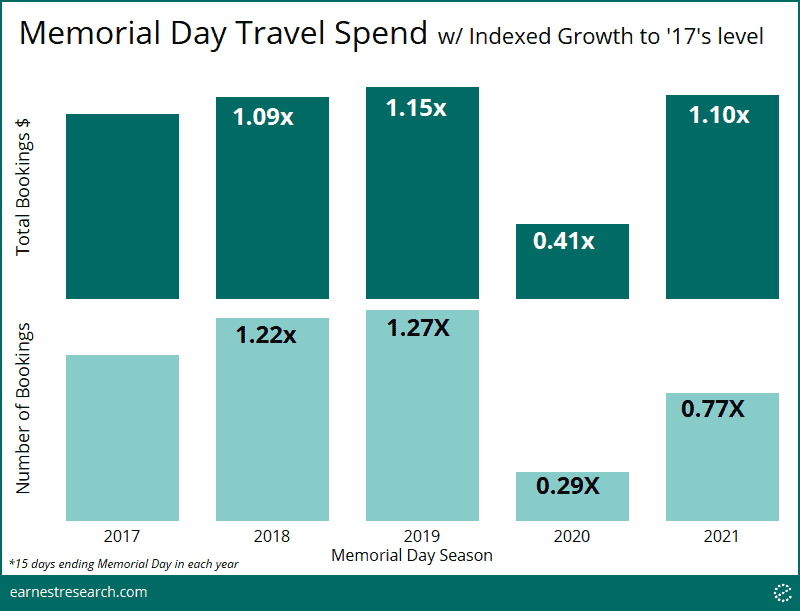
With a reputation as one of busiest traveling weekends in a normal year, we looked at how the 2021 Memorial Day weekend fared in this half-vaccinated environment. Focusing on the fifteen days leading up to Memorial Day in each year (in order to capture most booking spend), from 2017 to 2021, we calculated each season’s respective growth relative to the 2017 season.
The 2021 season was not quite ‘normal’ just yet. While total dollars booked were roughly on par with pre-pandemic levels, at 1.1x 2017 levels, and very much above 2020’s 0.4x level, this is mostly a product of an inflated average booking size as noted above. The number of bookings throughout the Memorial Day season, however, was still materially down, at 0.77x 2017 levels, relative to the ~1.25x levels pre-pandemic. (Indexing to the more recent 2019 Memorial Day, this year’s season was 0.61x the size; or in other words, down 39% Yo2Y).
In terms of the number of bookings, Ride Sharing and Cruises absorbed the most acute Yo2Y decelerations this Memorial Day, relative to the 2019 season, followed by Lodging, Rental Cars, OTAs, then Air Travel.
U-Haul and Priceline Grow; Everyone Else Shrinks
As American’s migration patterns continue to evolve (see our Urban Exodus analysis) it’s not surprising to see U-Haul lead the way this Memorial Day period, the number of bookings up 22% vs. ‘19. Booking Holdings (Priceline) also saw rare positive growth up 17%.
Among the airlines, American Airlines performed best, roughly flat vs. 2019, while Spirit was -27%, trailing Hawaiian’s -38%. Lodging was led by Best Western -2%, while Hyatt at the other end dragged -36%.
Other competitors tracked more closely. Avis and Hertz saw -36% and -38%, respectively. Uber (just Ride Sharing, not Eats) fell to -54%, and competitor Lyft fell to -66%. Carnival and Royal Caribbean fell to a similar -64% and -68%, respectively.
Airbnb’s Higher-Income Guest
With markedly fewer flights and hotel bookings, and viewed as more of a quarantine-friendly option, Americans have increasingly turned to Airbnb for vacation rentals, a shift that’s most evident in the higher income brackets.
The $200k+ bracket now accounts for 20% of bookings, up 4 points from May’19. Similarly, the $150k-$200k cohort increased 5 points, to now 17%. Conversely, the largest $40k-$100k group shrank to 32%, a 7 point drop vs. May’19.
To learn more about the data behind this article and what Earnest Research has to offer, visit https://www.earnestresearch.com/.


Sign up to receive our stories in your inbox.
Data is changing the speed of business. Investors, Corporations, and Governments are buying new, differentiated data to gain visibility make better decisions. Don't fall behind. Let us help.


Sign up to receive our stories in your inbox.
Data is changing the speed of business. Investors, Corporations, and Governments are buying new, differentiated data to gain visibility make better decisions. Don't fall behind. Let us help.


