
2021 for the multifamily industry has been partially characterized by a very active new construction pipeline and a robust rebound in apartment demand. In ALN newsletters and blog posts these developments have been touched upon from various angles including price class, market size, and evaluation of specific markets. One area that has yet to be addressed is how all of the action of 2021 has played out across the urban-suburban-outlying area divide.
Methodological Notes
As always, the included statistics will refer only to conventional properties of at least 50 units. ALN comprises markets of complete metropolitan statistical areas (MSAs) as defined by the Census Bureau. A market may include only one MSA, or multiple. Within an MSA, areas are defined as Urban, Suburban, or Outlying based primarily on population density per square mile. The time period included will be January through May of 2021.
Net Absorption and Average Occupancy
Urban areas, after especially struggling through 2020, have already begun a strong comeback in many markets. Almost two-thirds of national net absorption through May came in urban areas. With more than 135,000 net units gained, net absorption was not only vastly beyond the approximately 34,000 units from the same portion of COVID-affected 2020, but also considerably more than the 84,000 net units from January through May of 2019. The net result was a 1% average occupancy gain to just below 92% – exactly where the average stood at the end of May 2019.
Suburban areas have also over-performed compared to absorption totals from the last couple of years, but not to the same extent as the urban regions. Net absorption of almost 37,000 units through May was more than triple the demand from the same period in 2020. This was ‘only’ about 25% higher than the 2019 value compared to the almost 40% increase from 2019 in urban areas. A 0.5% average occupancy gain brought the average for suburban areas to just above 93% – also almost exactly the level from May 2019.
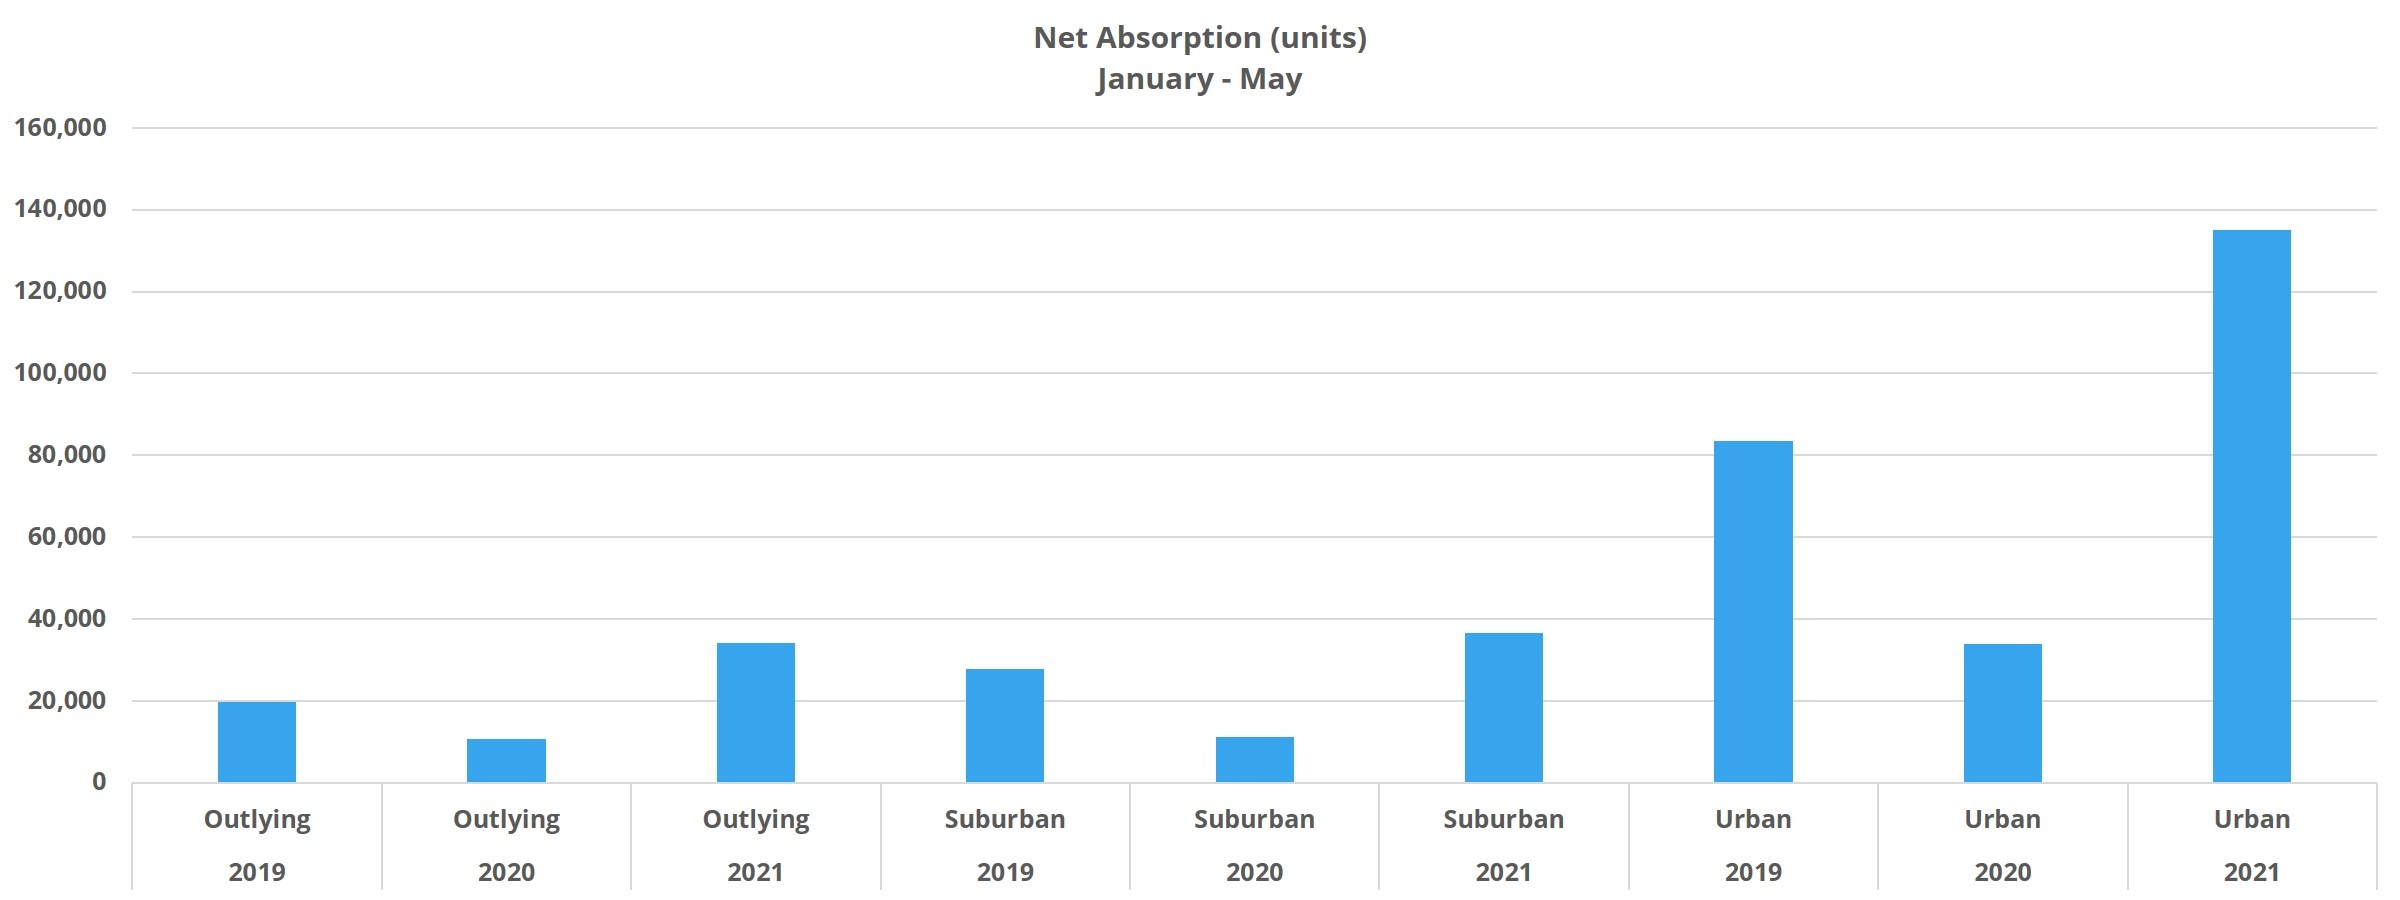
Net absorption in outlying areas was almost equal to that of suburban areas despite outlying regions having about 500,000 less units overall. 34,000 net units were absorbed through May, up from fewer than 11,000 units through May of 2020 and around 20,000 units through the same portion of 2019.
On a percentage basis, these outlying areas surpassed 2019 demand by a wider margin than the suburban regions, but not quite to the extent of the urban regions. The end result was an average occupancy just above 94% after a 0.8% increase during the first five months of the year. Interestingly, after adjusting demand to reflect absorption as a percent of available unoccupied units, it was the outlying areas that absorbed the largest share of vacant units at 35%. For both urban and suburban areas, that share was 25%.
Average Effective Rent and Lease Concessions
Average effective rent, or collected rent, in urban areas rose by 3.6% through May to close the month at $1,526 monthly per unit. This rate of growth compared favorably not only to the 0.5% gain from 2020 but also to the 2.2% gain from 2019. A boost to rent growth was the decline in both lease concession availability and average concession value. Discount availability decreased by 17% down to about 21% of conventional properties offering a concession in urban areas. The average discount value fell by a more muted 4% to 4.5 weeks off an annual lease. Even after the decline so far this year, this value was more than a full week above that from May 2019.
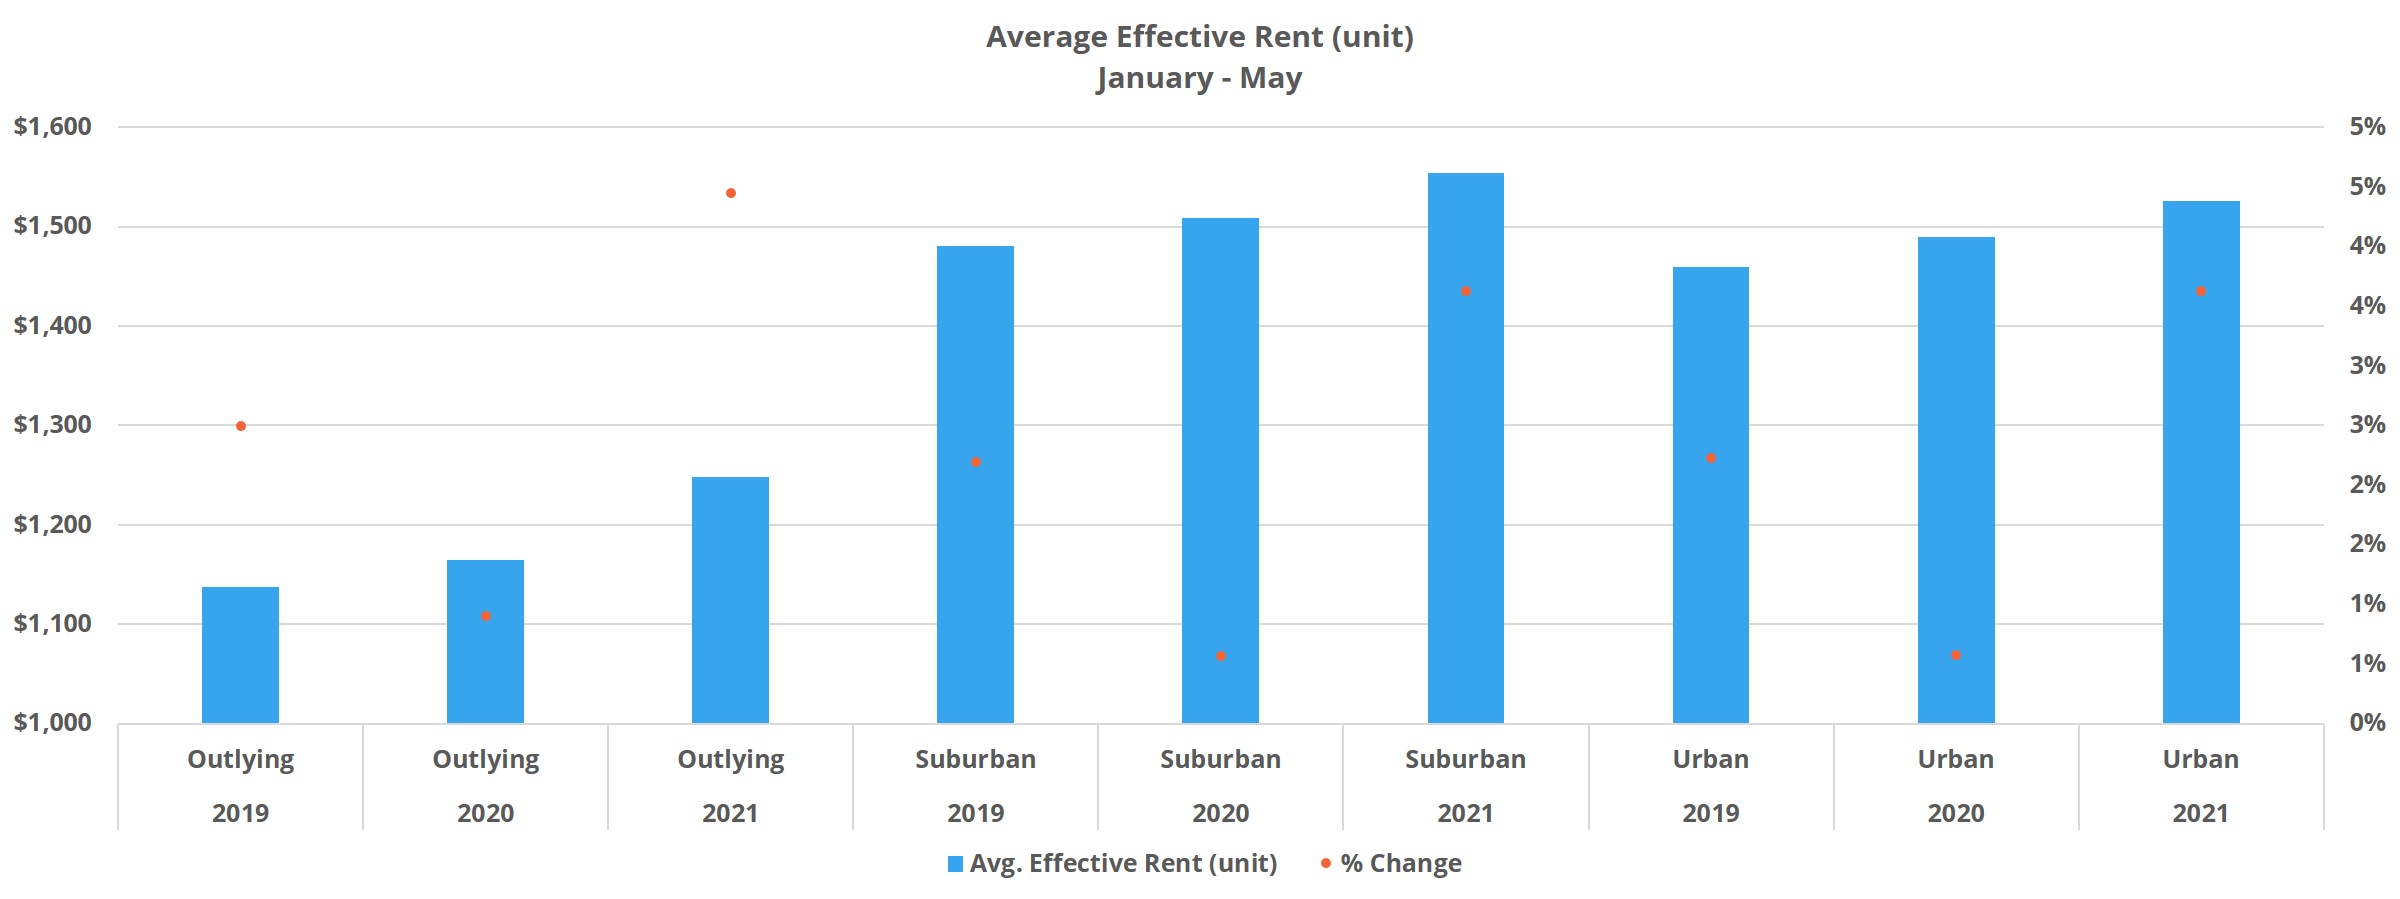
Average effective rent growth was also 3.6% for suburban areas through May. This brought the average unit to $1,554 per month. It may seem surprising that the average suburban rent would have been higher than the average urban rent, but in addition to the average urban unit being smaller, average rent for the Class C subset of properties in the suburbs was considerably higher than in the urban areas.
The similarities did not stop at average effective rent performance. Average effective rent growth for suburban properties through May of 2020 was also around 0.5% and the mark hit in 2019 was also just above 2%. Suburban properties managed a 21% decrease in discount availability down to about 15% of conventional properties offering a lease concession. The average value closed May at four weeks off an annual lease, still well above the 2.75 weeks off from May of 2019.
Rent growth has been even stronger in outlying areas. A 4.5% increase in average effective rent brought the average unit to $1,248 per month. Once again, this gain easily outpaced the last two years, and nearly double the 2.5% gain through May of 2019. A 25% decrease in lease concession availability resulted in less than 10% of properties in these areas offering a discount at the end of May. A 5% decrease in the average discount value brought the average package to 2.9 weeks off an annual lease – not far from the 2.4 weeks off from May of 2019.
Largest Markets
One development from the wild year last year was that the largest markets in the country as a group were the worst hit. In fact, ALN Tier One markets, the 33 largest multifamily markets in the country, were the only group of markets out of four tiers to be in negative territory for average occupancy and average effective rent. No other tier was negative for either metric.
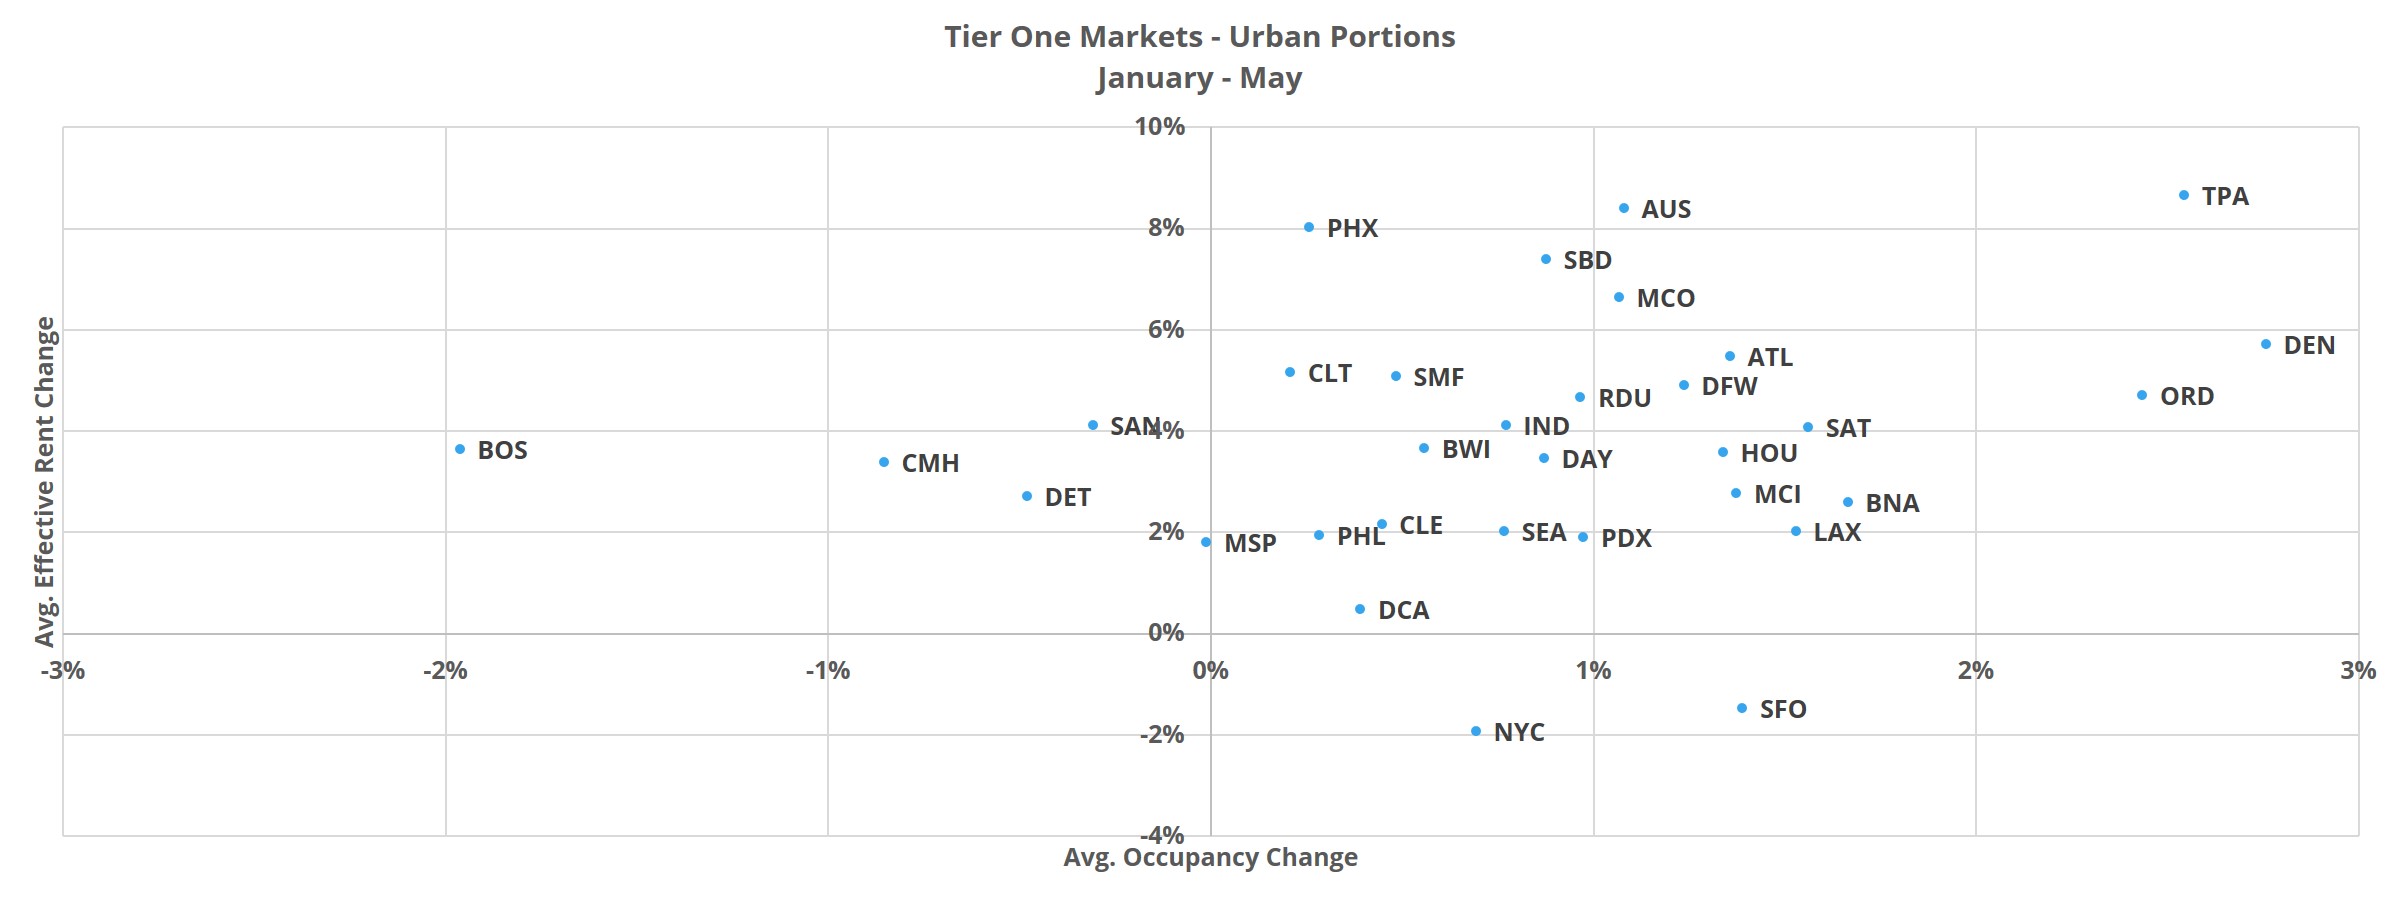
With this in mind, a couple of the largest markets stood out so far this year. The urban regions of Dallas – Fort Worth, Houston, and Los Angeles – Orange County each absorbed at least 11,000 units from January through May. These were the strongest results in any market for any of the three geographic categories. In Tampa, Phoenix, and Austin average effective rent growth in the urban areas has surpassed 8% so far this year. Austin has been in a class of its own though, with all three geographic categories closing May with at least a 7.9% gain.
On the other side of the coin, only two areas were in negative territory in terms of effective rent growth. The urban portion of San Francisco ended May down 1.5% and the urban portion of New York was down 1.9% from the start of 2021. On a net rent basis, accounting both for average occupancy and average effective rent, only urban New York closed May in negative territory with a 1.2% loss.
Takeaways
After a rough 2020, it is encouraging to see vigorous apartment demand lifting all boats across the urban-suburban-outlying area spectrum. Rather than a recovery focused in just one category, absorption and rent growth in particular have been strong across the board. Urban areas, after an especially rocky 2020, have roared back, though with some exceptions, and perhaps even a bit earlier than expected.
It should also be mentioned that the outlying areas continue to lead the way after better weathering the storm last year. With the Moody Analytics Back-to-Normal Index reflecting continued progress in regaining economic activity, even markets that have lagged in their multifamily bounce back should benefit from the positive momentum in the coming months.
To learn more about the data behind this article and what ALN Apartment Data has to offer, visit https://alndata.com.


Sign up to receive our stories in your inbox.
Data is changing the speed of business. Investors, Corporations, and Governments are buying new, differentiated data to gain visibility make better decisions. Don't fall behind. Let us help.


Sign up to receive our stories in your inbox.
Data is changing the speed of business. Investors, Corporations, and Governments are buying new, differentiated data to gain visibility make better decisions. Don't fall behind. Let us help.