Prime Day took 88% of market share among competing sales from Walmart, Target, Best Buy, and Kohl’s.
Key Takeaways
• In May 2021, Amazon’s pre-Prime Day online spend was nearly 600% higher than their next nearest competitor, Walmart.
• Over all 48 hours of Amazon Prime Day, total spend was up 32% YoY.
• Day 1 (first 24 hours) of Amazon Prime Day, total spend was up 28% YoY.
• Day 2 (second 24 hours) of Amazon Prime Day, total spend was up 38% YoY.
Another Amazon Prime Day has come and gone - and we’ve been digging into how the sales performed for the fourth consecutive year. This year, like last, Amazon kept the official Prime Day dates under wraps until a few weeks before the event, likely to make it more difficult for their competitors from planning their own sales on the same dates. As with years prior, Amazon Prime Day led to incredible sales for the e-commerce giant, with over $5.6 billion in sales within the first 24 hours.
How did Pre-Prime Day 2021 sales perform at Amazon vs. competitors in the last year?
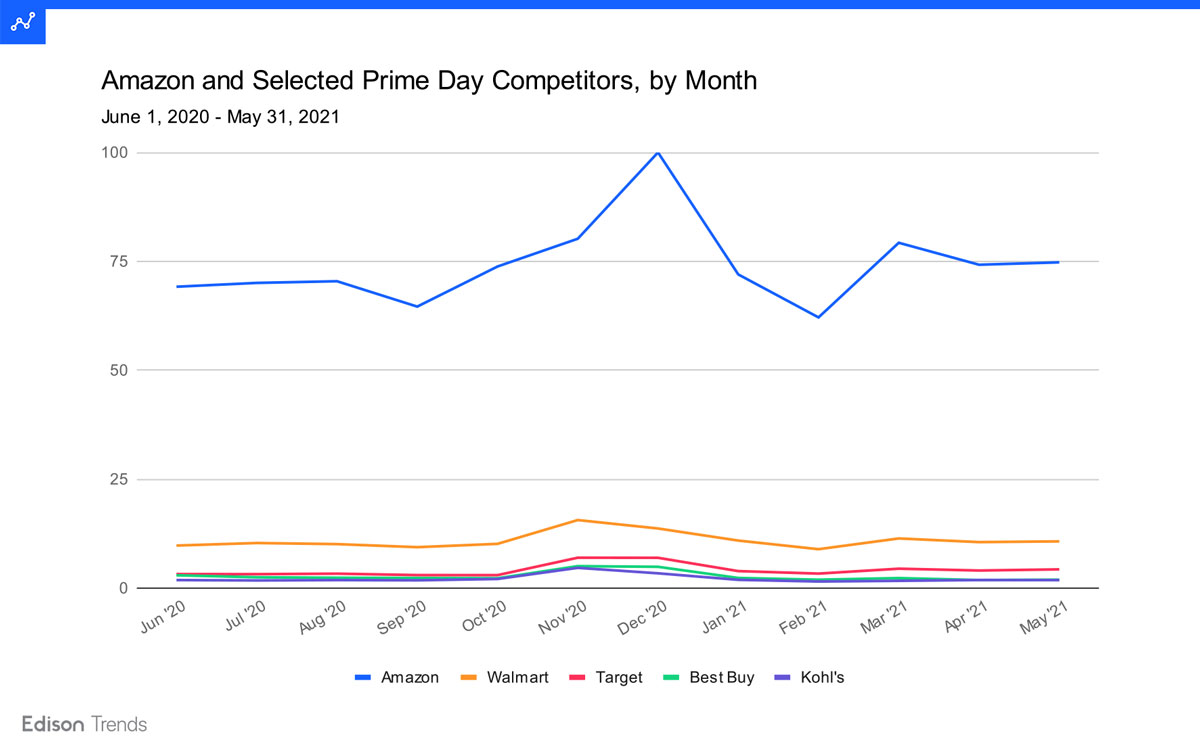
Figure 1: Chart shows estimated online monthly spend at Amazon, Walmart, Target, Best Buy, and Kohl’s from June 1, 2020 - May 31, 2021, according to Edison Trends. Note: The highest spend per month has been set to 100, and all other values scaled accordingly. This analysis is based on over 19 million transactions.
Before Prime Day 2021, in the last year Amazon’s biggest month for customer spending by far was December 2020, while its competitors saw peak sales in November that year. Many of the brands analyzed here saw a dip in February 2021 and climbed again into March. As of May 2021, Amazon’s online spend was nearly 600% higher than that of its next nearest competitor, Walmart. (Note that Prime Day 2020 occurred in the month of October and so is part of the analysis period.)
Compared to last May 2020, Amazon saw online spend up 5% in May 2021. Walmart and Target remained about the same. Kohl’s fell 23% YoY, while Best Buy dropped 50%. Online sales at Walmart, Target, Best Buy and Kohl’s had all reached unusual heights in April and May 2020, once social distancing began; Walmart and Target have managed to hang onto those gains, while Kohl’s and Best Buy have slipped.
How did the first 7 hours of Amazon Prime Day 2021 sales compare to previous years?
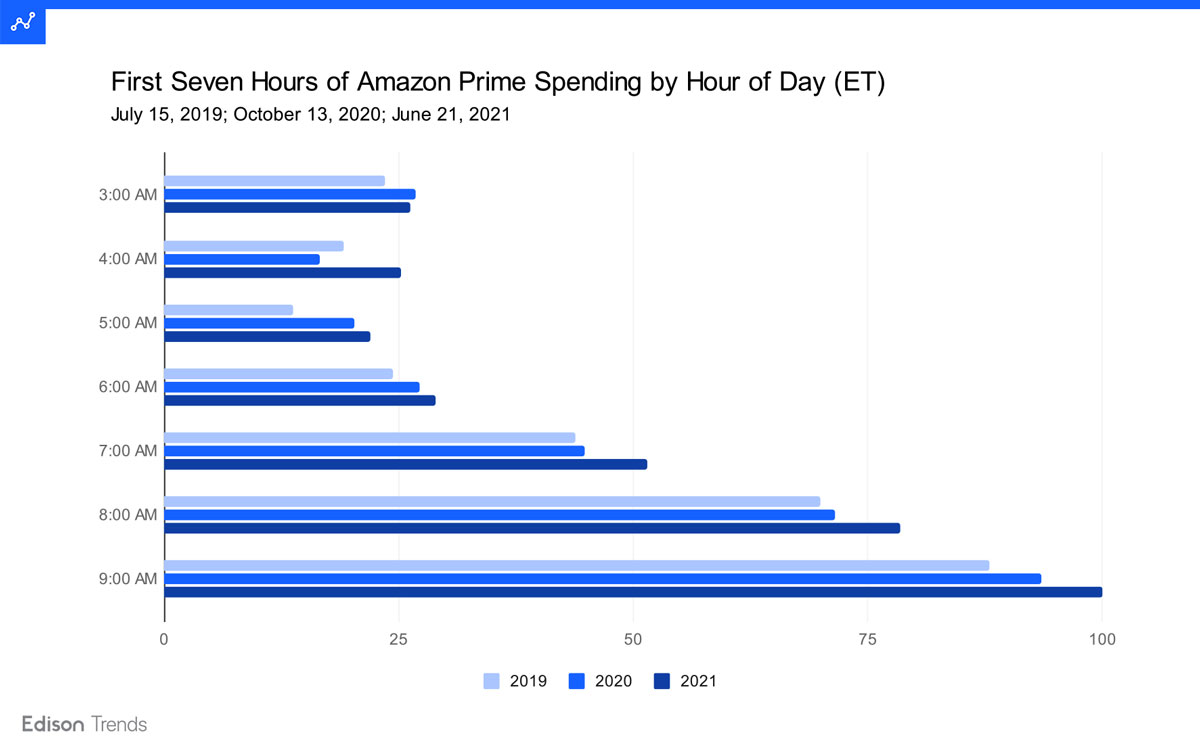
Figure 2: Chart shows estimated spend during the first seven hours of Amazon Prime Day by hour, comparing 2019 vs. 2020 vs. 2021, according to Edison Trends. Note: Data have been scaled so that the highest hourly spend is set to 100. This analysis is based on over 30,000 transactions from Amazon.com. The time periods represented are: July 15, 2019, 3am through 10am ET; October 13, 2020, 3am through 10am ET; and June 21, 2021, 3am through 10am ET.
While the first hour of 2021’s Prime Day sale didn’t bring in quite as much customer spending as the first hour of 2020’s sale did, numbers soon picked up, with the 4am ET hour bringing in 52% more than 2020 had seen in the same hour. This year continued to surpass 2020, with the 9am ET hour standing at 7% over what that hour had brought in a year ago, and 14% more than the 9am hour had brought in in 2019.
Overall, Amazon Prime Day saw higher customer spending in its first seven hours than occurred in the first seven hours of 2020’s Prime Day. Spending for 2021 was 11% higher than in 2020, and 18% higher than in 2019.
How did all 48 hours of Amazon Prime Day 2021 sales compare to previous years?
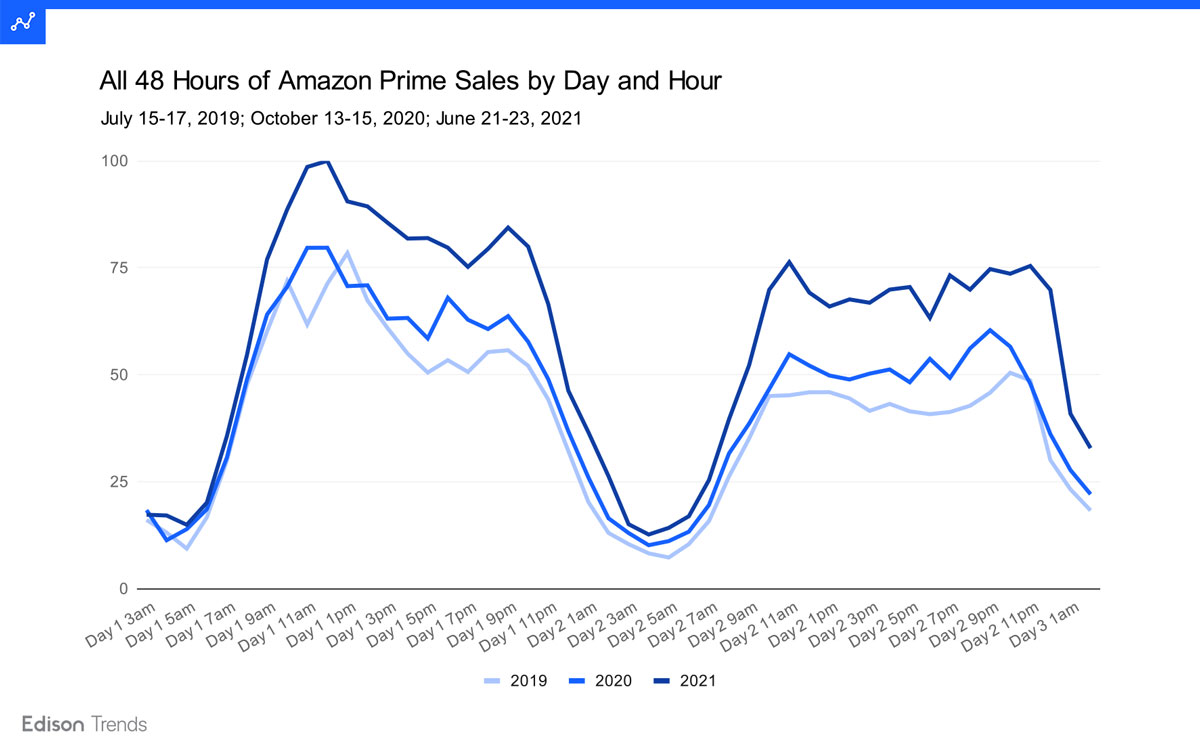
Figure 3a: Chart shows estimated total spend by day and hour, during all 48 hours of Amazon Prime Day, comparing 2019 vs. 2020 vs. 2021, according to Edison Trends. This analysis is based on over 400,000 transactions. Note: Data have been scaled so that the highest hourly spend is set to 100. The time periods represented are: July 15, 2019 at 3am ET through July 17, 2019 at 3am ET; October 13, 2020 at 3am ET through October 15, 2020 at 3am ET; and June 21, 2021 at 3am ET through June 23, 2021 at 3am ET.
Prime Day 2021 has eclipsed Prime Day 2020 in every hour but the very first. The top hour for 2021 was June 21st at noon ET; other peaks include June 21st at 9pm and June 22nd at both 11am and 11pm ET. The biggest year-over-year gain occurred in the 46th hour of the sale — at midnight on the 23rd—when 2021 spending was 93% beyond 2020 spending in the same hour.
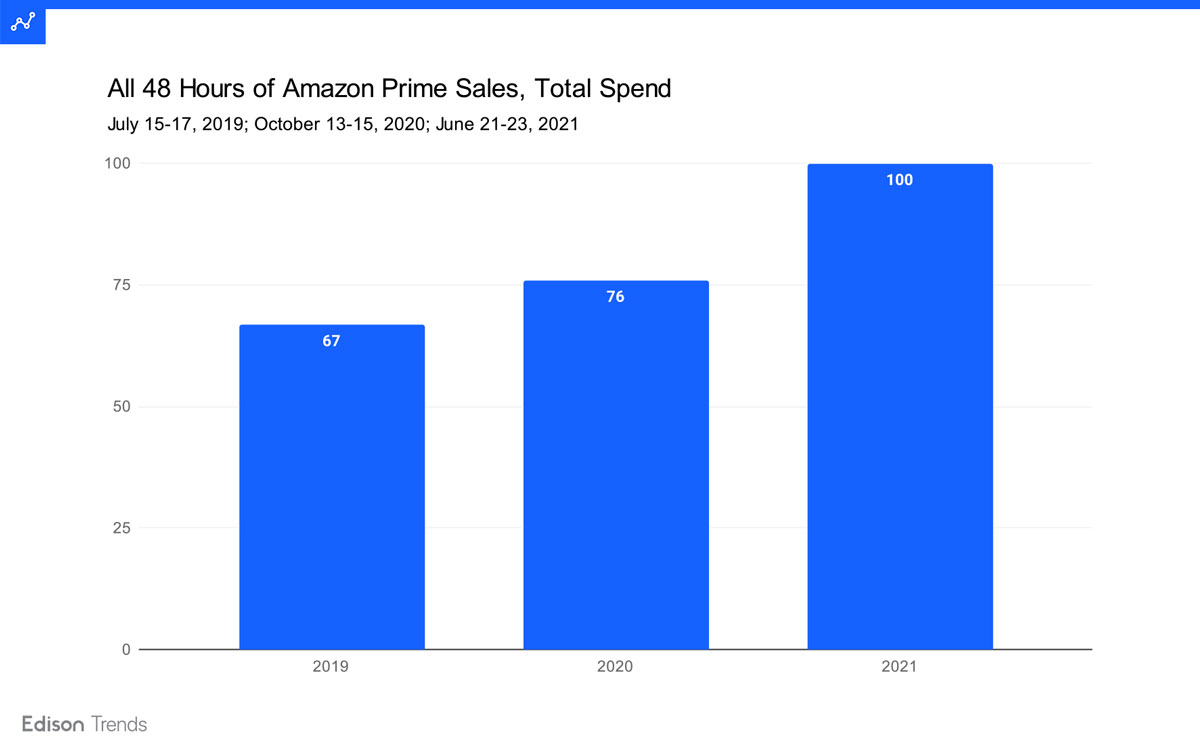
Figure 3b: Chart shows estimated total spend, during all 48 hours of Amazon Prime Day, comparing 2019 vs. 2020 vs. 2021, according to Edison Trends. This analysis is based on over 400,000 transactions. Note: Data have been scaled so that the highest hourly spend is set to 100. The time periods represented are: July 15, 2019 at 3am ET through July 17, 2019 at 3am ET; October 13, 2020 at 3am ET through October 15, 2020 at 3am ET; and June 21, 2021 at 3am ET through June 23, 2021 at 3am ET.
Total customer spending during all 48 hours of Prime Day 2021 definitively outdid 2020 numbers. Total spending this year was up 32% over Prime Day 2020, and 50% over 2019.
How much market share did competitor sales earn during Amazon Prime Day in 2021 compared to 2020?
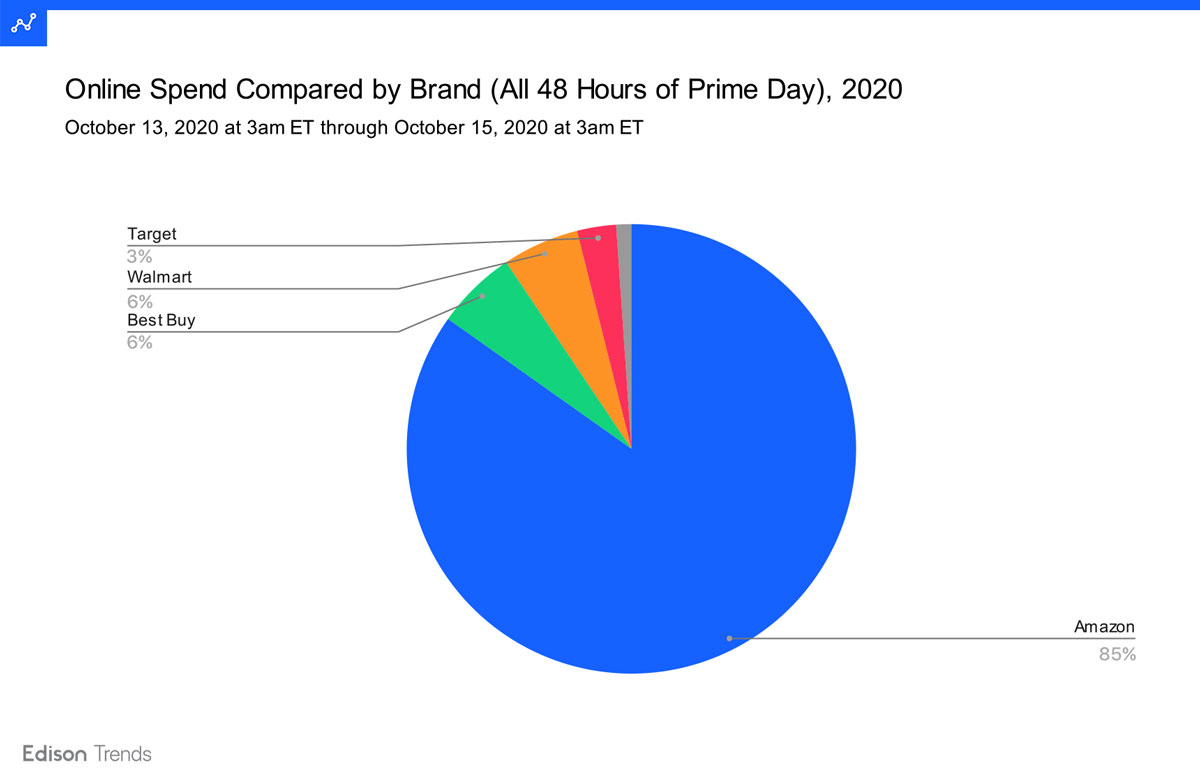
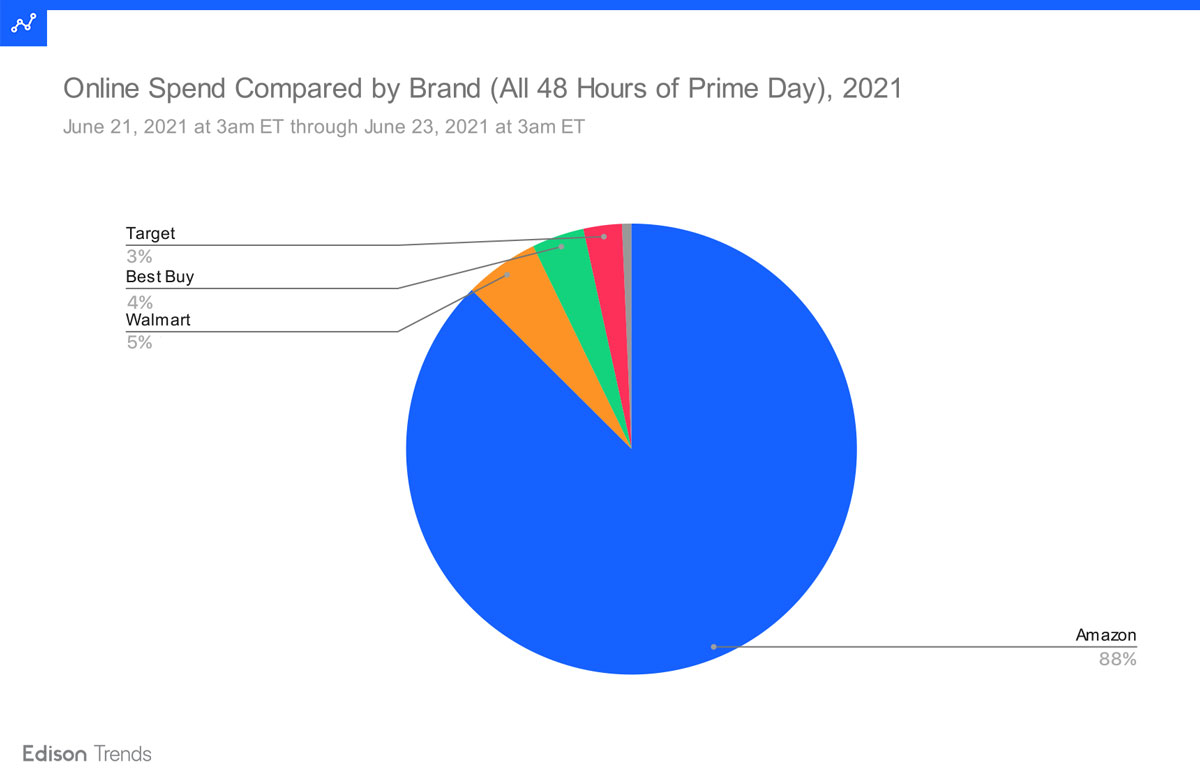
Figure 4a & 4b: Charts show estimated market share of spend, during all 48 hours of Amazon Prime Day, comparing 2021 vs. 2020, according to Edison Trends. Brands compared include Amazon, Walmart, Best Buy, Target, and Kohl’s. This analysis is based on over 400,000 transactions. Note: due to rounding, numbers may not add to 100%.
Many retailers held their own sales during Prime Day 2021, such as Walmart’s Deals for Days and Target’s Deal Days. However, Amazon raked in the majority of online customer spending during the 48 hours of Prime Day, garnering 88% of what customers spent among these five merchants from 3am ET on June 21st to 3am on the 23rd. Walmart came next at 5%, followed by Best Buy at 4% Target at 3%, and Kohl’s at 1%. This is similar to 2020, when Amazon took 85% of spend in the first 24 hours, followed by Walmart and Best Buy at 6% each, Target at 3%, and Kohl’s at 1%.
To learn more about the data behind this article and what Edison Trends has to offer, visit https://trends.edison.tech/.


Sign up to receive our stories in your inbox.
Data is changing the speed of business. Investors, Corporations, and Governments are buying new, differentiated data to gain visibility make better decisions. Don't fall behind. Let us help.


Sign up to receive our stories in your inbox.
Data is changing the speed of business. Investors, Corporations, and Governments are buying new, differentiated data to gain visibility make better decisions. Don't fall behind. Let us help.


