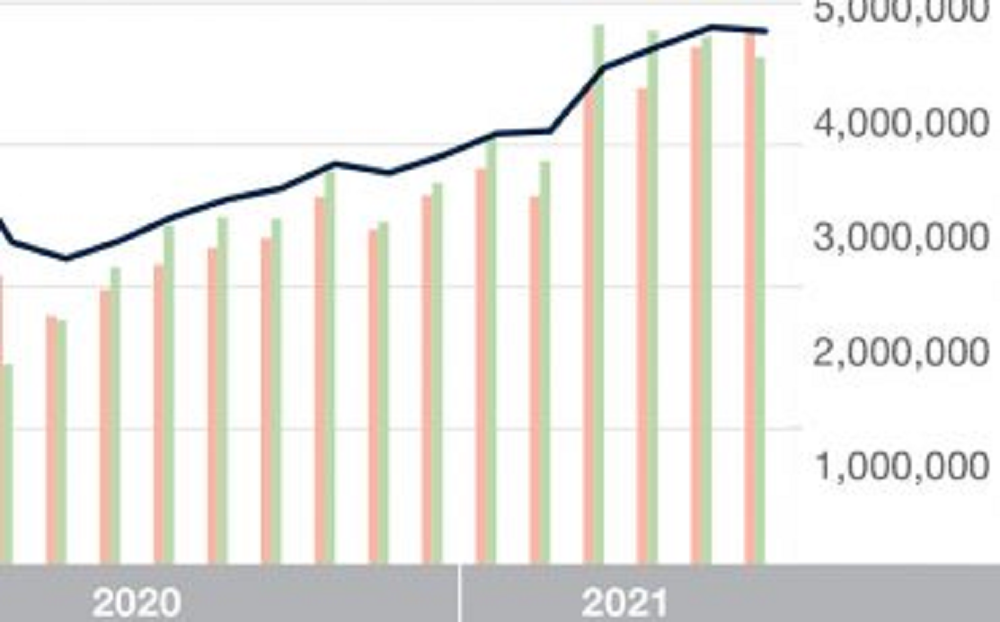
Following the normal pre-4th of July slump, U.S. industry occupancy rebounded to 67.2% for the week ending 10 July 2021. While this was good news, the gain was much less than expected as weekly demand improved 3% to 26 million. In the same week of 2019, demand increased 13% week over week, and occupancy hit 74%. We believe this illustrates the continued shortfall in business and group demand that in normal times would have supplemented seasonal leisure demand. Daily occupancy peaked again on Saturday at 80%, which was the fourth time this year that Saturday’s occupancy was above 80%. Sunday, 4 July occupancy (66%) was solid but not as strong as on Memorial Day Sunday (68%). Despite the higher Sunday occupancy, weekday occupancy was virtually unchanged from the previous week (+0.2 points) and 2.6 points lower from its high three weeks ago. On a total-room-inventory basis (TRI), which accounts for temporarily closed hotels, weekly occupancy was 64.7%.
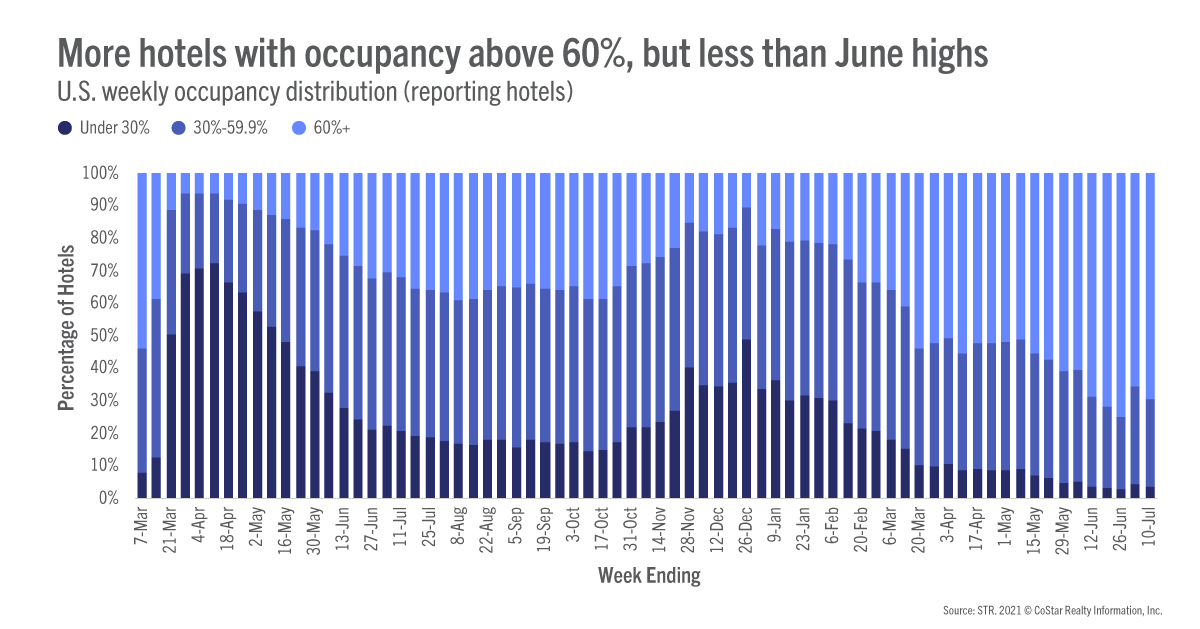
Weekly demand indexed to 2019 came down to 92 (meaning this week’s demand was 92% of what it was in 2019) from the previous week’s 101, which was driven in part by the favorable 4th of July calendar shift in comparison with 2019. On a market-level, demand indexed to 2019 ranged from 59 in New York to 121 in Sarasota, FL. Six of the 10 markets with the highest demand indices were in Florida with the remainder made up of markets that are leisure oriented. Market TRI occupancy ranged from 93% in Gatlinburg/Pigeon Forge, TN to 49% in San Francisco, which saw a slight increase from the previous week. A deeper look revealed that six markets had an occupancy above 80% in the week versus 13 markets three weeks ago. The good news is that most markets had weekly occupancy between 60% and 80%. On a hotel-level, 70% of hotels reported occupancy above 60%, up from 66% a week ago. Over the past two weeks, 13% of hotels (roughly 5,000) reported occupancy above 90%, however, three weeks ago, nearly 18% (roughly 7,000 hotels) were at that level. It was also encouraging to see that occupancy for large hotels (300 rooms+) increased to 58%, nearly the same level as three weeks ago.
While overall industry occupancy and demand have slowed as compared with three weeks ago, ADR continued to strengthen to an all-time high (almost $140) that was 5% above the 2019 comparable. More than 71% of markets reported higher weekly ADR versus the comparable week in 2019. However, a week ago, that figure was at 85%. Weekday ADR was the highest since the start of the pandemic, while weekend ADR fell back down from its high last week and was the second highest ever. Top 25 ADR continued to grow but remained below the levels seen in 2019 and early 2020. Non-Top 25 ADR was at a record level.
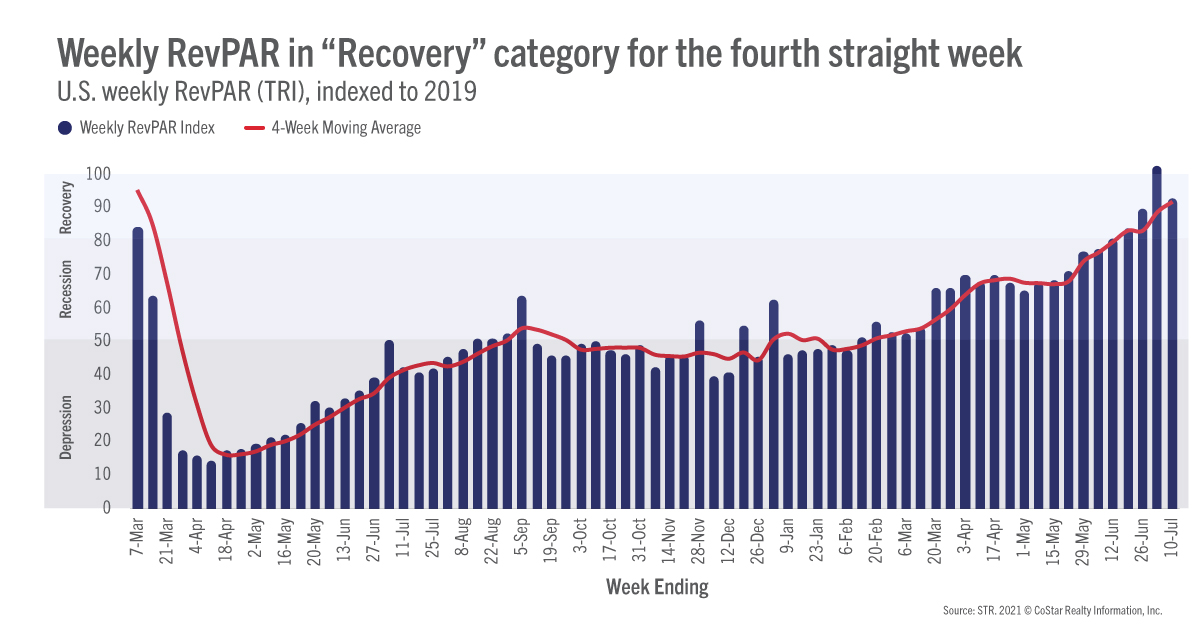
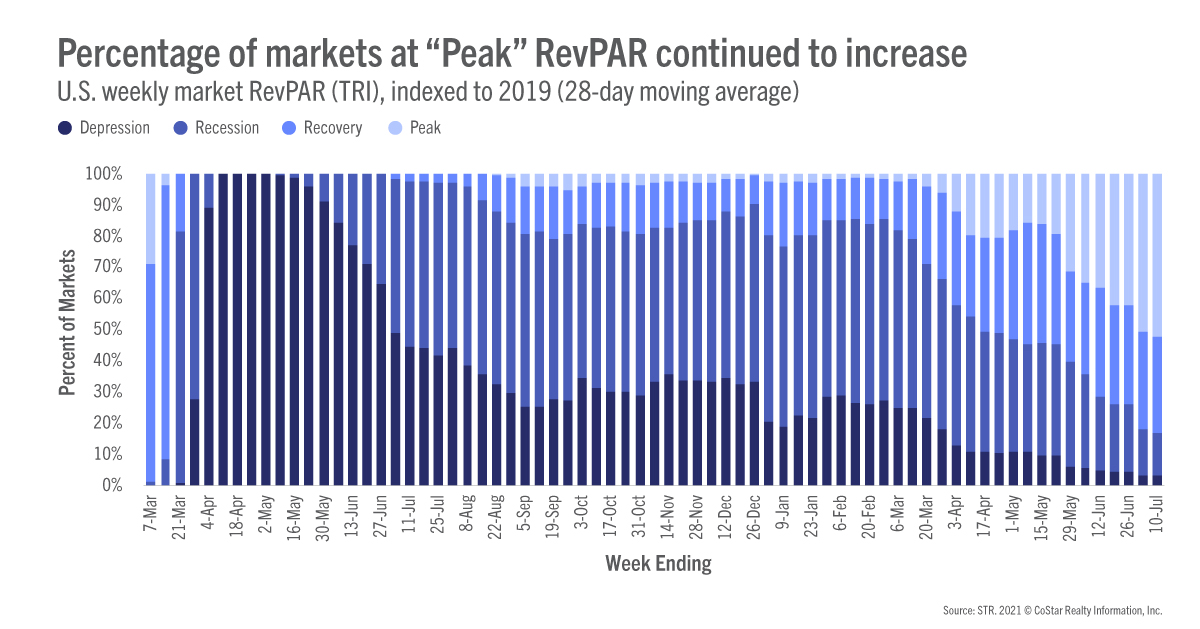
TRI RevPAR topped $91, the highest level since early November 2019. On a market basis, 48% had TRI RevPAR above the level seen in 2019. The percentage was lower than what we saw a week ago (76%), which was again the result of the holiday shift. On a 28-day moving average, which smooths out holiday shifts, 52% (87) of markets were well past their 2019 levels, which we categorize as being at “Peak” (TRI RevPAR indexed to 2019 greater than 100). The percentage of markets at “Peak” is the highest we have seen since we began the Market Recovery Monitor. Another 31% of markets (51) were in “Recovery” (TRI RevPAR indexed to 2019 between 80 and 100). Five markets (San Francisco, New York, San Jose, Boston, and Washington, DC) remained in “Depression” (TRI RevPAR indexed to 2019 below 50) with 14% (23) in “Recession” (TRI RevPAR indexed to 2019 between 50 and 80). TRI RevPAR in San Francisco was only 39% of what it was two years ago.
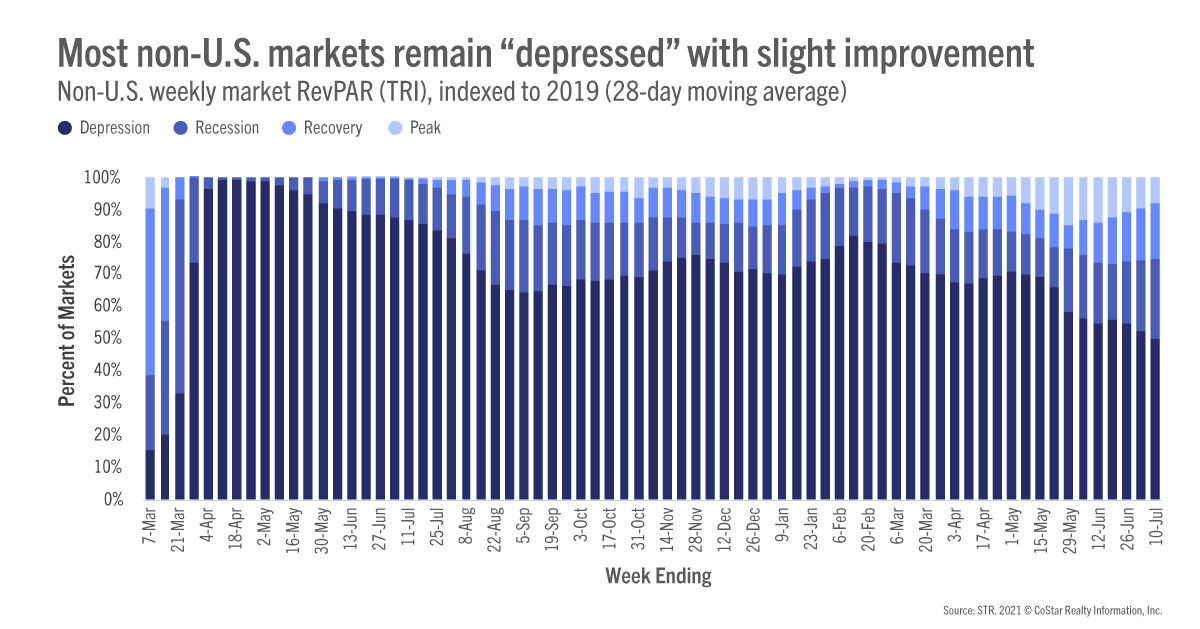
TRI occupancy outside the U.S. saw a slight improvement but remained low at 39%. Room demand is about 54% of what it was in 2019 with TRI RevPAR lingering in the “Depression” category. Among the 10 largest countries based on supply, TRI occupancy was in the mid-50s for China and the U.K. with China seeing a 6-point week-on-week improvement. Most other countries were in the 40s or lower with Japan’s occupancy (16%) the lowest of them all. On a market-level, 50% of all markets resided in the “Depression” state, down from 52% a week ago. Another 25% were in the “Recession” zone with only 8% at “Peak”, down from 10% a week ago. With the delta variant increasing and with strict travel restrictions, we expect little change in non-U.S. performance over the next few weeks.
While all measures of U.S. occupancy and demand show a moderation from highs achieved three weeks ago, it’s too early to claim we have peaked. There are countless potential explanations. As we have said repeatedly, it’s been too early to rejoice that recovery is in hand but it’s also too early to fear we are falling back into despair. History has taught us that the recovery will not be linear nor universal. Our current dependency on leisure demand means that we will likely see more weekly fluctuations than usual. We still believe that the industry is heading in the right direction, but fortitude is still required for the weeks and months ahead.
To learn more about the data behind this article and what STR has to offer, visit https://str.com/.


Sign up to receive our stories in your inbox.
Data is changing the speed of business. Investors, Corporations, and Governments are buying new, differentiated data to gain visibility make better decisions. Don't fall behind. Let us help.


Sign up to receive our stories in your inbox.
Data is changing the speed of business. Investors, Corporations, and Governments are buying new, differentiated data to gain visibility make better decisions. Don't fall behind. Let us help.