
Source: https://www.similarweb.com/corp/blog/research/business-benchmarking/online-dating-benchmarks/
I didn’t meet my husband the ‘old fashioned way,’ in a bar. Nope. We met on Tinder. While some may be surprised I found love on a dating app, it’s definitely not the exception to the norm anymore.
The online dating industry has grown 23% in 2021 alone. People worldwide are hoping to connect with that special someone and are looking to technology to give them a hand. Case in point: One billion people visited dating and relationship websites last month.
With so many people looking for their perfect match, competition for brands in the business of love faces stiff competition. It can be difficult to understand where you stand among other dating websites. That’s where digital benchmarking comes in. You can analyze traffic patterns, audience demographics, and user engagement to identify market leaders and understand your performance in relation to the industry as a whole.
In this edition of our industry benchmarking series, we break down the top online relationship websites worldwide to show you who’s winning hearts online.
Love without borders: a global look
The top dating and relationship websites worldwide are: tinder.com, badoo.com, match.com, pof.com, and 550909.com. There were 1.1 billion total visits to this industry worldwide in June 2021, a 0.8% increase from the month before. However a year-over-year (YoY) analysis shows just how popular online dating has become – traffic increased 26.3% from June 2020 to June 2021.

Other key benchmarks (June 2021):
Marketing channels: Most traffic to online relationship websites worldwide comes from direct (74.7%), followed by organic search (12.3%), referrals (4.3%), and email (4.3%).
Geography: Worldwide, 21% of the traffic share (74 million visits) comes from visitors in the U.S., 13.1% from Russia, 5.8% from France, 5.7% from Germany, and 3.3% from the U.K.
Bounce rate: On average, 27% of visitors to these websites view only one page before losing interest and leaving.
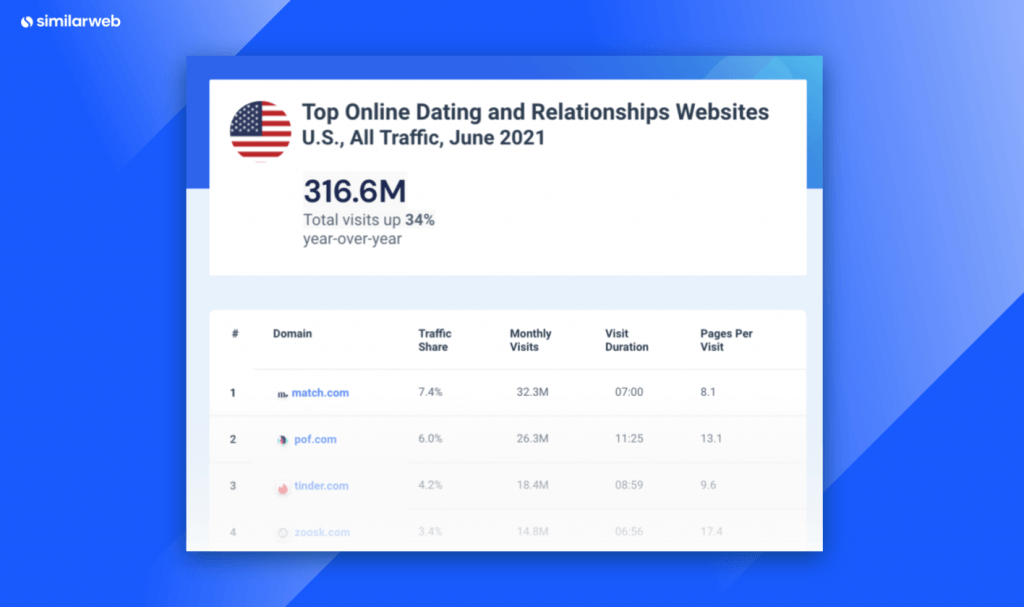
United States: More people seeking a match
Dating and relationship websites have boomed in the United States. In June 2021 there were 34% more total visits YoY and 5% more month-over-month (MoM).
The top U.S. dating and relationship websites don’t stray too far from the global pattern. Zoosk.com makes the list, replacing badoo.com. Match.com is much more popular though, grabbing the number one spot with 7.4% of the traffic share (compared to 2.4% globally).
Other well-known dating websites make the top 10 leaderboard. Last month okcupid.com had 12.8 million monthly visits, or about 3% of the traffic share, and ashleymadison.com earned 6.4 million visits, or 1.5%.
Other key benchmarks (June 2021):
Marketing channels: Most of the traffic to online relationship websites in the U.S. comes from direct (79.2%), followed by organic search (9.9%), emails (4.0%), and referrals (2.9%).
Desktop vs. mobile split: Desktop accounts for 23.2% of visits, whereas 76.8% of the device distribution comes from mobile web.
Gender distribution: 67% of visitors to these websites are male, 37% are female.
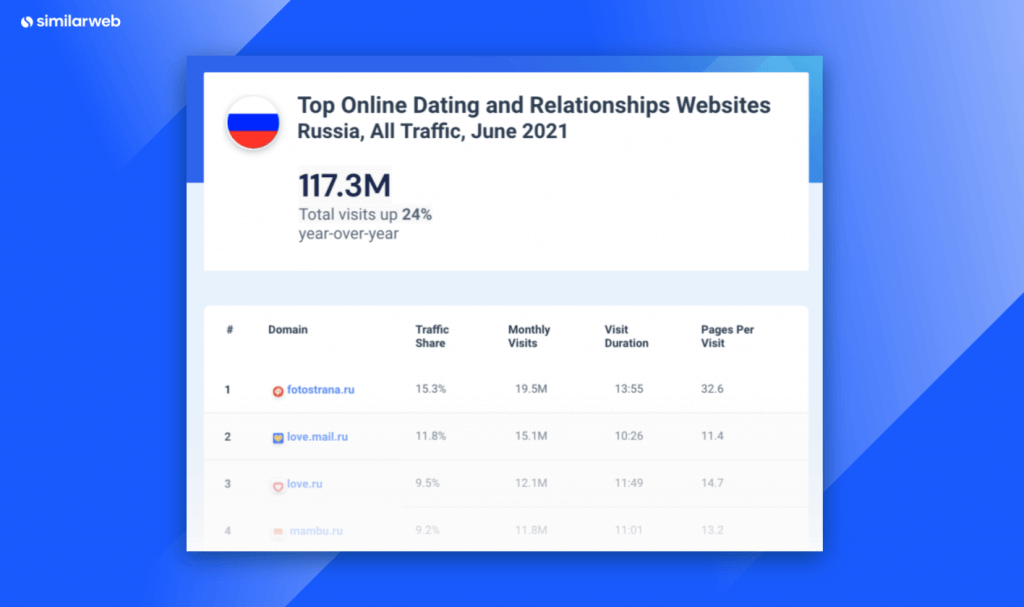
Russia: Keeping it local
Russia’s the second most popular country for online dating, with about 117 million monthly visits in June 2021. This is a 24% increase compared to June 2020, during which there were 95 million visits to online dating websites.
Local and niche dating websites, like fotostrana.ru, love.mail.ru, and love.ru dominate in the region. This suggests that while there are certain companies we expect to dominate worldwide, a micro view can reveal smaller, influential players you need to monitor.
Other key benchmarks (June 2021):
Marketing channels: Most of the traffic to online relationship websites in Russia comes from direct (56.6%), followed by referrals (14.5%), organic search (14.4%), and email (7.2%). While Russia receives less direct traffic than the global standard, the country has much better performance in terms of referrals and email.
Age distribution: On average, 75% of visitors are between the ages of 18-44 years old; 25% are 45+ years old.
Gender distribution: 50% of visitors to these websites are male, 50% are female.
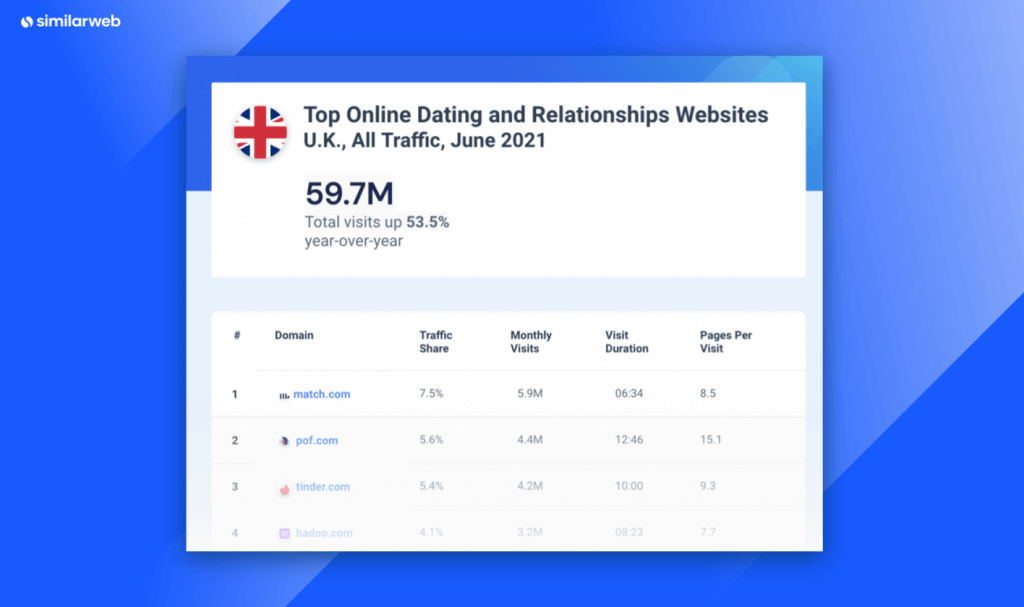
United Kingdom: Love island
The online dating industry has grown significantly YoY. Between June 2020 and June 2021, total visits increased 53.5%, climbing from 38.1 million to 59.7 million.
Traffic share is split almost equally among the top domains in the U.K., showing the highly competitive nature of this industry. Only 1.5 million monthly visits separate the top two websites: match.com and pof.com.
Compared to the global average, the U.K. has a better engagement rate, with longer session duration and higher pages per visit on average, meaning the audience is spending more time clicking through these websites before losing interest.
Other key benchmarks (June 2021):
Age distribution: On average, 63% of visitors are between the ages of 18-44 years old; 37% are 45+ years old.
Desktop vs. mobile split: Desktop makes up 19.6% of visits, but mobile dominates the device distribution with 80.4%.
Bounce rate: On average, 36% of visitors only view one page before losing interest and leaving.
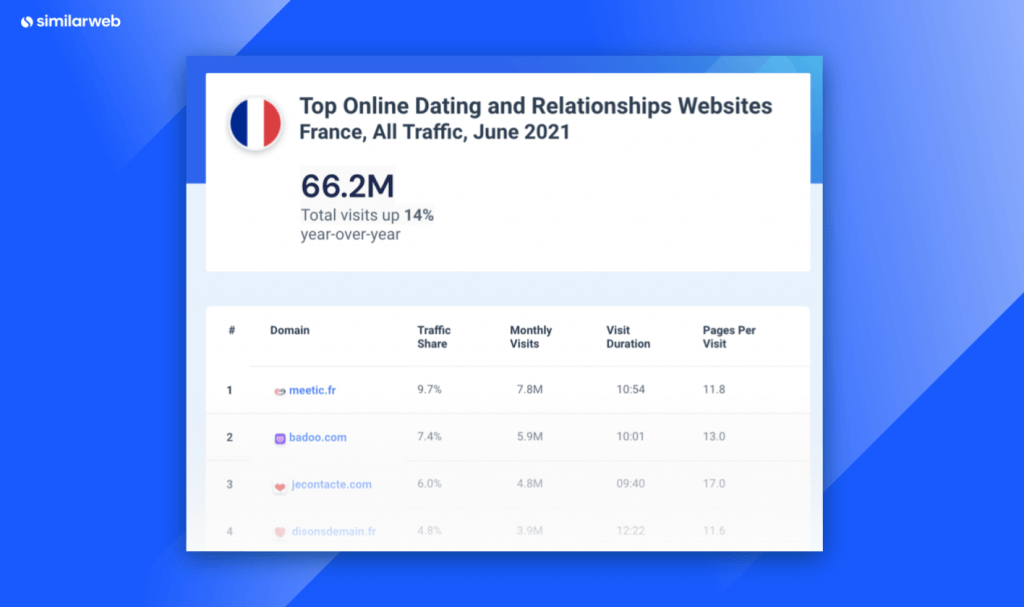
France: The breakup
Last month, traffic to online dating websites in France decreased by 4%, dropping to 66 million. Despite a lower-performing month, we can see the industry is thriving when looking at YoY, as it’s grown 14% since June 2020.
The top traffic share winners represent a nice split between international companies and more local ones. Local traffic share winners include jecontacte.com, and disonsdemain.fr. Tinder.com sneaks in at fifth place with 4.8% of the traffic share, or 3.8 million monthly visits.
Other key benchmarks (June 2021):
Desktop vs mobile split: Desktop accounts for 30.7% of visits, whereas 69.3% of the device distribution comes from mobile web.
Bounce rate: On average, 29% of visitors view one page before losing interest and leaving.
Gender distribution: 60% of visitors to these websites are male, 40% are female.
Germany: Visitors are direct
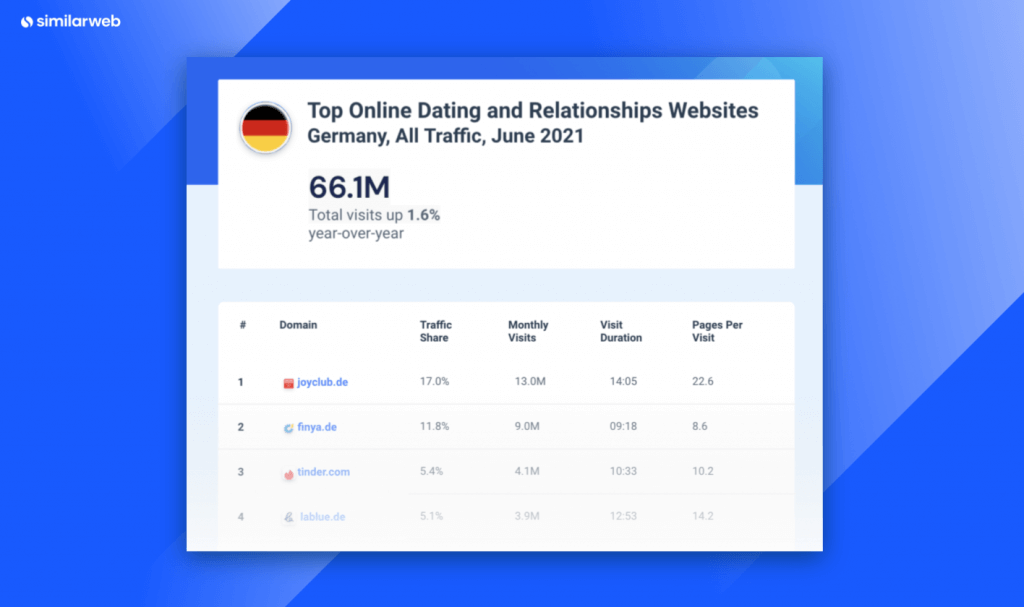
Of all the countries on this list, Germany has seen some of the slowest growth YoY. Between June 2020 and June 2021, online dating websites only grew 1.6%, from 65.1 million total visits to 66.1 million. While there was a slight spike in August 2020, traffic remained relatively stable in the last year, hovering between the 60 and 65 million mark.
Joyclub.de is by far the most popular online relationship website, with 36% more monthly visits than its closest competitor. The website also receives 80% more unique visitors than finya.de and 68% more than tinder.com.
Other key benchmarks (June 2021):
Marketing channels: Most of the traffic to online relationship websites in Germany comes from direct (77.5%), followed by organic search (10.7%), emails (3.2%), and display ads (3.0%). Germany is one of the only countries that gets a higher traffic share from display ads compared to referrals, which points to a potential difference in audience preference in Germany.
Bounce rate: On average, 27% of visitors to these websites view only one page before losing interest and leaving
Desktop vs mobile split: Desktop makes up 30% of visits, and 70% of the device distribution comes from mobile web.
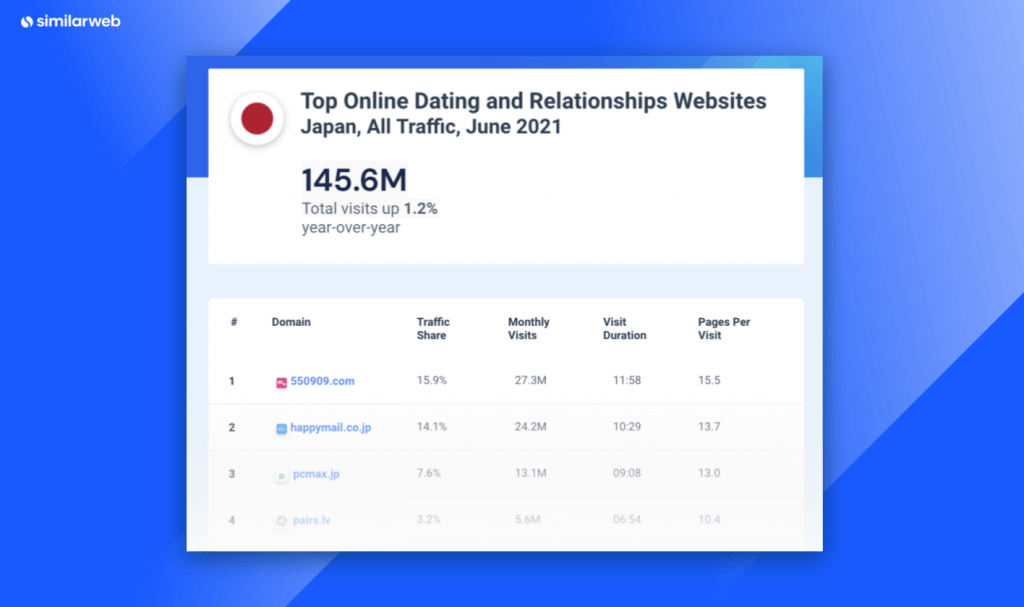
Japan: Female power
Like Russia, most of the top Japanese online dating websites are more regionally focused. Although tinder.com makes the list of the top ten traffic share winners for the country, it’s only seventh on the list with 2.7 million monthly visitors. For reference, the top website, 550909.com, receives 27.3 million monthly visitors, 900% larger.
One of the most notable differences in Japan compared to the other leading countries is the gender distribution. It’s the only country where there are more female users compared to males – 55% of visitors to these websites are female, 45% are male.
Other key benchmarks (June 2021):
Age distribution: On average, 83% of visitors are between the ages of 18-44 years old; 18% are 45+ years old.
Bounce rate: On average, 32% of visitors to these websites view only one page before losing interest and leaving.
Desktop vs mobile split: 7% of visits came from desktop, whereas 93% of the device distribution comes from mobile web.
Apps to swipe right on
We couldn’t leave the top mobile apps off this list. As you can see from the metrics above, the majority of traffic to the top websites in this category comes from mobile web, so it makes sense that dating in the app world is taken seriously.
Take a look at the top mobile apps for dating in the U.S., including their performance breakdown. Tinder takes the number one spot, with an install penetration of 3.1% and 6.8 million downloads from April to June 2021.
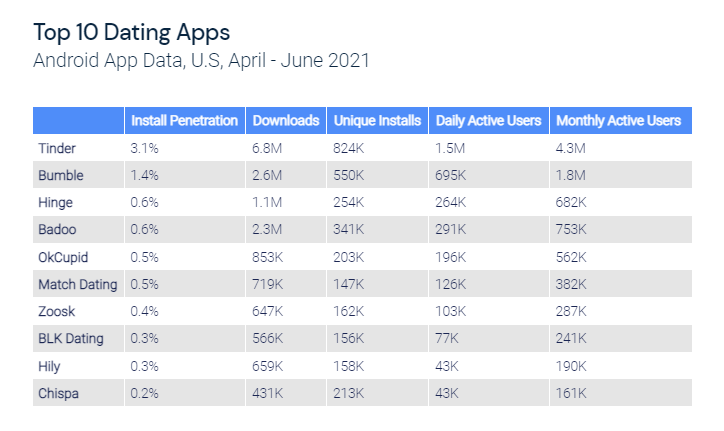
Need a refresher on the engagement metrics you should be looking at for apps? Below is a quick summary of the metrics analyzed:
To learn more about the data behind this article and what Similarweb has to offer, visit https://www.similarweb.com/.


Sign up to receive our stories in your inbox.
Data is changing the speed of business. Investors, Corporations, and Governments are buying new, differentiated data to gain visibility make better decisions. Don't fall behind. Let us help.


Sign up to receive our stories in your inbox.
Data is changing the speed of business. Investors, Corporations, and Governments are buying new, differentiated data to gain visibility make better decisions. Don't fall behind. Let us help.