
Introduction
Welcome to the September Apartment List National Rent Report. Our national index increased by 2.1 percent from July to August, a slight cool-down from 2.5 percent the month before, but nevertheless a continuation of rent growth that has persisted since the start of the year. Since January 2021, the national median rent has increased by a staggering 13.8 percent. To put that in context, rent growth from January to August averaged just 3.6 percent in the pre-pandemic years from 2017-2019.
With rents rising virtually everywhere, only a few cities remain cheaper than they were pre-pandemic. And even there, rents are rebounding quickly. In San Francisco, for example, rents are still 12 percent lower than they were in March 2020, but the city has seen prices increase by 20 percent since January of this year. At the other end of the spectrum, many of the mid-sized markets that have seen rents grow rapidly through the pandemic are only continuing to boom – rents in Boise, ID are now up 39 percent since March 2020. Rent growth in 2021 so far is outpacing pre-pandemic averages in 98 of the nation’s 100 largest cities.
While rents continue to grow, apartment vacancies reach historic lows
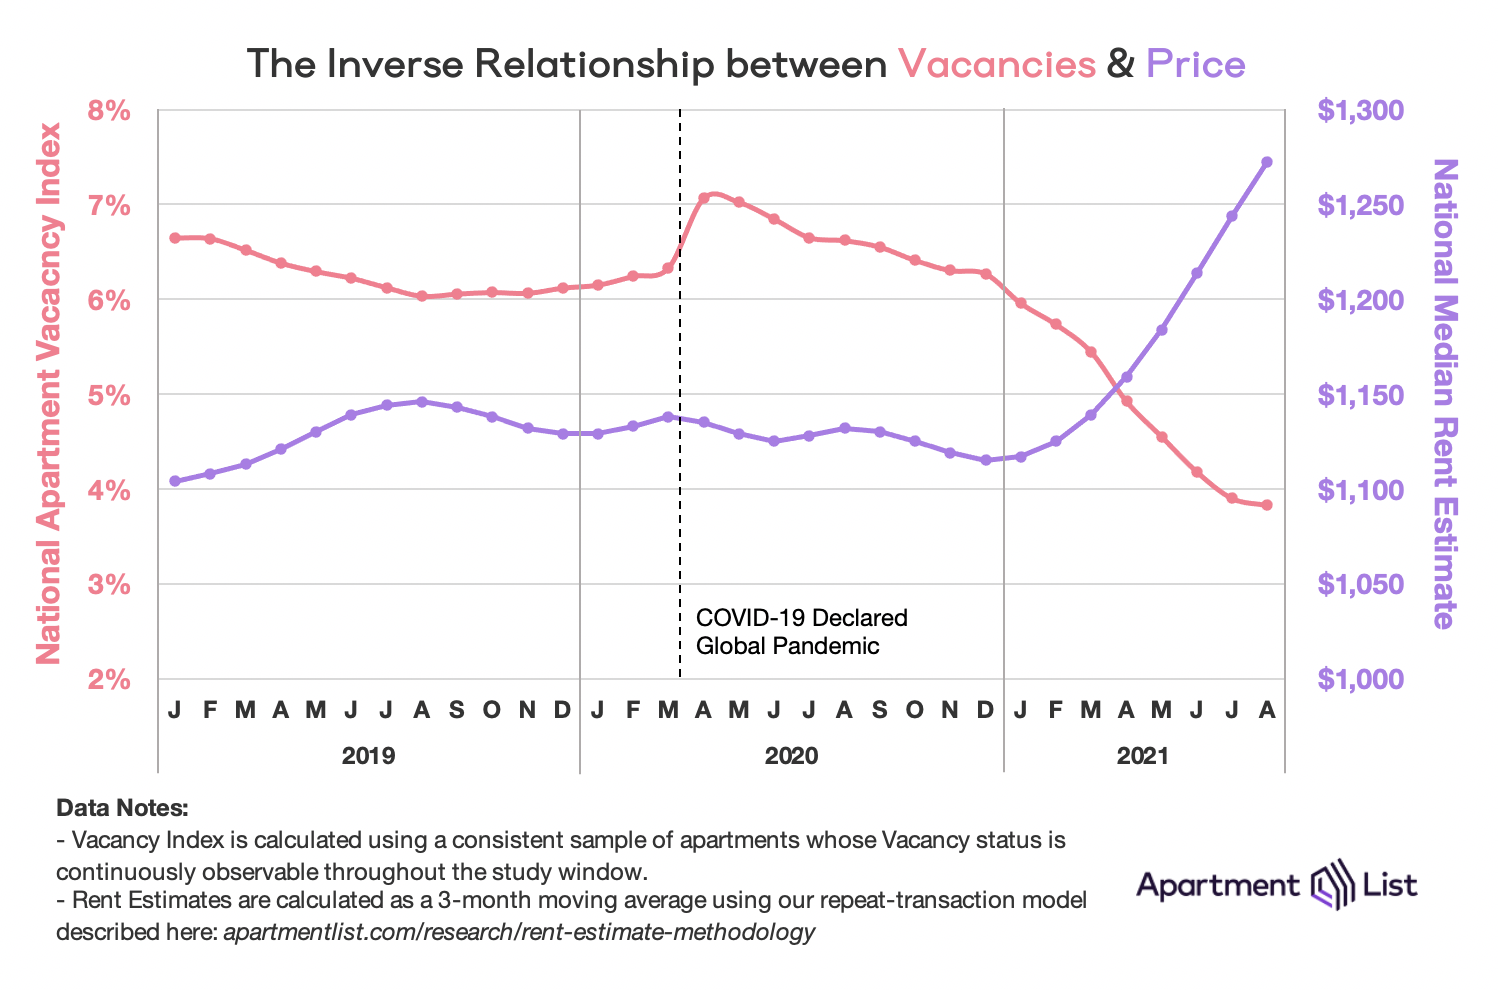
Last summer, many cities were experiencing elevated vacancy rates coinciding with a sudden decrease in demand as renter households consolidated. This summer, however, demand has been continuously heating up, leading to a supply constricted market. In contrast to this time last year, when households were rapidly consolidating due to the uncertainty of the pandemic, the total number of households in the U.S. is now greater than ever before at over 131 million.1 Some of these households are likely aspiring homebuyers, but they’re facing a historically tight for-sale market, which has seen a 48 percent drop in inventory from last year. As would-be home buyers get priced out of the for-sale market, they continue to rent, likely a driving factor for the increasing incomes and budgets of renters searching on Apartment List. This high demand has created a tight market, resulting in our vacancy index dropping sharply throughout 2021 as prices increase rapidly. Rents are now up more than 13 percent this year, more than doubling the overall rate of inflation.
Rent growth heating up across the country
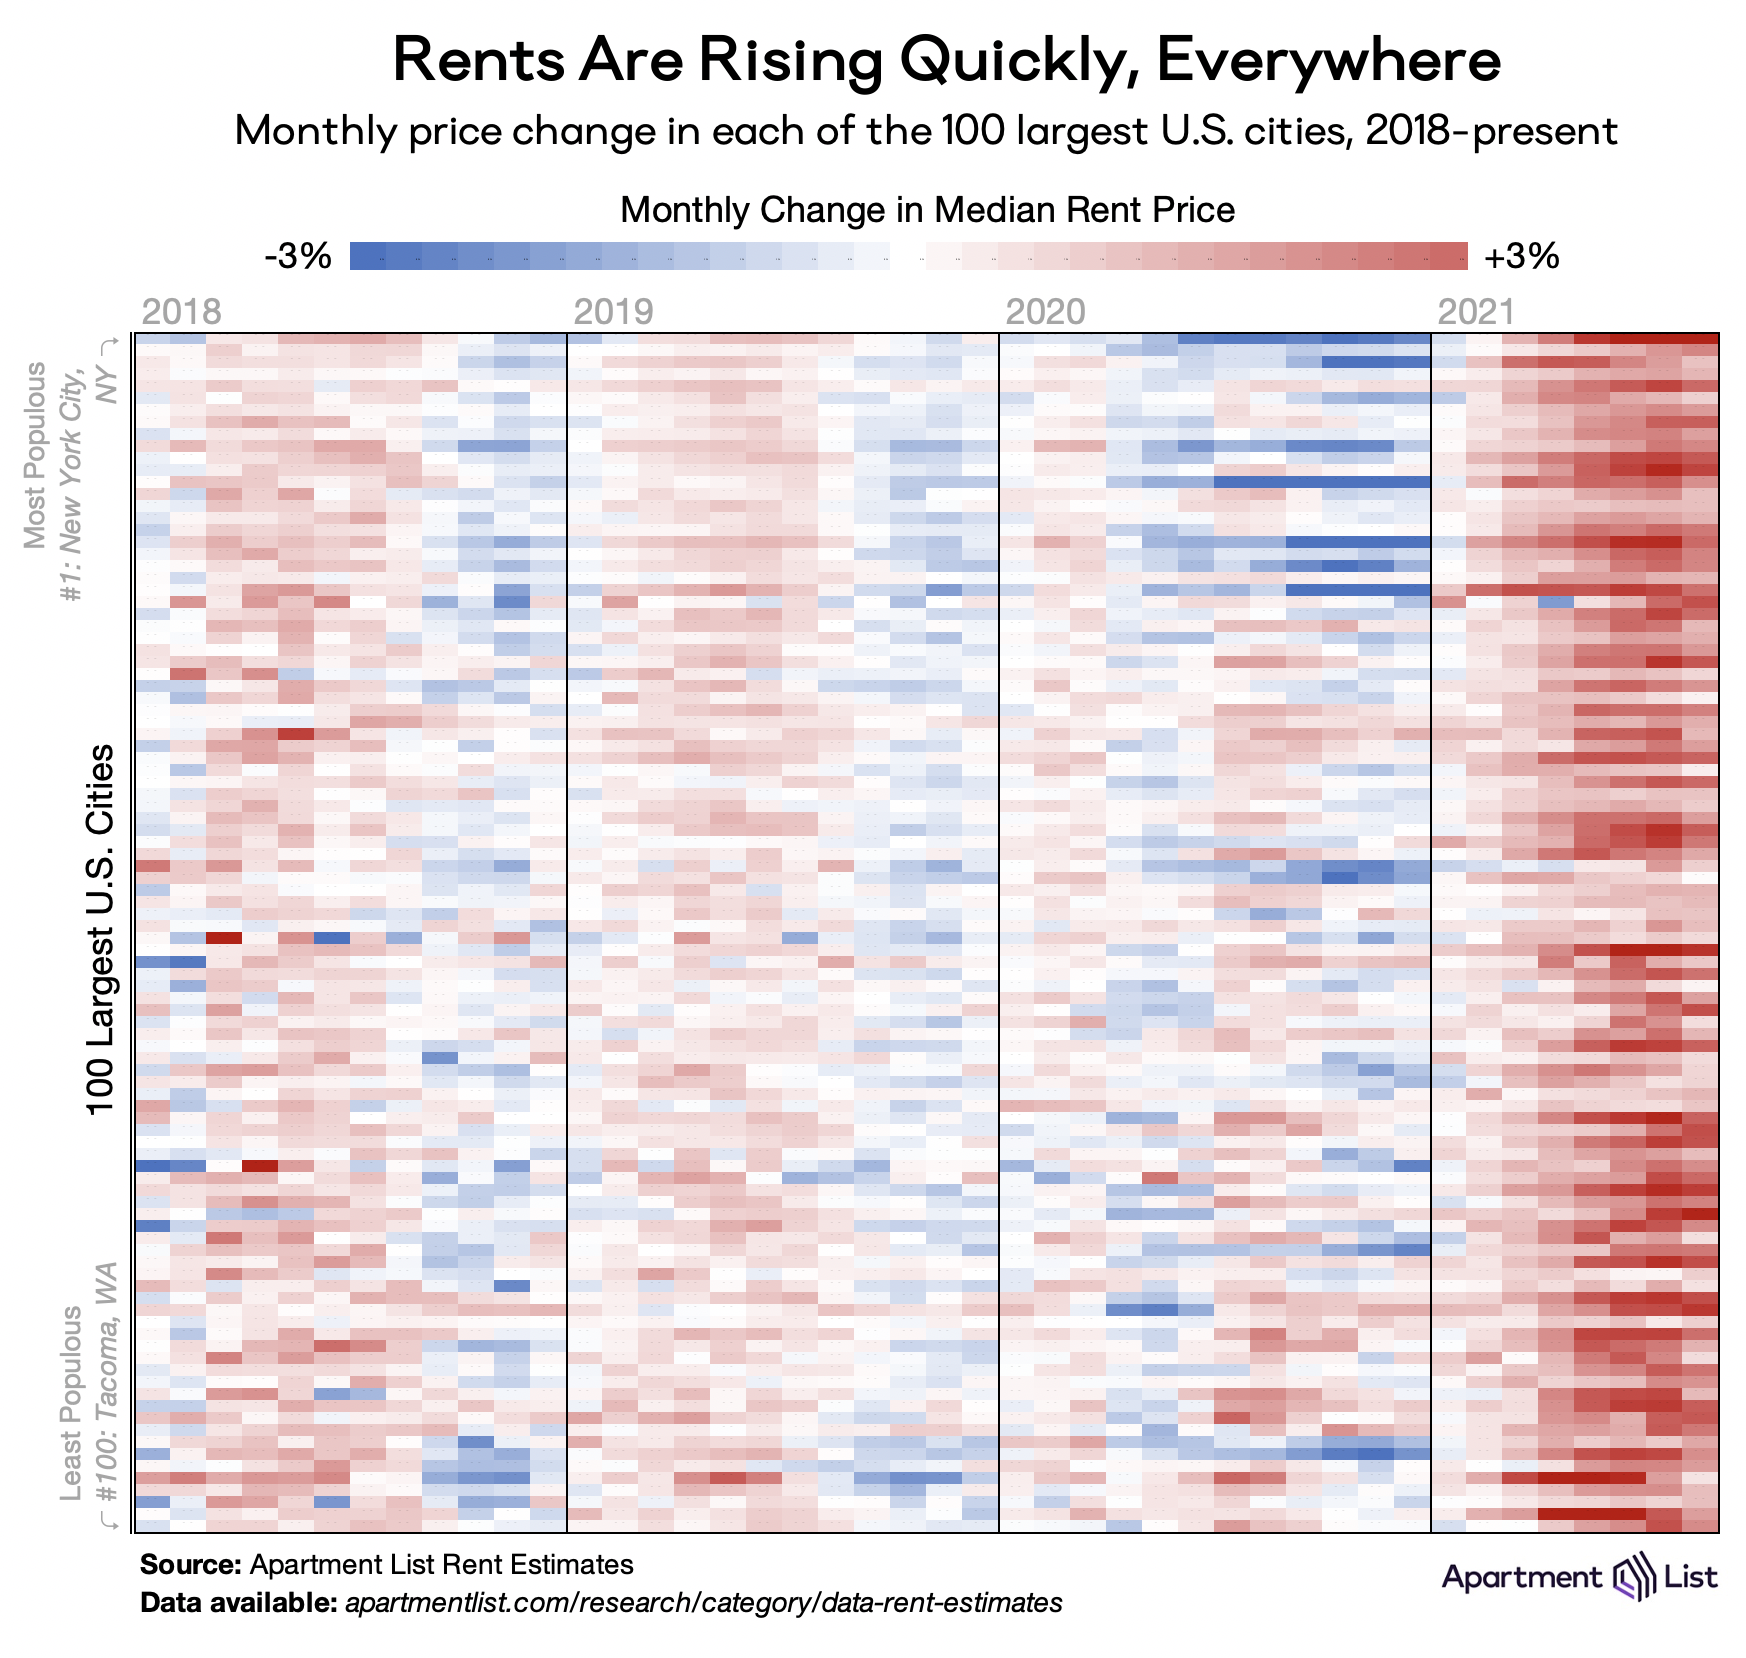
While our national rent index always masks some regional variation, the 2021 rent boom is affecting virtually every major market in the country. This is a big change from 2020, when rents fell precipitously in expensive markets while growing quickly in more-affordable ones. In 2021, rents are rising across the board. The chart below visualizes monthly rent changes in each of the nation’s 100 largest cities from January 2018 to August 2021. The color in each cell represents the extent to which prices went up (red) or down (blue) in a given city in a given month. Bands of dark blue in 2020 represent the large urban centers where rent prices cratered (e.g., New York, San Francisco, Boston), but those bands have quickly turned red as ubiquitous rent growth sweeps the nation in 2021. In 2020, 75 of these cities saw rent prices rise in August, at an average rate of 0.9 percent. This year, all 100 cities got more expensive in August, and average rent growth more than doubled.
Only 8 cities still have rents discounted from pre-pandemic levels
After prices rose again in August, some of the cities that saw dramatic pandemic-era rent drops are finally back to pre-pandemic prices, including the nation’s two largest: New York City and Los Angeles. In New York City, prices went up 5.8 percent last month, faster than anywhere else in the country. There, the city-wide median rent price is now $2,052, above $2,000 for the first time since March of last year. On the side of the country, Los Angeles experienced 2.5 percent rent growth this month, and the median rent price now stands at $1,874. Other major cities that eclipsed pre-pandemic rent prices this month include Boston, MA; Portland, OR; and St. Paul, MN.
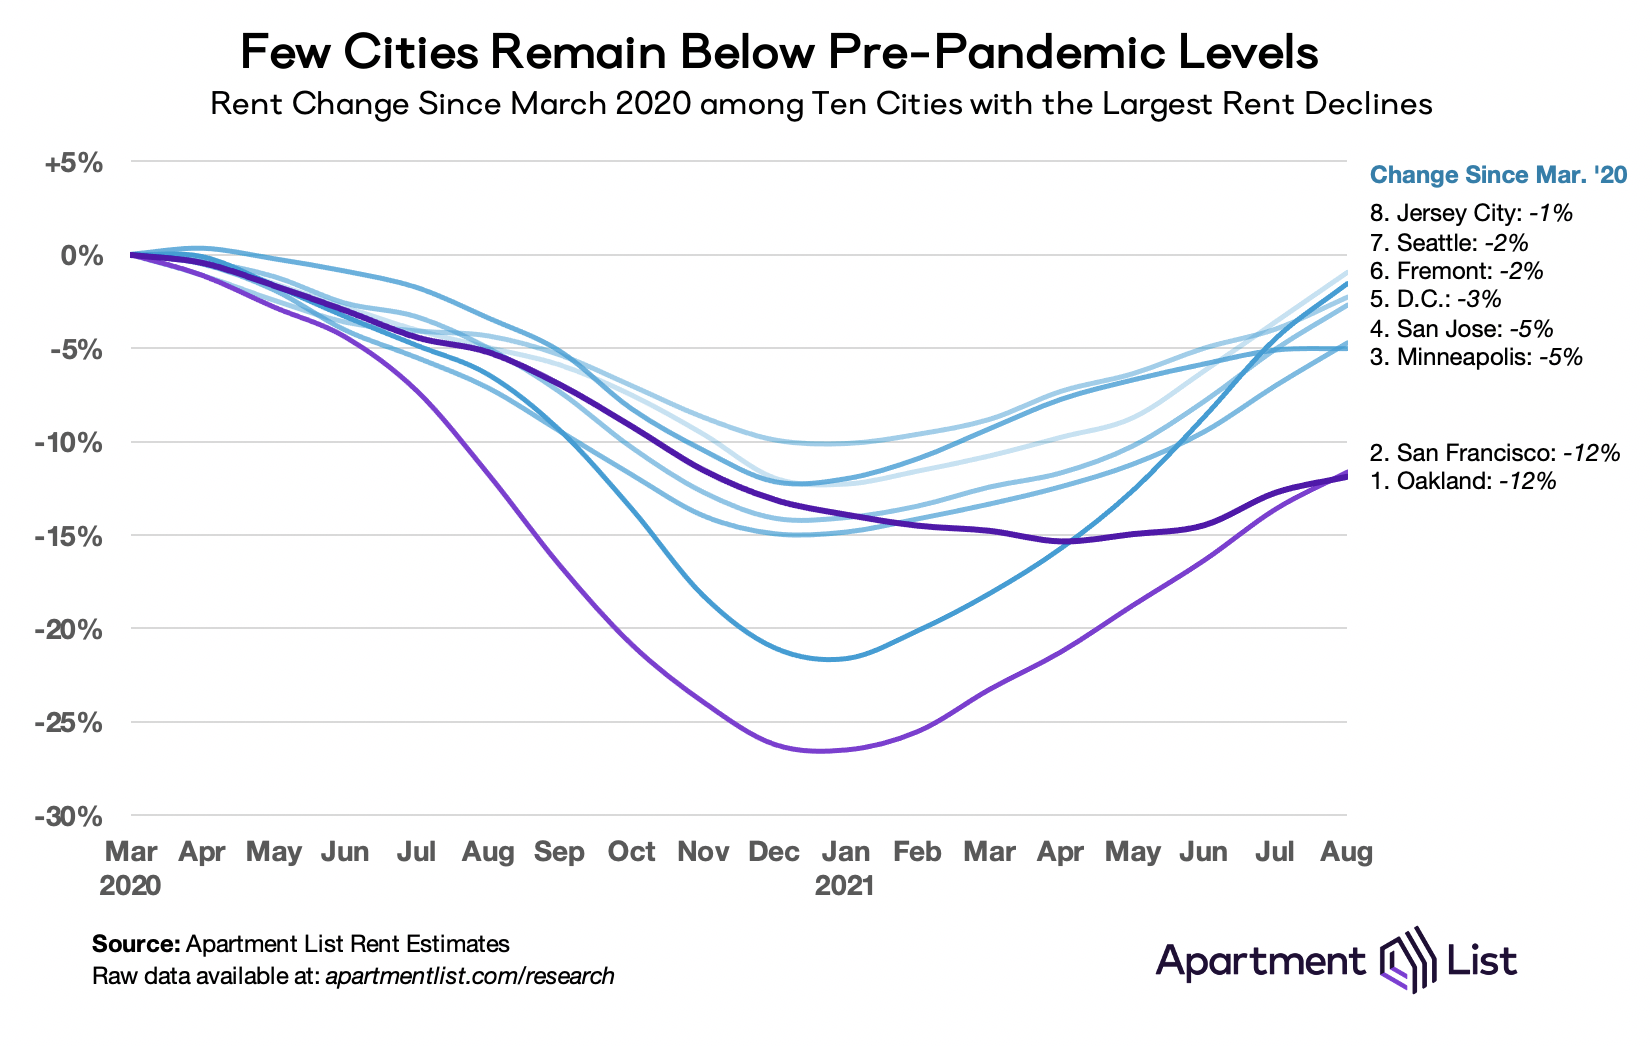
That means that today, “pandemic pricing” is over in most of the country. Rents remain below pre-pandemic levels in just 8 large cities: four California cities in the San Francisco Bay Area (i.e, San Francisco, Oakland, San Jose, and Fremont); Minneapolis, MN; Washington, DC; Seattle, WA; and Jersey City, NJ. The chart below visualizes the rapid rent drops and rebounds in each of these places. Oakland and San Francisco consistently made headlines throughout the pandemic for staggering rent drops and today are the only two cities retaining double-digit price reductions. The remainder should be back to pre-pandemic prices before too long.
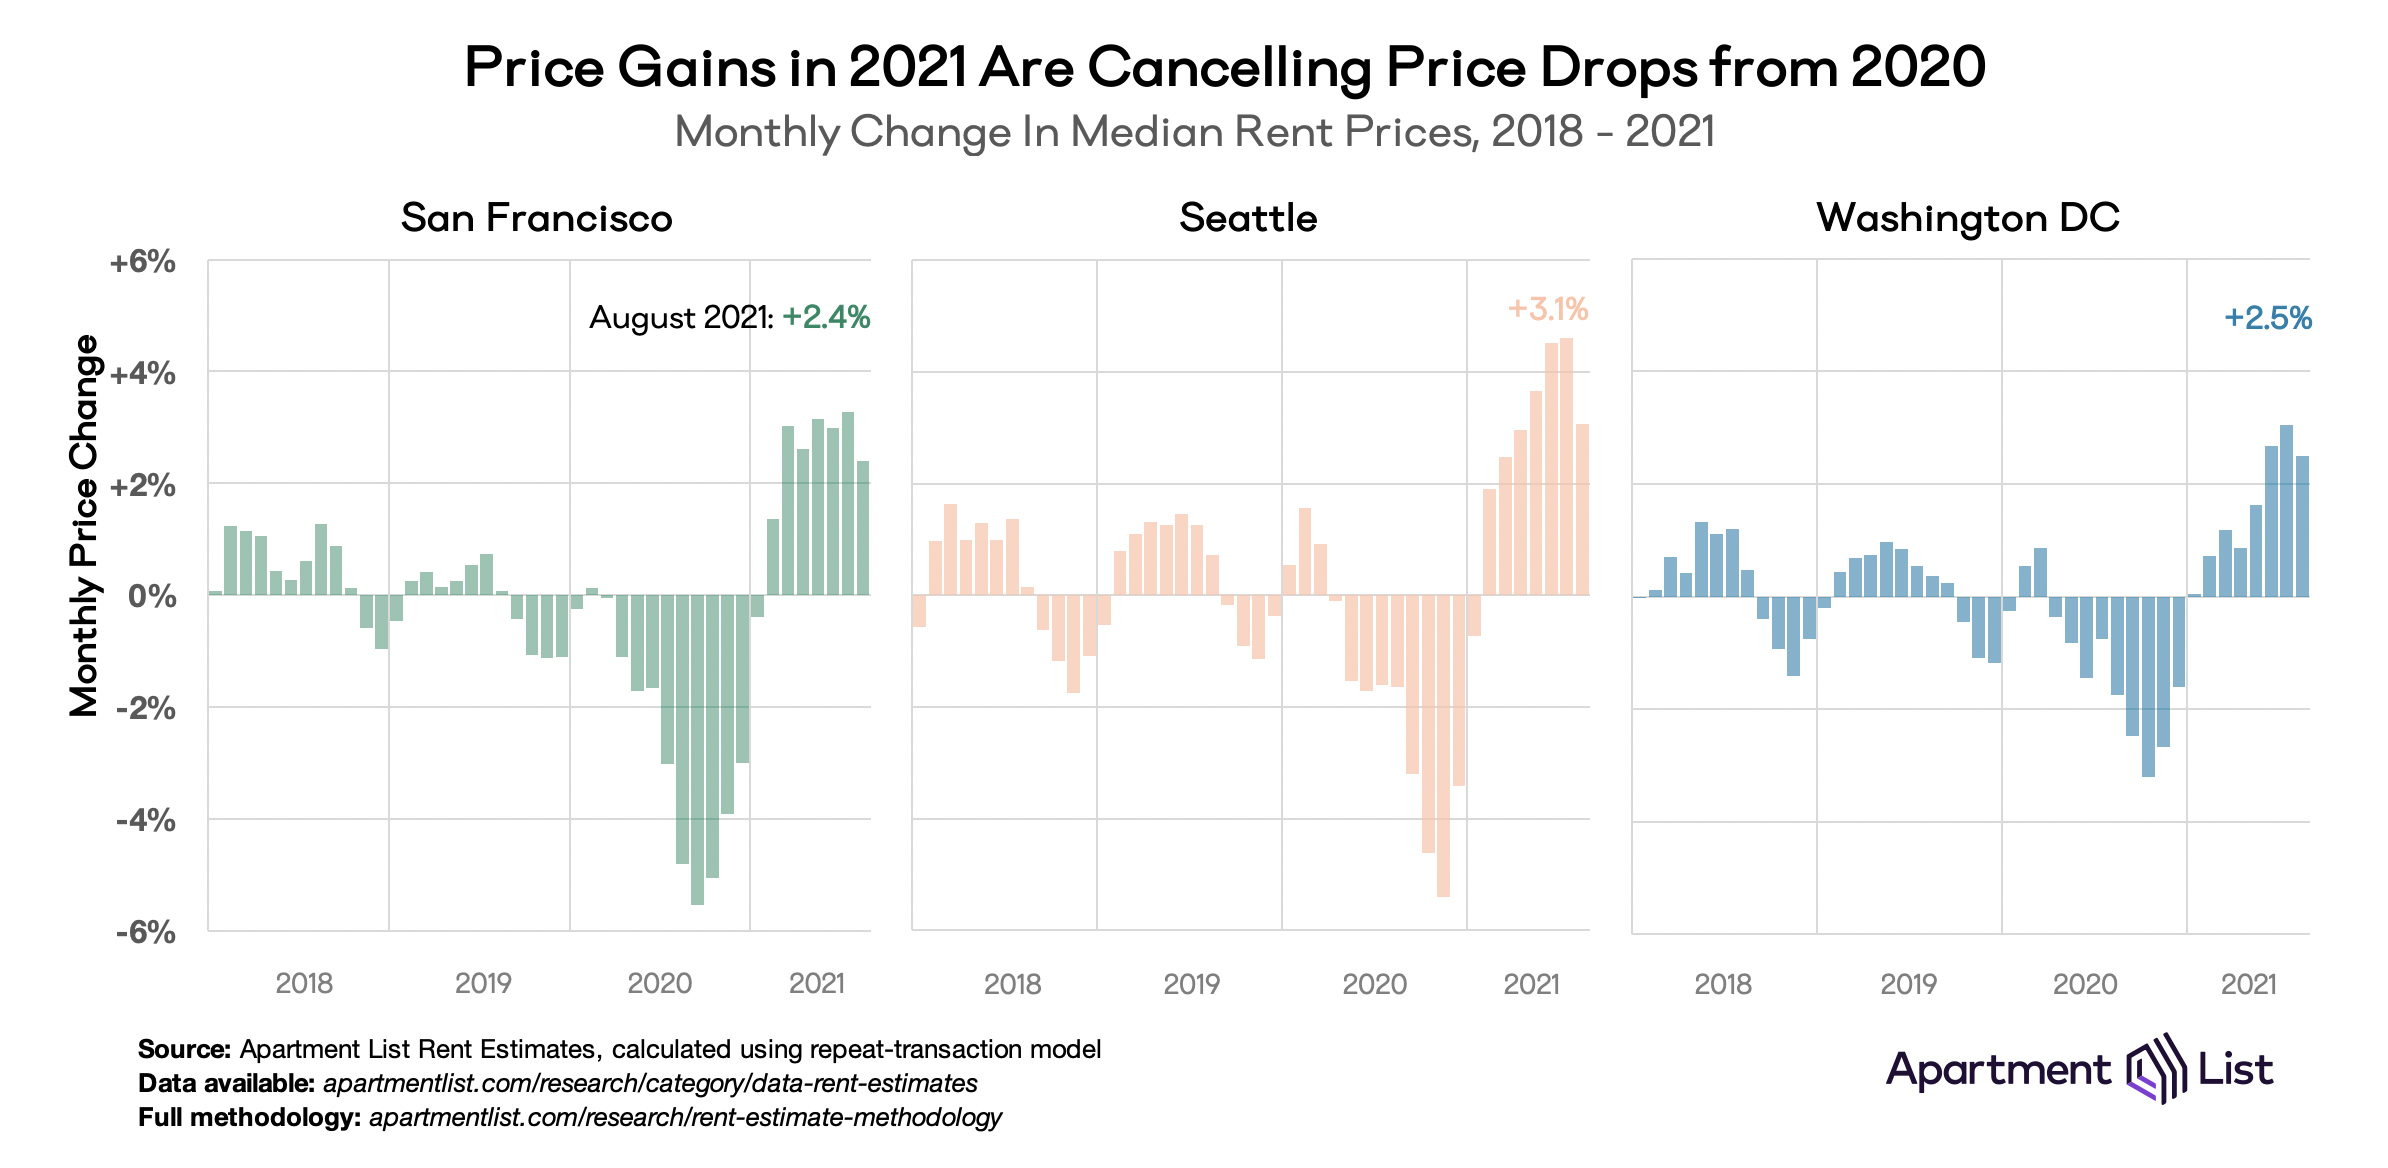
These COVID-era price fluctuations – down quickly at the start of the pandemic, up quickly since the start of 2021 – are significantly more volatile than the seasonal price fluctuations we normally see in these markets. The chart below shows month-over-month price changes from 2018 to August 2021. Monthly changes of +/- 2 percent were relatively rare in the years preceding the pandemic, but in 2020 and 2021 we have seen extended stretches where prices rise and fall at more than twice that rate.
Affordable mid-size markets continue to boom
For other parts of the country, rent growth today is nothing new. Many smaller markets across the country began heating up more than a year ago, as the pandemic and remote work spurred demand for more space and better affordability. In regions like the Mountain West and Sunbelt, rent prices grew even as the surrounding economy struggled in 2020, and in 2021 they continue to grow steadily. The chart below highlights the ten individual cities with the largest rent growth since the start of the pandemic.
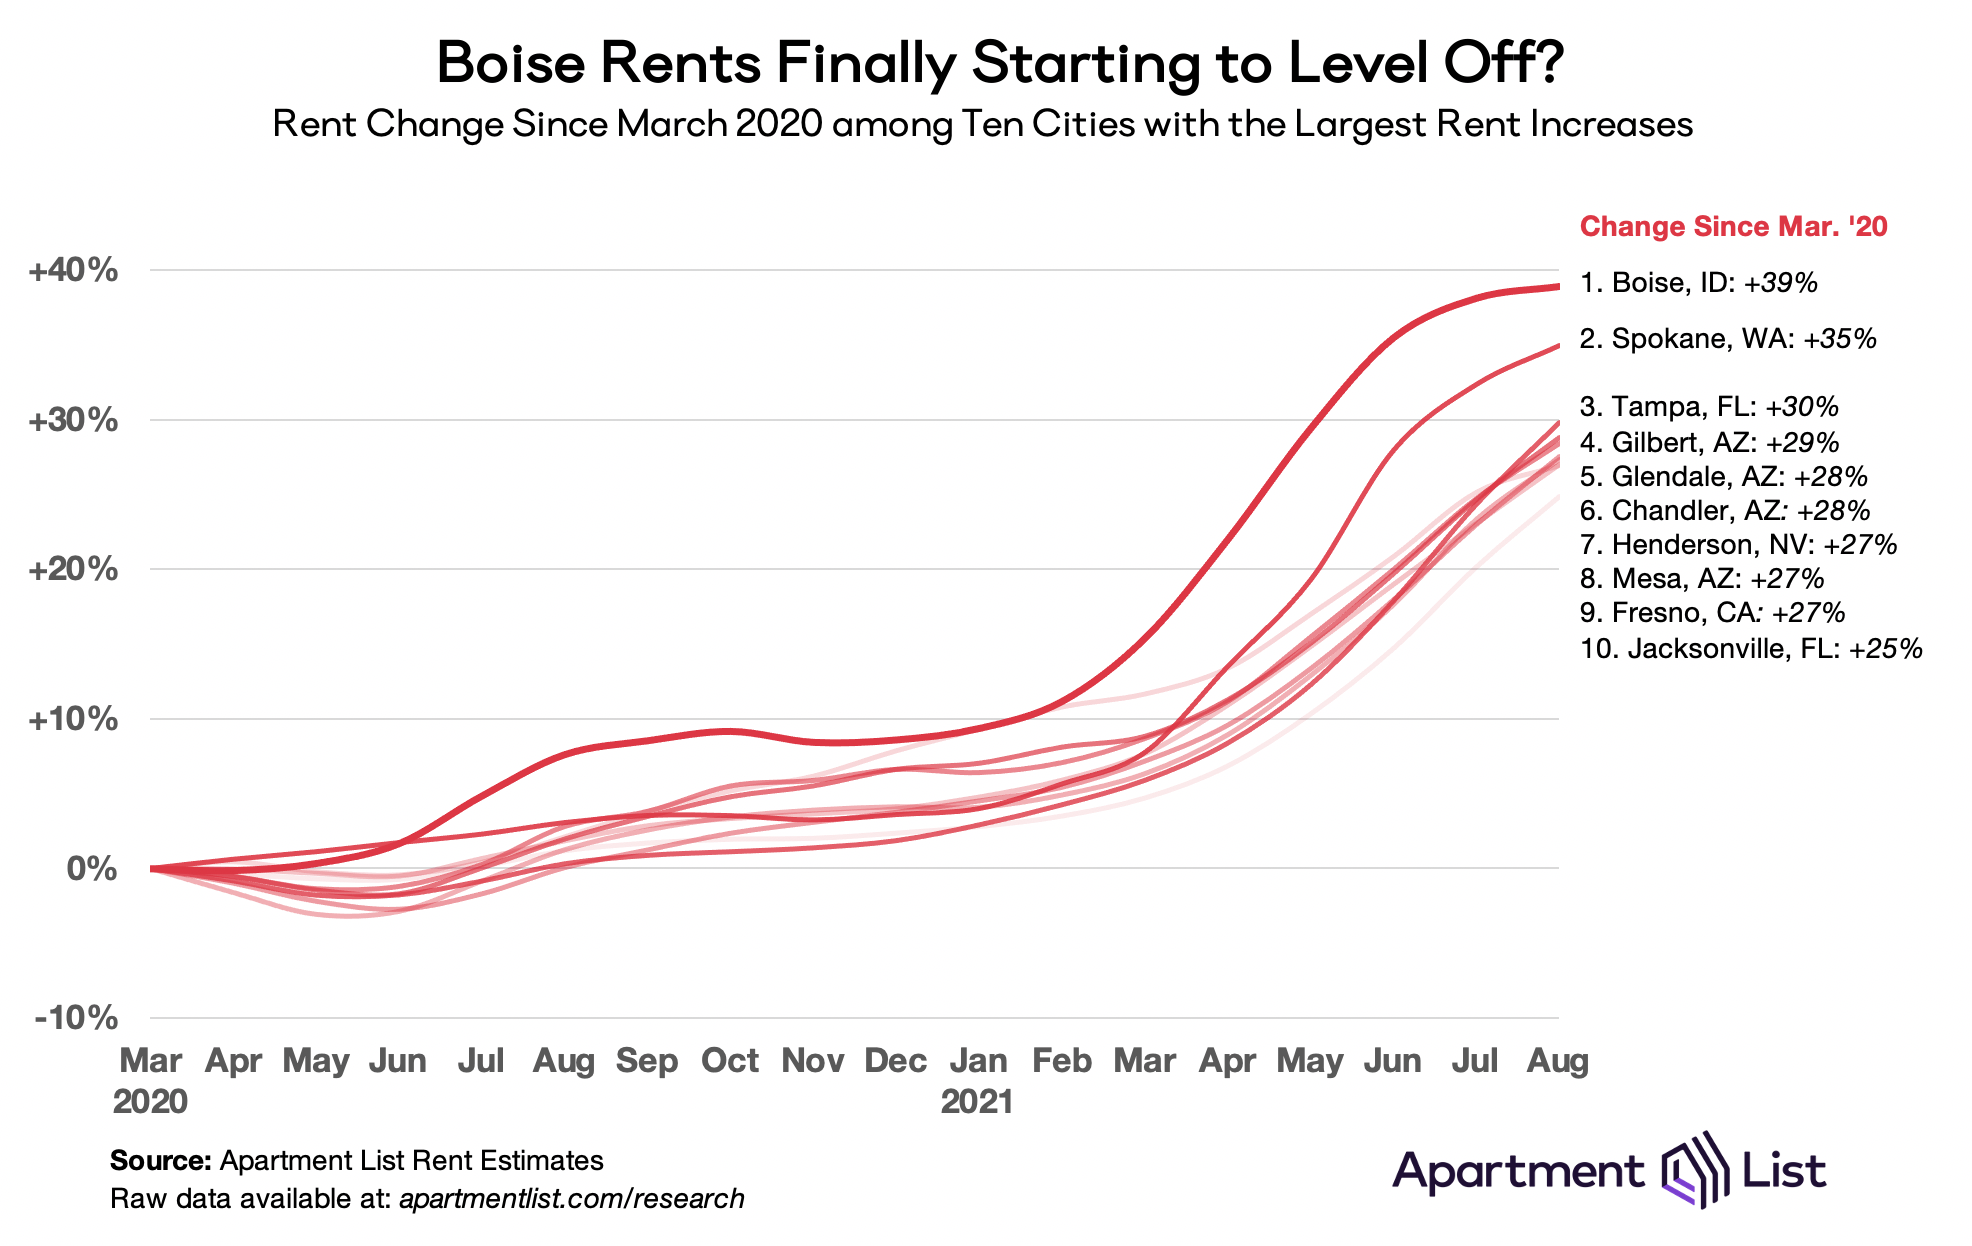
Leading the trend is Boise, ID, which has sat atop this list for several months. Rents in Boise are now up 39 percent since the start of the pandemic. And nearby in Spokane, WA rents are up 35 percent. Although prices continue to rise here, rent growth has slowed considerably over the past few months. In August, rents rose 0.8 percent in Boise and 2.1 percent in Spokane, a far cry from earlier this year when rents were growing 5 percent each month.
But as Boise and Spokane slow, rent growth in the other cities has shown no signs of cooling. Tampa, FL jumped to the #3 spot this month with the nation’s 3rd fastest monthly rent growth in August (+4.4 percent), eclipsing a trio of fast-growing Arizona cities. Henderson, NV (outside Las Vegas) and Fresno, CA (in California’s Central Valley) remain boom towns, while Jacksonville, FL joins Tampa as the second Florida city on the list. As of August, all ten cities on this list have seen prices rise more than 25 percent since March 2020.
In many of these markets the pandemic did not start a new trend, so much as accelerate an existing one. For example, from 2017 through 2019, rents in Mesa, AZ increased 25.5 percent, the fastest growth in the nation over that period. Similarly, Fresno, CA ranked third for fastest rent growth, while Chandler, AZ ranked sixth. Affordability was waning even before the pandemic shifted new demand towards these attractive markets. Looking ahead, the pandemic will only worsen supply shortages and affordability concerns unless the cities on this list develop robust plans for building enough homes to absorb incoming demand.
Conclusion
Although the pandemic created some softness in the rental market last year, 2021 has brought the fastest rent growth we have on record in our data. Nationally, and in nearly all individual cities across the country, rent growth in 2021 has exceeded average growth rates from pre-pandemic years. As prices rebound rapidly even in the cities that saw the sharpest declines last year, there are very few cities remaining where rents have yet to surpass pre-pandemic levels. With the nation’s fastest month-over-month growth, New York City rents officially caught back up to March 2020 levels this month, as did major economic hubs like Los Angeles, Boston, and Chicago.
At the same time, booming markets across the Mountain West, Sun Belt, and Southeastern United States continue to see rent prices grow. As we approach the winter, a seasonal slowdown in the rental market should relieve some of this pressure, but with historically-low apartment vacancy rates and growing household mobility, a winter cooldown is unlikely to reverse much of the dramatic price growth we’ve measured throughout the year.
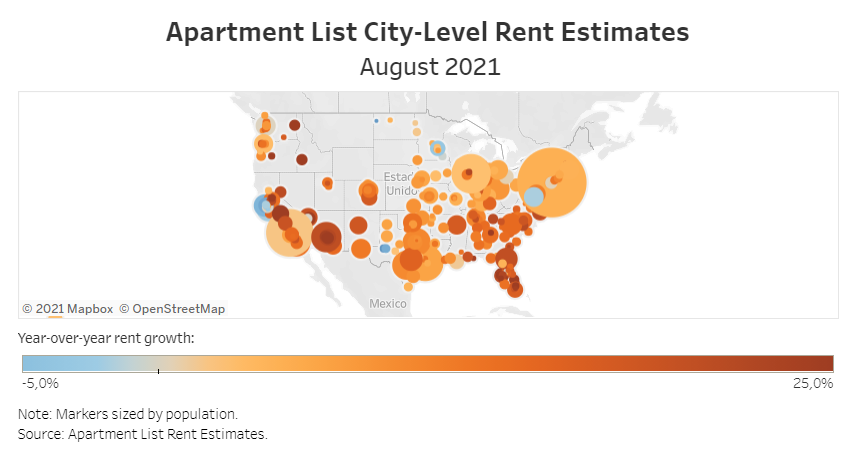
For complete data, explore the interactive map below or head over to our rental data page, where you can download the most recent estimates for your city, as well as historic data going back to 2017. And as always, feel free to contact us with any questions!
To learn more about the data behind this article and what Apartment List has to offer, visit https://www.apartmentlist.com/.


Sign up to receive our stories in your inbox.
Data is changing the speed of business. Investors, Corporations, and Governments are buying new, differentiated data to gain visibility make better decisions. Don't fall behind. Let us help.


Sign up to receive our stories in your inbox.
Data is changing the speed of business. Investors, Corporations, and Governments are buying new, differentiated data to gain visibility make better decisions. Don't fall behind. Let us help.