Why do earnings matter?
An earnings report gives investors the opportunity to assess a company’s alpha-generating potential. Some of the critical questions that earnings can answer are:
Based on this information, an investor may decide to hold the stock long-term or to sell as soon as possible.
In this article, we will address important fundamentals surrounding earnings forecasts, including:
The challenge: An information blackout
In short, investors face an ‘information blackout’ from one quarter to the next. The details of how a company is performing are essentially unknown until quarterly and annual earnings reports are released.
It’s not surprising that with so much at stake, earnings season is a time of great uncertainty for investors. I know it’s a cliché, but there is still some truth in the saying that investors hate uncertainty. That’s why stocks often experience increased volatility during the pre-earnings buildup. It’s also why earnings forecasts are so valuable.
According to Bespoke Investment Group, the most volatile stocks on earnings include names like Stitch Fix (with an average absolute one-day change of +/-18.62% in reaction to earnings), Pinterest, Snap, and Roku.
Pro Tip: Earnings season generally occurs one to two weeks after the last month of each quarter (December, March, June, September). However, some companies report their earnings based on their own fiscal year instead of the calendar year. That’s why it’s worth creating a watchlist of stocks and the earnings dates ahead of time. Subscribe here, and we’ll help you stay up-to-date.
Of course, there are some clues for investors to look out for pre-earnings. For instance:
Earnings forecasts: Navigating the limitations
Be aware that earnings guidance is only an estimation calculated by the company’s management. And these estimations could prove incorrect. Or the management team may purposefully choose to be conservative or overly confident, depending on the impression they want to give the market.
As a result, a company may end up pre-announcing earnings if it is around 5% outside its stated guidance range. By preparing investors ahead of earnings day, management may hope to soften the blow on shares when the earnings report is actually released.
What’s more, many companies are now refraining from providing forward guidance, citing the uncertainty surrounding the coronavirus pandemic. There can also be other reasons why a company might not offer guidance.
AudioEye, a website accessibility tool, for example, has just pulled full-year guidance. It blamed order uncertainties, saying in its 2Q21 report: “Partnerships and large-scale client conversions… are dependent on external timelines. We still have these growth opportunities, but they are no longer tracking to our calendar year plan.”
This makes it even harder for investors to accurately assess a company’s outlook. Indeed, Maxim Group downgraded AudioEye on the news, “given our slower growth forecast, lack of profitability, and less certain outlook.”

Wall Street’s quarterly earnings forecasts
Luckily analysts offer their own earnings predictions before the big reveal takes place on earnings day, based on everything from previous earnings reports to emerging market trends and consumer surveys.
How do analysts forecast earnings? Every analyst will have their own specific method, but on a general level, they will need to build financial models that calculate potential revenues and costs. This would include metrics like sales volume growth and produce prices, as well as business costs.
Investors can use these analyst estimates, or the analyst consensus (an average of all the analyst estimates), to try and predict how a company performed during the previous quarter. Two of the most important data points tend to be:
Share price reflects market sentiment
A stock records an earnings ‘beat’ or ‘miss’ depending on how its performance measures up to Wall Street’s consensus estimate. This can have a big impact on the share price.
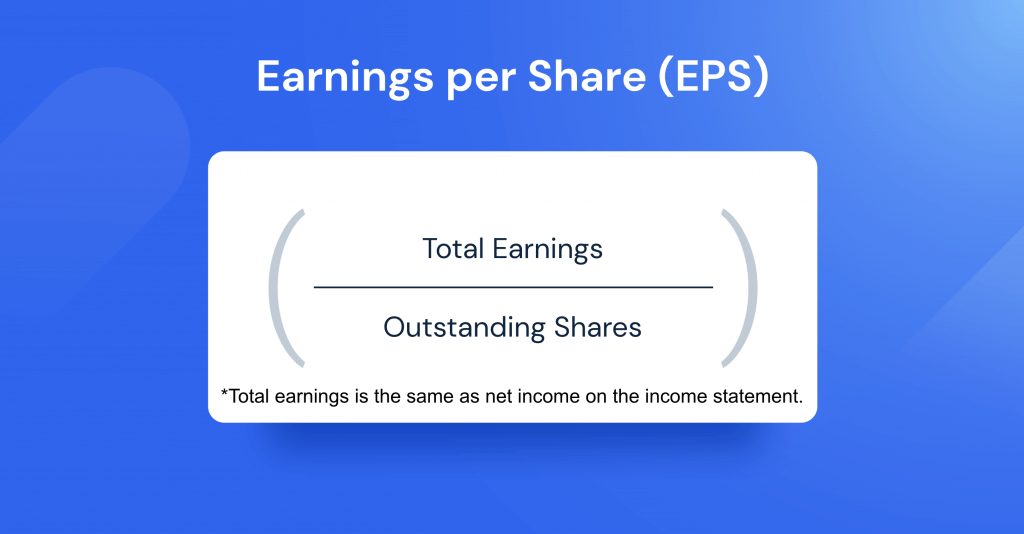
For instance, Snap stock surged 25% on the NYSE on July 23, 2021, after second-quarter earnings smashed analyst expectations. It reported EPS of 10 cents vs. the expected 1 cent loss, while revenue of $982 million easily beat the $846 million Street forecast.
But it’s not always that simple. Sometimes a company can beat both the revenue estimate and the earnings estimate – and the share price can still fall. This is because investors are watching more than just these two headline figures.
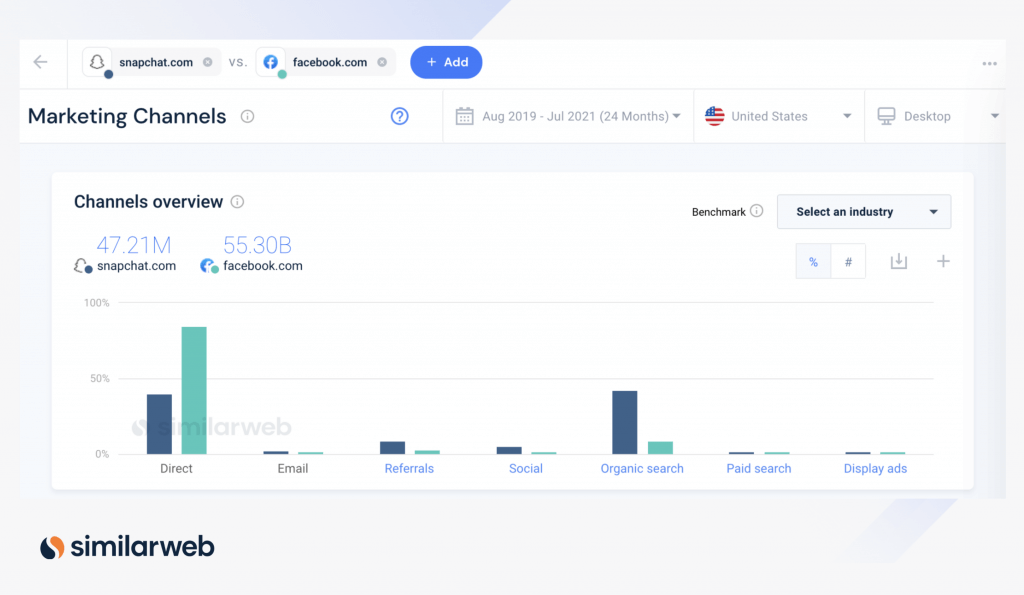
For social media giants, like snapchat.com and facebook.com, for example, daily active users (DAUs) is also a key statistic. So even if revenue and earnings come in strong, investors may still choose to sell because another important data point disappoints.
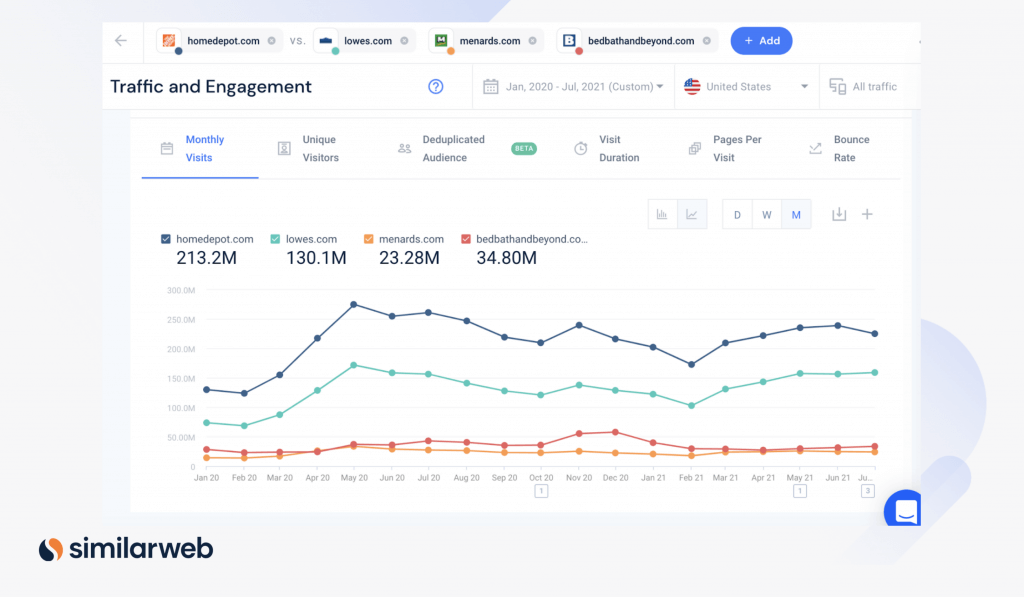
Home Depot (HD) is a case in point. Shares dropped 4% in pre-market trading post-print on August 17, 2021. While HD outperformed on both revenue and earnings, its same-store sales numbers disappointed.
As Oppenheimer’s Brian Nagel told CNBC: “Home improvement was a big Covid winner… But I’ve got to believe that as the economy opens up, as people start to move around again, there’s going to be less of a focus on spending on the home. And that’s what we’re seeing in these numbers now.”
Alternative data for real-time earnings forecasts
This is where alternative data comes in. Alternative data is a very powerful resource for investors trying to decipher a company’s intra-quarter performance before its earnings report is out.
And it is becoming increasingly popular. The global alternative data market was valued at $1.72 billion in 2020 and is expected to expand at a compound annual growth rate (CAGR) of 58.5% from 2021 to 2028.
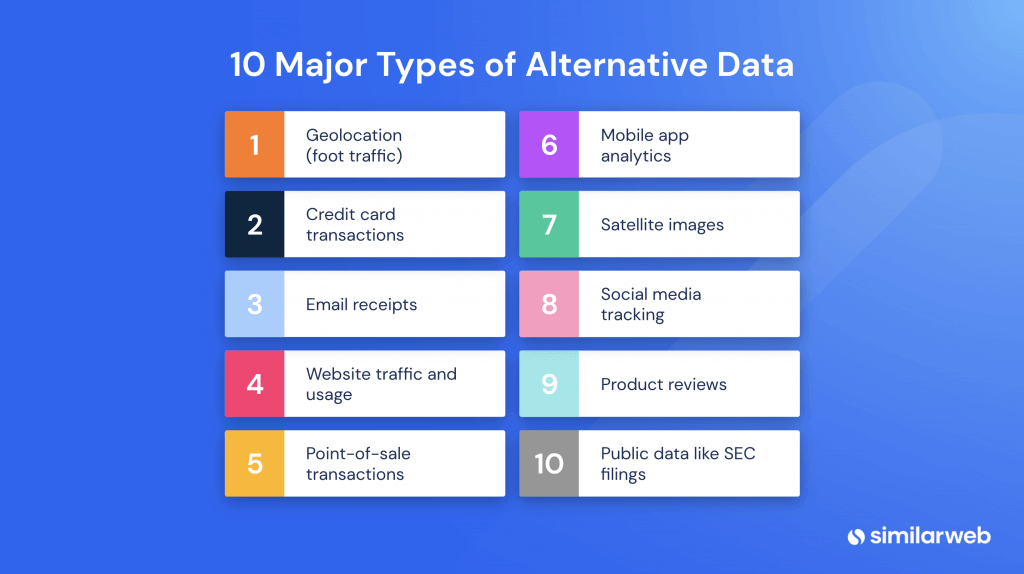
Here alternative data includes everything from social media signals to credit card transaction data to geo-location or satellite data that monitors foot traffic or flight frequency.
Spotlight on digital data
A prominent feature in the alternative data landscape right now is the tracking of key online data points. As COVID-19 accelerated the shift to online, these digital signals can provide critical pre-earnings insights into a company’s digital health.
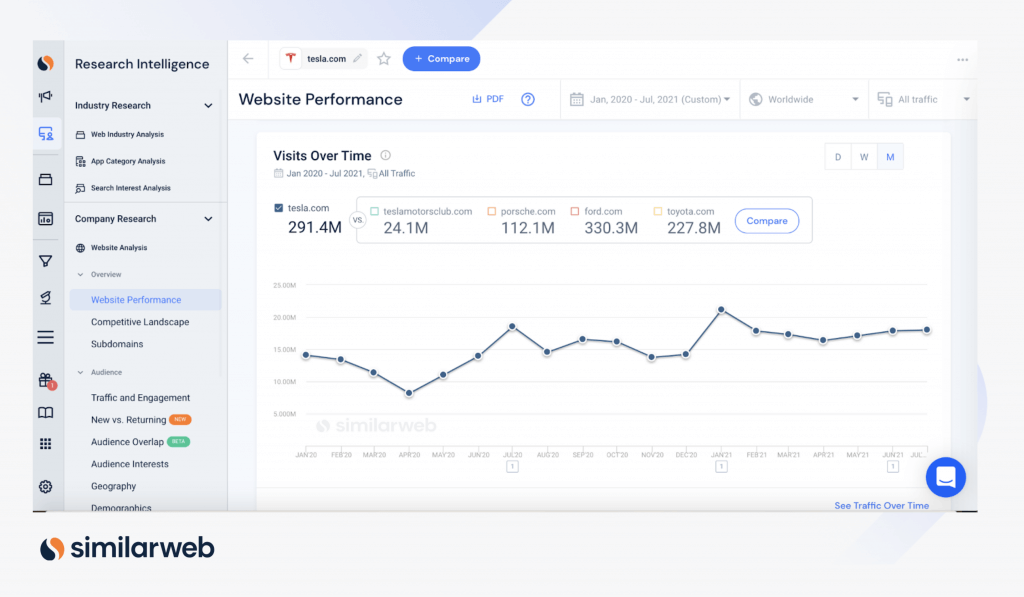
At Similarweb, for example, we track over 100 million websites and 4.7 million apps. The result: we can provide traffic data for every company and industry that has a significant online presence. This enables us to generate valuable insights into key engagement metrics, covering everything from website traffic and eCommerce metrics to conversion rate and audience loyalty.
Investors can use this digital data in conjunction with other sources to get the full picture of how a stock is performing – and how a company’s share price might move post-print.
Facebook ad revenue prompts earnings beat
Take Facebook (FB), which received a notable boost during the pandemic as people rushed online to stay connected. This, in turn, drove a surge in advertiser spending on the social media platform. But how can investors find out if these trends outlasted the pandemic peak?
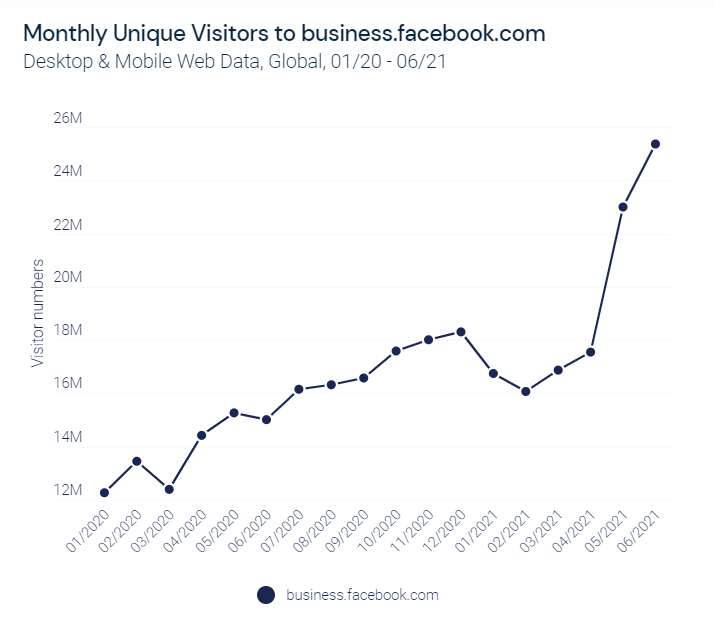
Ahead of FB’s 2Q21 earnings report, we analyzed monthly unique visitors (MUVs) and total visits to the subdomain business.facebook.com, as a proxy for advertiser demand trends.
Similarweb data showed that ad demand remained robust in the second quarter. “Our data shows a notable spike in monthly unique visitors (MUVs) to the subdomain business.facebook.com… on a year-over-year (YoY) basis, unique visitors to this subdomain surged 48%, up from 30% in the first quarter,” we wrote.
Facebook subsequently reported that its ad revenue rose 56% YoY to a total of $28.58 billion in 2Q21. This was driven by a 47% YoY increase in the average price per ad and a 6% increase in the number of ads delivered.
However, FB CFO David Wehner warned that “In the third and fourth quarters of 2021, we expect YoY total revenue growth rates to decelerate significantly on a sequential basis as we lap periods of increasingly strong growth.”
Going forward, we will be able to track in near real-time if and how much Facebook’s ad demand growth decelerates. So watch this space.
Stepping outside earnings season
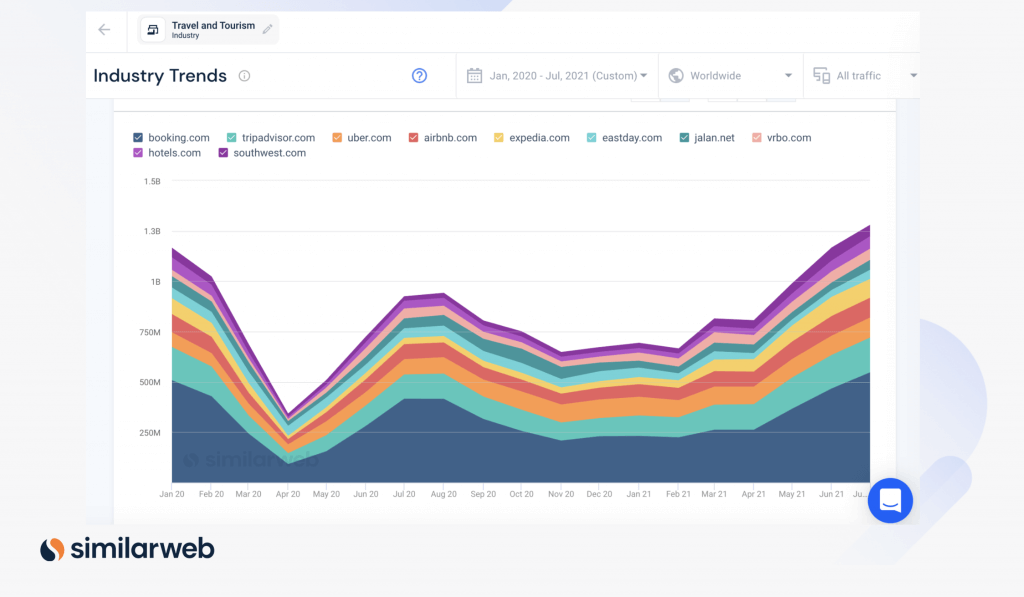
Alternative data can provide valuable competitive analysis into a company’s longer-term trends that may not even surface during earnings season – as well as how a company is performing in comparison to its competitors and the industry as a whole.
It can even provide insights into companies that haven’t even gone public yet, such as controversial Chinese fast-fashion giant Shein. It’s no surprise that, according to Forbes, the Buy-side spent $1.1 billion on alternative data in 2019. And that number is only getting higher.
To learn more about the data behind this article and what Similarweb has to offer, visit https://www.similarweb.com/.


Sign up to receive our stories in your inbox.
Data is changing the speed of business. Investors, Corporations, and Governments are buying new, differentiated data to gain visibility make better decisions. Don't fall behind. Let us help.


Sign up to receive our stories in your inbox.
Data is changing the speed of business. Investors, Corporations, and Governments are buying new, differentiated data to gain visibility make better decisions. Don't fall behind. Let us help.