
Introduction
Welcome to the October Apartment List National Rent Report. Our national index increased by 2.1 percent from August to September. Although month-over-month growth has slowed slightly from its July peak, rents are still growing much faster than the pre-pandemic trend. Since January of this year, the national median rent has increased by a staggering 16.4 percent. To put that in context, rent growth from January to September averaged just 3.4 percent in the pre-pandemic years from 2017-2019.
With rents rising virtually everywhere, only a few cities still remain cheaper than they were pre-pandemic, and even these remaining discounts are unlikely to persist much longer. At the other end of the spectrum, there are now 22 cities among the 100 largest where rents have increased by more than 25 percent since the start of the pandemic. That said, we are seeing some signals that tightness in the market may be beginning to ease. Our vacancy index ticked up this month for the first time since last April. And in Boise, ID, which has seen the nation’s biggest price increase since the start of the pandemic, rents finally dipped slightly this month.
No signs of a seasonal rent dip yet this year
Rents grew by 2.1 percent this month nationally, the second straight month that growth has slowed slightly, after peaking at 2.6 percent in July. While any cooldown in rent growth is a welcome change for renters, it’s important to bear in mind that prior to this year, our national index never increased by more than 0.9 percent in a single month, going back to 2017. Furthermore, we have now entered the time of year when rents are normally declining due to seasonality in the market. In September of 2018 and 2019, for example, rents fell by 0.1 percent and 0.3 percent, respectively.
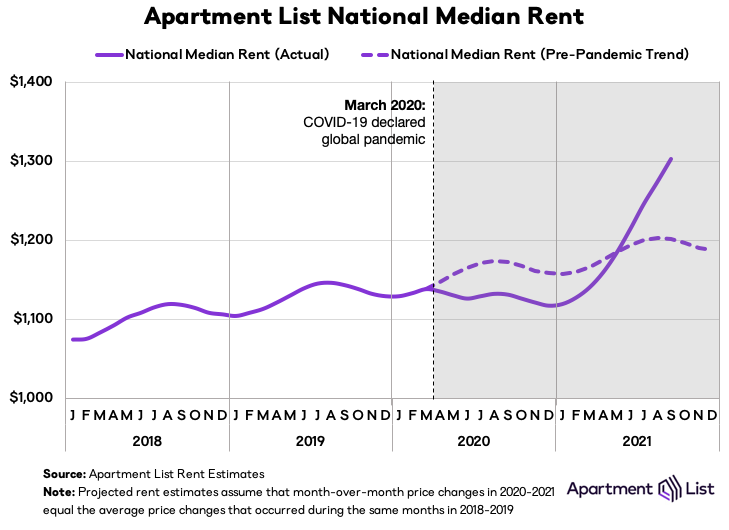
In other words, despite a minor slowdown, rents are continuing to grow at an unprecedented rate. To make this more clear, the chart above plots our national median rent estimate against a projection of pre-pandemic rent growth. The national median rent rose to $1,302 this month, which is $102 greater than where we project it would be if rent growth over the past year and a half had been in line with the growth rates we saw in 2018 and 2019.
Rents still rising everywhere (mostly)
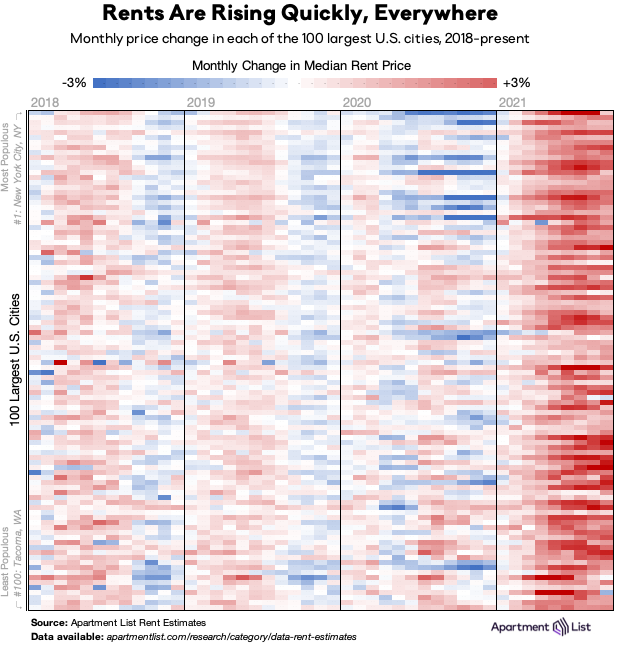
While our national rent index always masks some regional variation, the 2021 rent boom is affecting virtually every major market in the country. This is a big change from 2020, when rents fell precipitously in expensive markets while growing quickly in more-affordable ones. In 2021, rents are rising across the board. The chart below visualizes monthly rent changes in each of the nation’s 100 largest cities from January 2018 to September 2021. The color in each cell represents the extent to which prices went up (red) or down (blue) in a given city in a given month. Bands of dark blue in 2020 represent the large urban centers where rent prices cratered (e.g., New York, San Francisco, Boston), but those bands have quickly turned red as ubiquitous rent growth sweeps the nation in 2021. In 2020, 60 of these cities saw rent prices rise from August to September, but this year, 97 cities got more expensive in September.
Notably, one of the few markets where rents did not increase this month was Boise, ID. Since last March, rents in Boise are up by a staggering 39 percent, making the city the archetype for rental market disruption amid the pandemic. This month, however, the median rent in Boise fell by 0.1%. While such a small dip certainly doesn’t offer much relief to Boise renters, it may at least signal that the market is finally starting to stabilize. Spokane, WA, another city that has experienced skyrocketing rent growth this year, saw an even more notable decline this month, with rents down 1.8 percent.
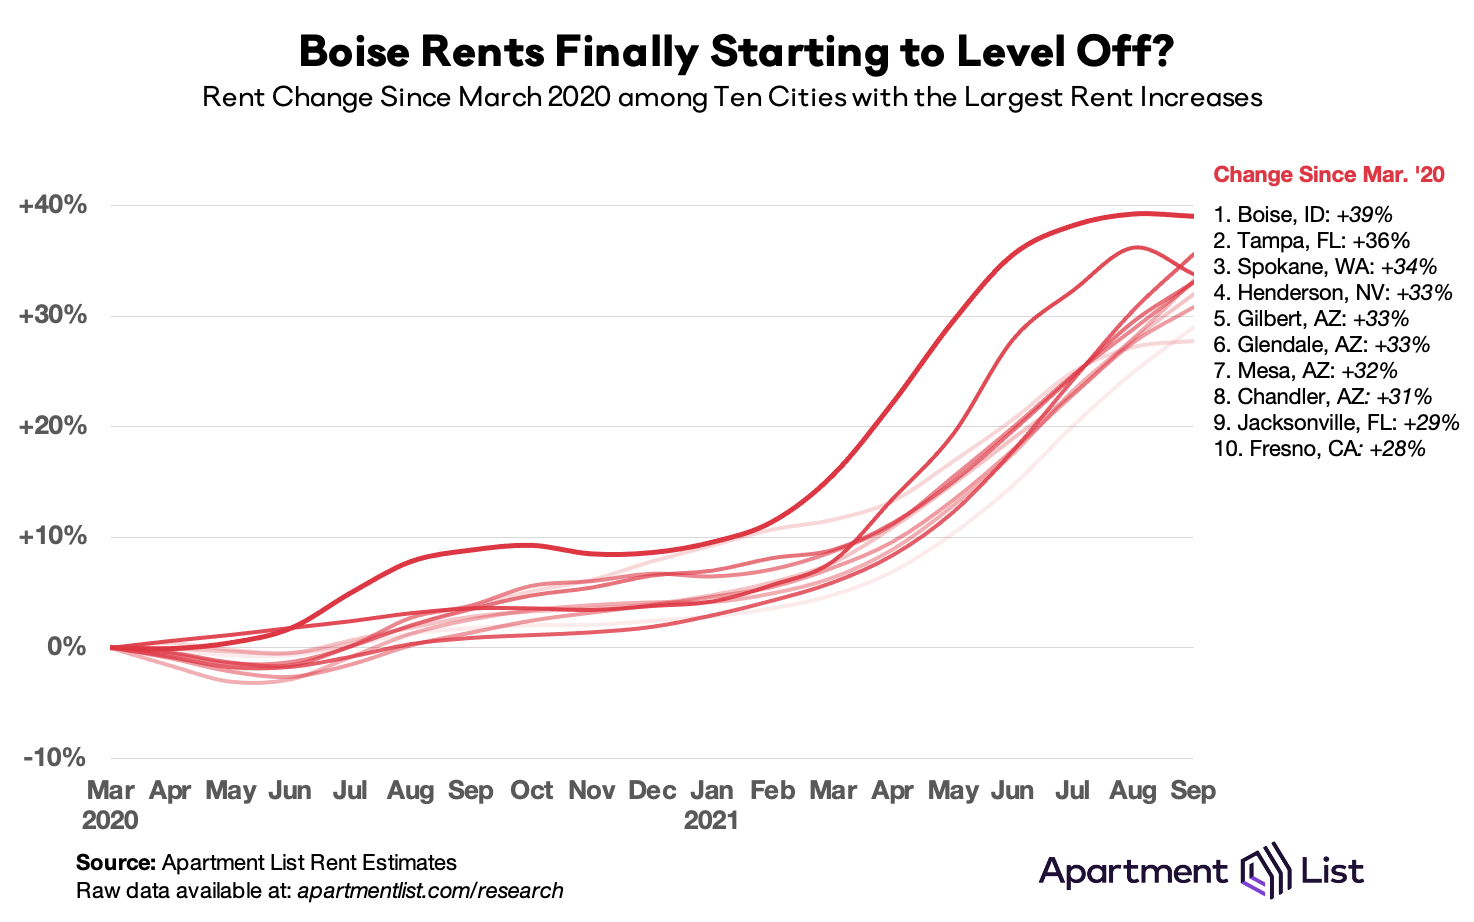
However, Boise and Spokane represent the exception rather than the rule – in most of the cities where rents had been growing quickly, that growth is continuing. Tampa, for example, saw rents jump by another 3.9 percent this month, and the city now ranks 2nd for cumulative rent growth since the start of the pandemic at 36 percent. Excluding Boise and Spokane, the other eight cities in the chart above experienced rent growth of 3.5 percent, on average, from August to September, as affordable Sunbelt markets continue to boom. Of particular note, four of the ten cities with the fastest rent growth since last March are suburbs of Phoenix.
In many of these markets the pandemic did not start a new trend, so much as accelerate an existing one. For example, from 2017 through 2019, rents in Mesa, AZ increased 25.5 percent, the fastest growth in the nation over that period. Similarly, Fresno, CA ranked third for fastest rent growth, while Chandler, AZ ranked sixth. Affordability in these markets was waning even before the pandemic spurred new demand. Looking ahead, the pandemic will only worsen supply shortages and affordability concerns unless the cities on this list develop robust plans for building enough homes to absorb incoming demand.
Only 5 cities still have rents discounted from pre-pandemic levels
After another month of rising prices, pandemic-era rent discounts are closer to becoming a thing of the past. In Seattle, for example, rents fell by 22 percent from March 2020 through January 2021. However, rents in Seattle have since rebounded strongly, and this month’s 2.5 percent increase has officially put the city’s median rent above its March 2020 level.
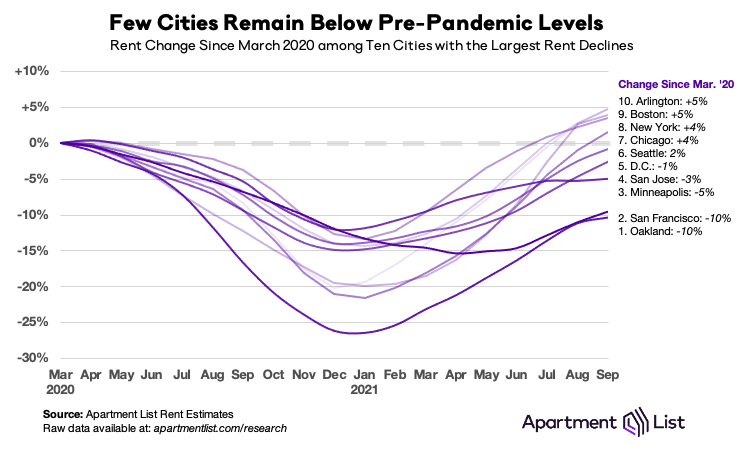
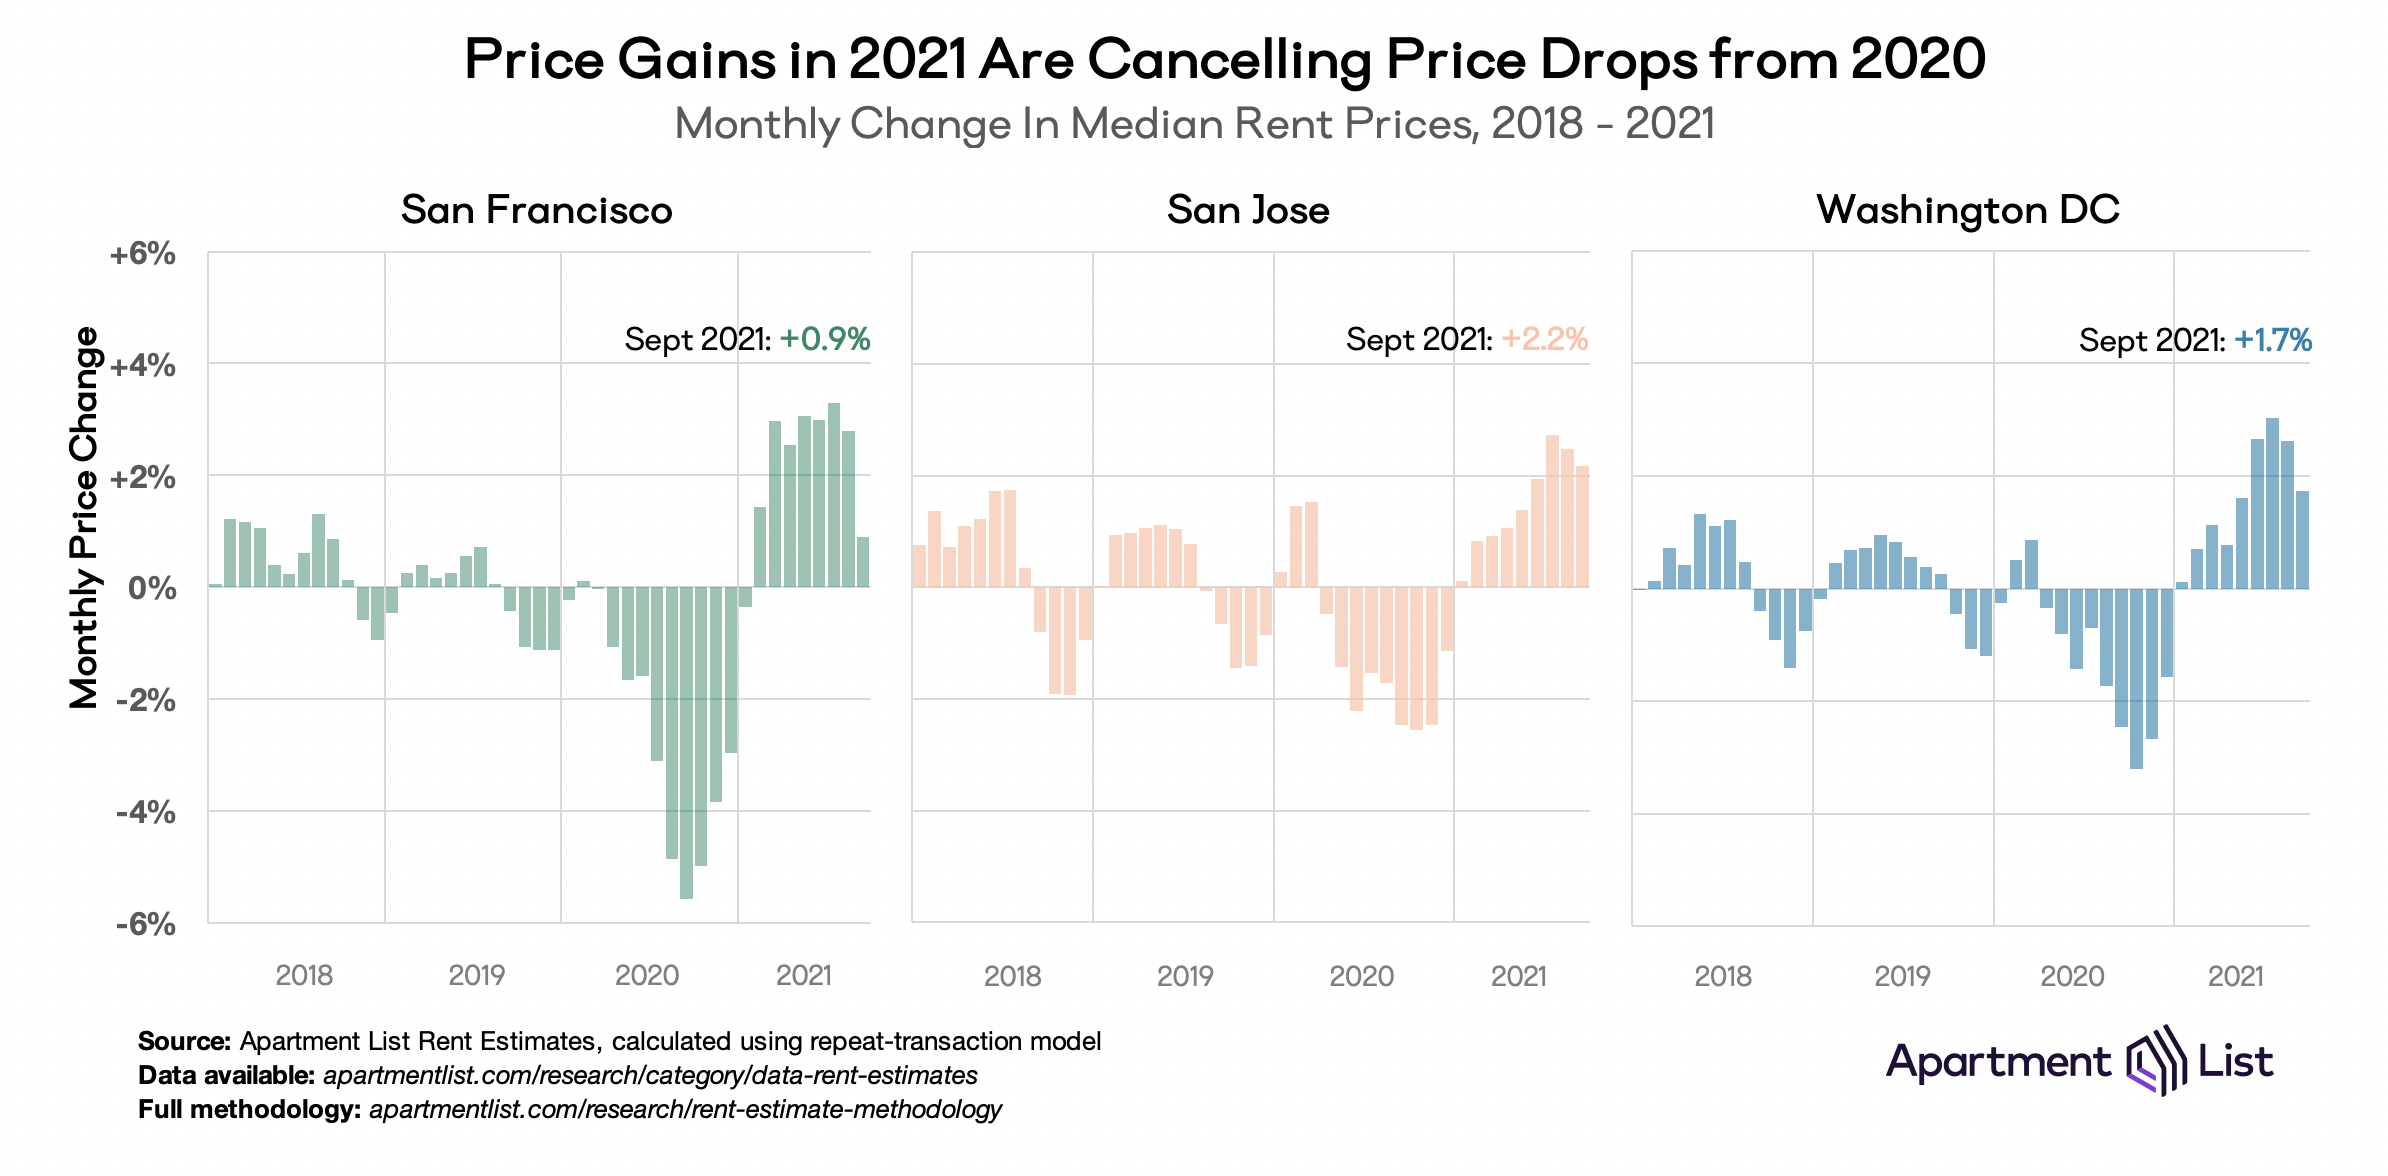
That means that today, “pandemic pricing” is over in most of the country. Rents fell from March through December of last year in 46 of the nation’s 100 largest cities. However, rents remain below pre-pandemic levels in just 5 large cities: three California cities in the San Francisco Bay Area (i.e, San Francisco, Oakland, and San Jose); Minneapolis, MN; and Washington, DC. The chart below visualizes the rapid rent drops and rebounds in each of these places. Oakland and San Francisco consistently made headlines throughout the pandemic for staggering rent drops and today are the only two cities retaining double-digit price reductions. The remainder should be back to pre-pandemic prices before too long.
These COVID-era price fluctuations – down quickly at the start of the pandemic, up quickly since the start of 2021 – are significantly more volatile than the seasonal price fluctuations we normally see in these markets. The chart below shows month-over-month price changes from 2018 to September 2021 in San Francisco, San Jose, and Washington DC, three of only five cities where today’s prices remain below pre-pandemic levels. Monthly rent changes of +/- 2 percent were nonexistent in the years preceding the pandemic, but in 2020 and 2021 we have seen extended stretches where local prices rise and fall at that rate.
Vacancy rate rises for first time since last April
As we’ve explored in detail, much of this year’s boom in rent prices can be attributed to a tight market in which more and more households are competing for fewer and fewer vacant units. Our vacancy index spiked from 6.2 percent to 7.1 percent last April, as many Americans moved in with family or friends amid the uncertainty and economic disruption of the pandemic’s onset. Since then, however, vacancies have been steadily declining. For the past several months, our vacancy index has been hovering just below 4 percent, significantly lower than the 6 percent rate that was typical pre-pandemic.
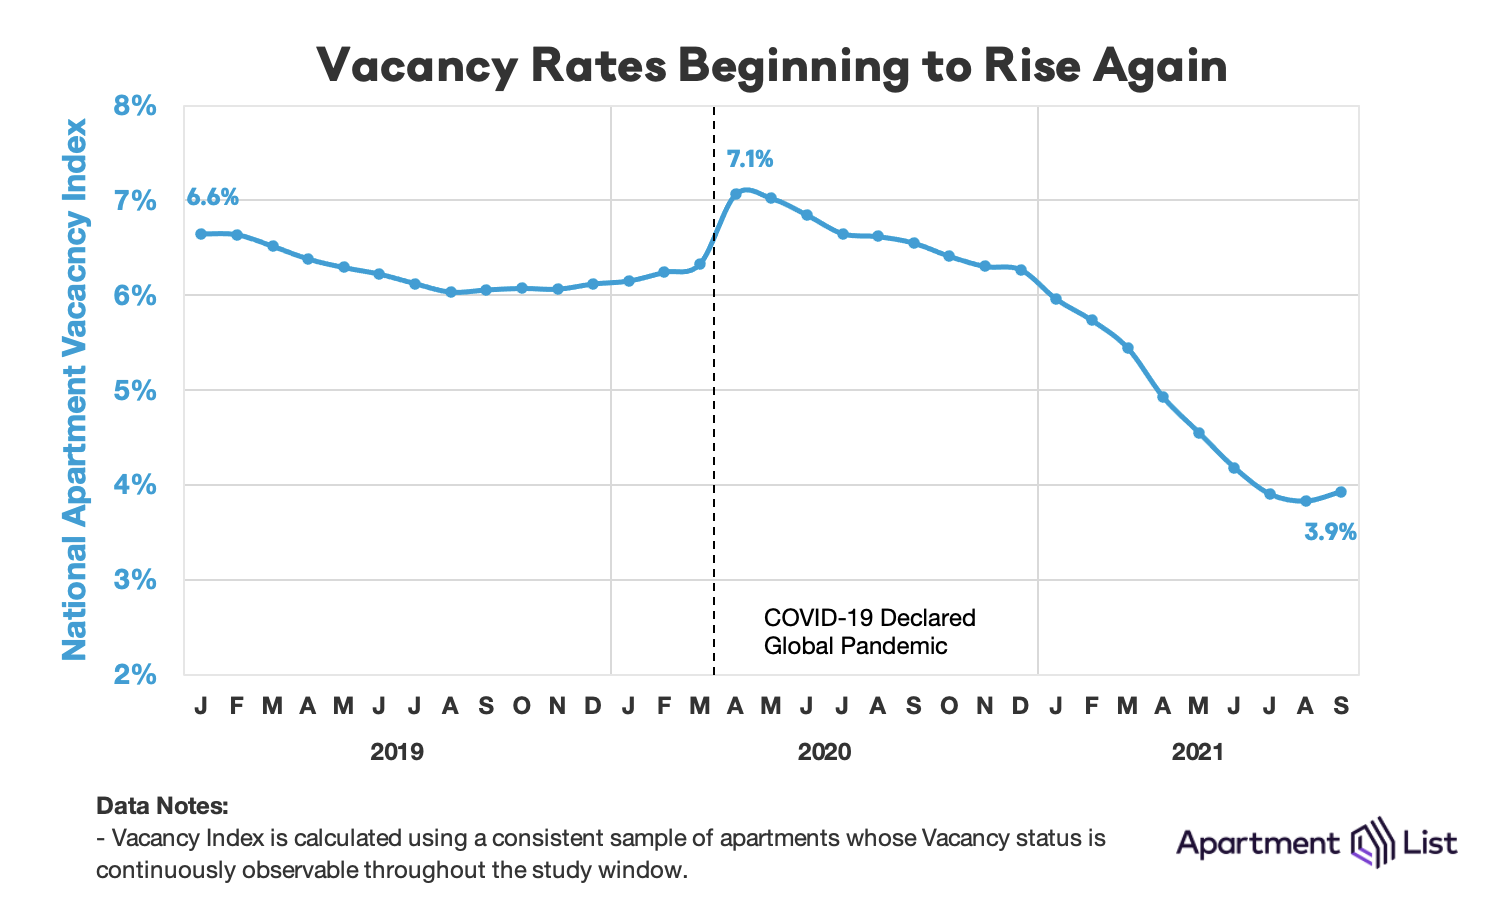
This month, however, our vacancy index ticked up slightly, from 3.8 percent to 3.9 percent. Although this is a very minor increase, it represents the first increase of any magnitude since last April. We’ll need to see more data to confirm if this trend will continue, but if vacancies are back on the rise again, it would signal that tightness in the rental market is finally beginning to ease. If our vacancy rate continues to increase in the coming months, it’s likely that rent growth will also continue to cool.
Conclusion
Although the pandemic created some softness in the rental market last year, 2021 has brought the fastest rent growth we have on record in our data. Nationally, and in nearly all individual cities across the country, rent growth in 2021 has exceeded average growth rates from pre-pandemic years. As prices rebound rapidly even in the cities that saw the sharpest declines last year, there are now just five cities remaining where rents have yet to surpass pre-pandemic levels.
At the same time, booming markets across the Mountain West, Sun Belt, and Southeastern United States continue to see rent prices grow. As we enter the time of year when rents normally exhibit a seasonal dip, growth has slowed only slightly and remains on a record-setting pace. That said, certain markets, such as Boise, ID and Spokane, WA, appear to be cooling off. And more broadly, our national vacancy index has ticked up for the first time since the start of the pandemic. While the market remains extremely tight, we’re now seeing the first signals of that pressure beginning to ease.
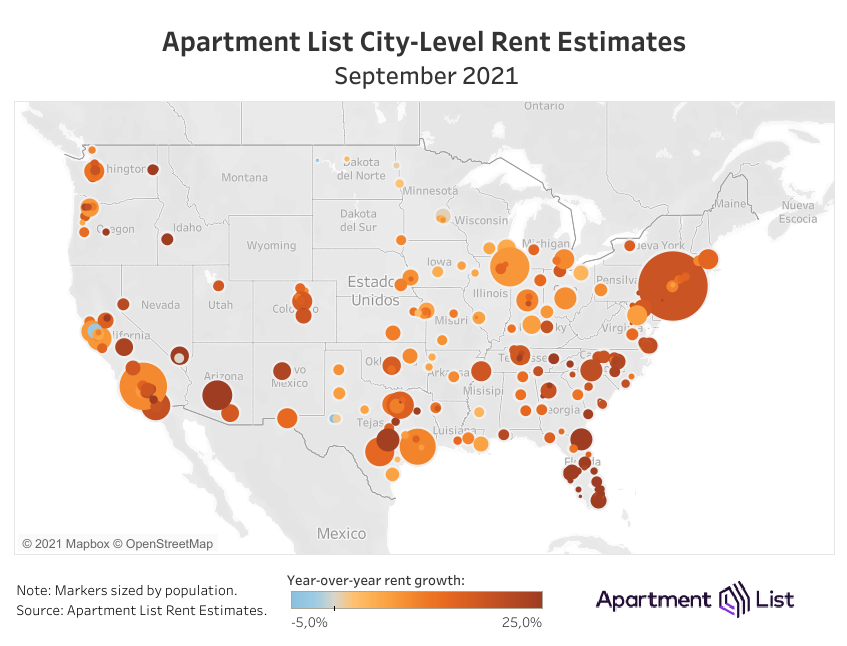
For complete data, explore the interactive map below or head over to our rental data page, where you can download the most recent estimates for your city, as well as historic data going back to 2017. And as always, feel free to contact us with any questions!
To learn more about the data behind this article and what Apartment List has to offer, visit https://www.apartmentlist.com/.


Sign up to receive our stories in your inbox.
Data is changing the speed of business. Investors, Corporations, and Governments are buying new, differentiated data to gain visibility make better decisions. Don't fall behind. Let us help.


Sign up to receive our stories in your inbox.
Data is changing the speed of business. Investors, Corporations, and Governments are buying new, differentiated data to gain visibility make better decisions. Don't fall behind. Let us help.