Week ending 2 October
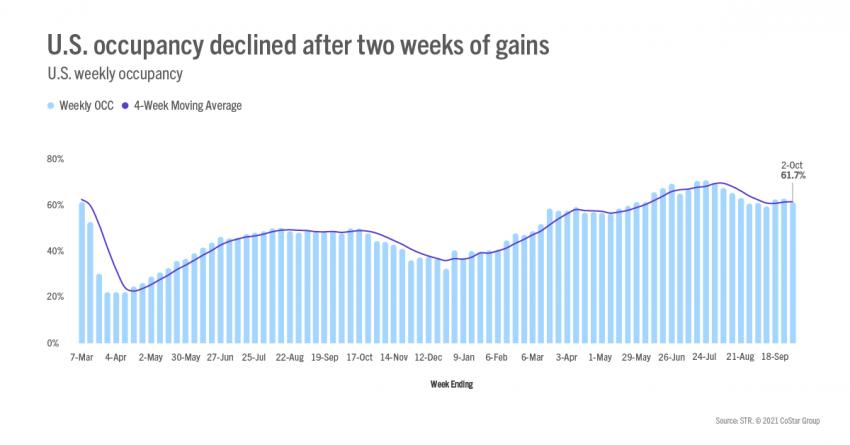
U.S. hotel industry demand retreated in the latest week of reporting (26 September-2 October), failing to align with a rise in TSA security screenings. Normally, we expect an uptick in air passengers to yield an increase in hotel demand. This week was an exception with occupancy slipping 1.5 percentage points to 61.7%. Both weekday and weekend demand sank with 27% of the week’s demand loss occurring on Thursday. On a total-room-inventory (TRI) basis, which accounts for temporarily closed hotels, weekly occupancy was 59.4%. A little more than 48,000 rooms remain temporarily closed, mostly in New York City, Orlando, and San Francisco.
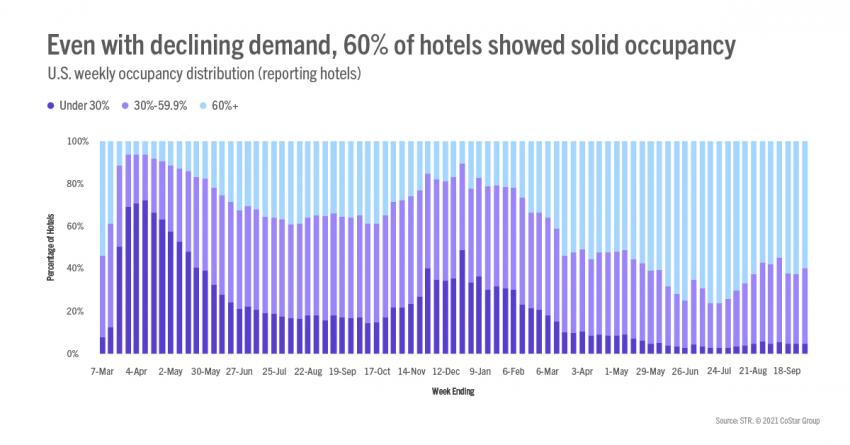
Weekly demand declined the most among hotel types that have traditionally served business and conference guests: Upper Upscale, Upscale and Upper Midscale. These three chain scales accounted for 71% of the weekly demand loss among reporting hotels. In previous weeks, hotels of this profile were the primary benefactors of the industry’s demand growth. Group demand, which had previously risen for six consecutive weeks, fell 8% from the previous week. Overall, 56% of all U.S. hotels in the STR reporting universe saw demand fall during the week, with hotels selling 15 less rooms on average versus the week prior.
Among STR-defined markets, 66% saw a withdrawal of demand. The decline was most noticeable in the country’s largest markets, including New York City, Chicago, Orlando, San Diego, and Seattle. Previously, New York City had seen demand top 500,000 for three consecutive weeks, which was the market’s best run since the pandemic’s start. Among week-over-week demand gainers, Atlanta and San Francisco saw the largest advances.
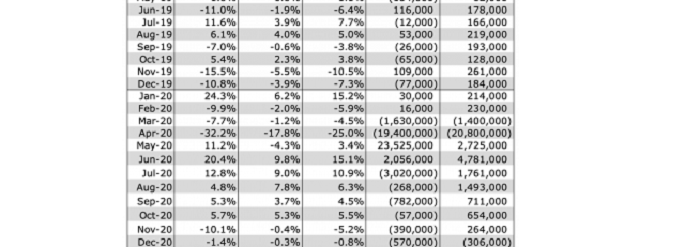
The week-over-week demand decline was the second of the past five weeks and the largest since the week before the Labor Day holiday. As anticipated, and despite the overall decrease, the 2019 demand index rose on easy comparisons due to the 2019 observance of Rosh Hashanah. For the month of September, we estimate that the industry sold 93% of the comparable 2019 room volume, which was up from 90% in August.
The week’s decline was similar to what happens to occupancy ahead of a holiday weekend: occupancy falls progressively more each day up to the weekend. But last week’s decrease was not adjacent to any holiday as the Columbus Day holiday was more than a week away. The only calendar event we noticed was the beginning of fall school breaks, but those too will culminate during the Columbus Day holiday week with at peak 22% of students on break. This past week only 2%-5% of students were off.
Average daily rate (ADR) also decreased, falling 2.3%, which was the second decline of the past five weeks and the largest in that period. Top 25 Markets saw the largest ADR tumble (-3.5%) whereas the remaining markets were down 1.5%. Weekday and weekend ADR declined by roughly the same amount on an industry basis. However, the Top 25 Markets saw a sharp reduction in weekday ADR, plunging 4.5% with the largest decreases coming early in the week.
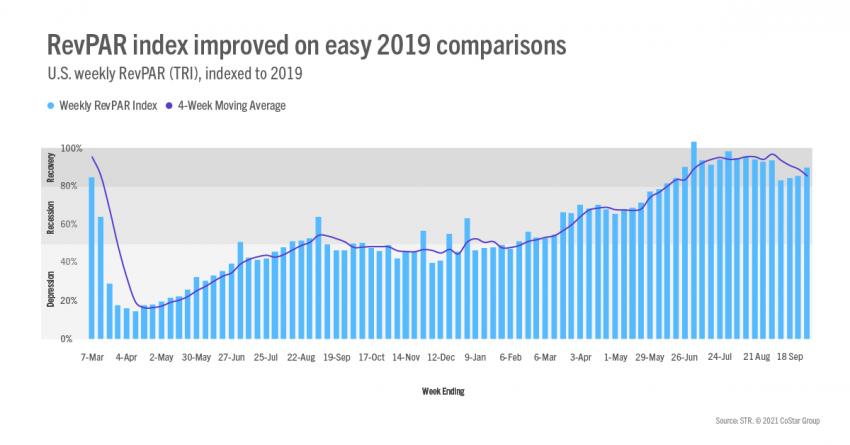
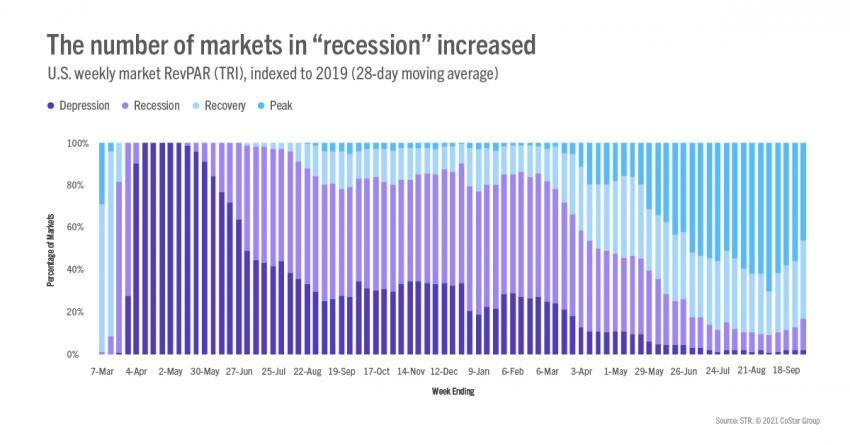
Weekly TRI revenue per available room (RevPAR) indexed to 2019 increased in the week even as RevPAR declined 4.9% on an absolute basis. Again, that’s because of the easy comparisons due to Rosh Hashanah falling during the corresponding week in 2019. Taking the 2019 observance into account, we estimate the RevPAR index would have remained in STR’s “recovery” category (TRI RevPAR indexed to 2019 between 80 and 100) as it had in the prior 16 weeks. On a 28-day moving total basis, the index continued to weaken from its summer highs, down to 85 from 89 in the prior week. The percentage of STR-defined markets at “peak” (TRI RevPAR indexed to 2019 above 100) also declined to 46% from 56% a week prior. Thirty-seven percent were in “recovery” and 15% were in “recession” (TRI RevPAR indexed to 2019 between 50 and 80). The percentage of markets in “recession” was the most of the past 14 weeks. Three markets remained in “depression” (TRI RevPAR indexed to 2019 under 50) with that category still topped by San Francisco, where TRI RevPAR was only 34% of its 2019 level.
Weekly TRI revenue per available room (RevPAR) indexed to 2019 increased in the week even as RevPAR declined 4.9% on an absolute basis. Again, that’s because of the easy comparisons due to Rosh Hashanah falling during the corresponding week in 2019. Taking the 2019 observance into account, we estimate the RevPAR index would have remained in STR’s “recovery” category (TRI RevPAR indexed to 2019 between 80 and 100) as it had in the prior 16 weeks. On a 28-day moving total basis, the index continued to weaken from its summer highs, down to 85 from 89 in the prior week. The percentage of STR-defined markets at “peak” (TRI RevPAR indexed to 2019 above 100) also declined to 46% from 56% a week prior. Thirty-seven percent were in “recovery” and 15% were in “recession” (TRI RevPAR indexed to 2019 between 50 and 80). The percentage of markets in “recession” was the most of the past 14 weeks. Three markets remained in “depression” (TRI RevPAR indexed to 2019 under 50) with that category still topped by San Francisco, where TRI RevPAR was only 34% of its 2019 level.
Outside the U.S.
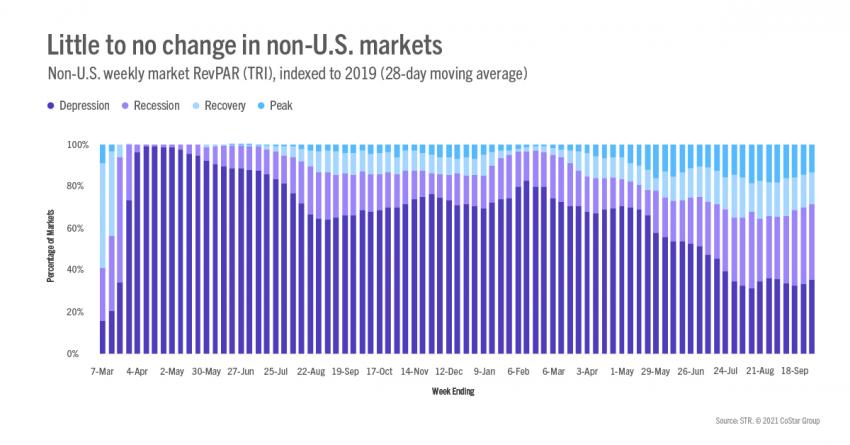
Occupancy also fell to a four-week low outside the U.S., dropping 2.9 percentage points to 41% among the 104 countries tracked weekly. All but one of the 10 largest countries based on supply saw occupancy fall in the week. U.K. occupancy dropped five percentage points to 63%, which still was the highest occupancy among the top 10. Germany and Canada each reported weekly occupancy above 50%. China saw its occupancy fall for a second consecutive week to a four-week low (39%) as nearly all markets reported a decline in demand. Three markets (Shanghai, Beijing, and Jiangsu) accounted for nearly 30% of the demand decrease among declining markets. Seventy-seven percent of China’s markets were either in “recession” or “depression” on a 28-day moving total basis, which is nearly identical to the percentage of all non-U.S. markets.
Big Picture
We were surprised with the decline in performance this week. Most likely, it’s just the normal ebb and flow of the industry that in past years would not raise any red flags, but this is not a normal year, especially as we are keeping such a close eye on business travel and group indicators. This is a reminder that we can and should expect more ups and downs as the recovery continues. The good news is that even with this week’s decrease, demand has remained above 23 million for the past 19 weeks. And, while we were reminded that TSA screenings are not always a predictor of hotel demand movement (they are 75% of the time), screenings were up again at the time of writing on Wednesday, 6 October. Hopefully this time there is a correlation with hotel demand.
To learn more about the data behind this article and what STR has to offer, visit https://str.com/.


Sign up to receive our stories in your inbox.
Data is changing the speed of business. Investors, Corporations, and Governments are buying new, differentiated data to gain visibility make better decisions. Don't fall behind. Let us help.


Sign up to receive our stories in your inbox.
Data is changing the speed of business. Investors, Corporations, and Governments are buying new, differentiated data to gain visibility make better decisions. Don't fall behind. Let us help.