
Week ending 16 October
The Columbus Day holiday propelled U.S. occupancy to 65.0% for the week ending 16 October. That level was the country’s highest since mid-August and surpassed the levels seen during the weeks of Memorial Day and Labor Day. This was also the 11th week since June that occupancy reached or surpassed 65%. The week-on-week gain in demand came almost entirely from Sunday with other weekdays providing much less improvement. Weekend occupancy declined for the second time in the past three weeks but occupancy remained strong at 78%, which was the second highest of the past 11 weeks. U.S. total-room-inventory (TRI) occupancy was 62.8% as 44,000 rooms remain temporarily closed.
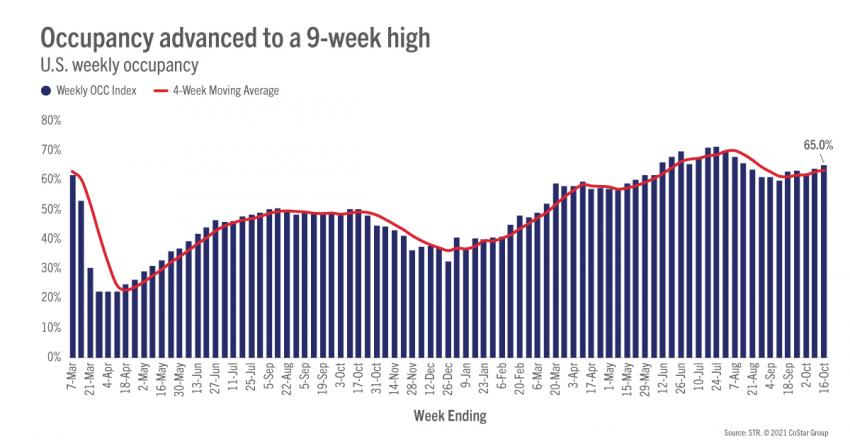
Occupancy for the 3-day holiday weekend (8-10 October) reached 72% as compared with 75% in 2019. Demand after the holiday was much less given nascent business travel and limited conferences. On average, demand was 85% of 2019 levels in the days after Columbus Day, increasing to 99% of 2019’s volume by the weekend. Occupancy over the holiday weekend ranged from 95% in Gatlinburg/Pigeon Forge, TN to 52% in Oahu. Overall, 58% of all STR-defined markets reported occupancy above 70% during the holiday weekend.
For the full week, demand gainers included Washington, D.C., and Orlando. The biggest demand declines during week were reported by Colorado Area, Albuquerque, and Chicago. New York City occupancy increased by 1.6 percentage points to 67%. NYC’s midweek demand, Tuesday through Thursday, was the second highest since the start of the pandemic with occupancy at 63%. Weekend demand for the city was also its second highest of the pandemic-era, behind only the Friday and Saturday of the Columbus Day holiday weekend (79%).
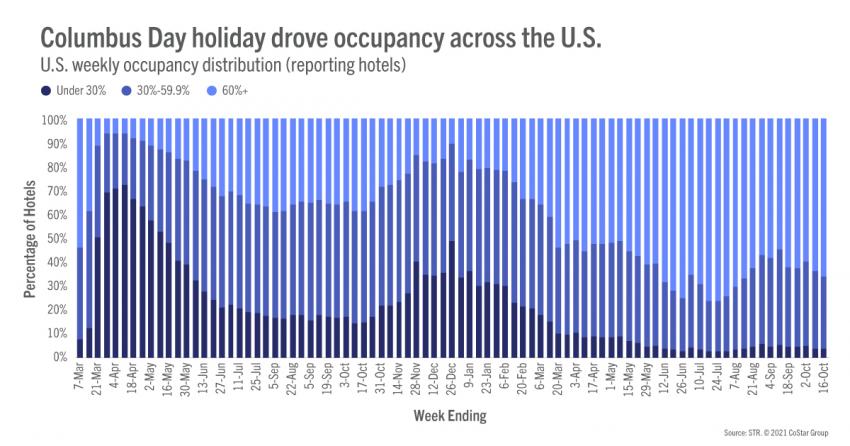
Across the U.S., 66% of reporting hotels saw weekly occupancy above 60%. Midweek occupancy was 61%, which was the highest level of the past eight weeks as 58% of hotels saw occupancy above 60% during those days. Weekend occupancy fell to 78% from 79% in the previous week with 84% of hotels seeing occupancy above 60%. Over the last two weeks of reporting, 40+% of hotels saw weekend occupancy at or above 90%, which last occurred during July. Both weekly demand and occupancy indexed to 2019 fell for a second consecutive week, remaining above 90, meaning this week’s demand and occupancy were 10% below those metrics in the comparable week of 2019.
Not surprising given the holiday, group demand fell during the week, but the week-on-week decrease was not large at -1.3% for Tuesday through Thursday. Midweek group demand for Luxury and Upper Upscale hotels has been above 400,000 in three of the past four weeks, including the last two.
While demand was on the rise week over week, average daily rate (ADR) stepped back 0.5%—the second decline of the past three weeks. This week’s decrease was due entirely to a 3.6% decline on the weekend, as weekday ADR was up 2%, mostly from growth on Sunday of the holiday weekend. The Top 25 Markets saw weekday ADR increase 3.1% for the week versus 1.1% for all other markets. Weekend ADR decreased by roughly the same amount for both market types. Overall, weekly ADR indexed below 2019 levels for the first time in three weeks with real ADR (inflation-adjusted) 7% below 2019. However, during the holiday weekend, ADR was 8% higher as compared with the 2019 Columbus Day holiday weekend with real ADR 2% higher.
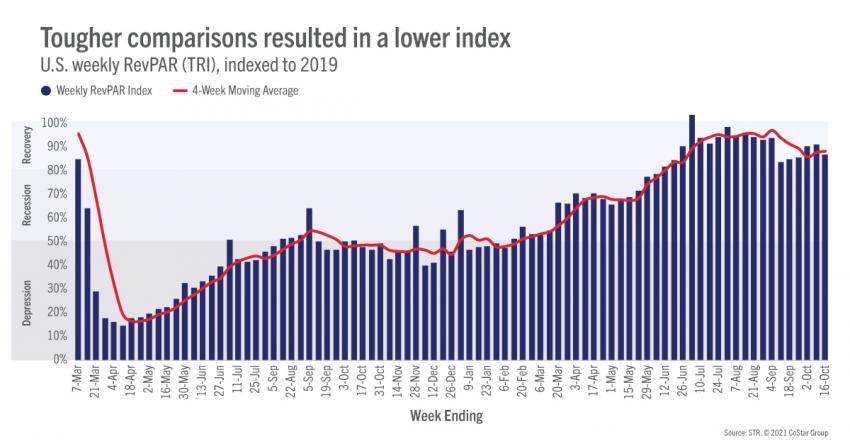
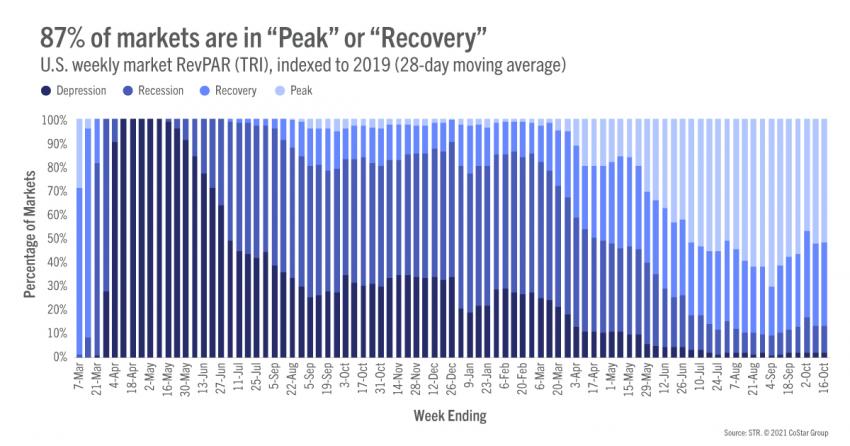
TRI revenue per available room (RevPAR) increased 1.1% from the previous week. Indexed to 2019, TRI RevPAR fell from 90 to 86. Even with the decrease, TRI RevPAR stayed in STR’s “recovery” category (TRI RevPAR indexed to 2019 between 80 and 100) for a 19th consecutive week. On a 28-day moving average, TRI RevPAR indexed to 2019 was 88, down slightly from the previous week. The number of markets in the various RevPAR categories also didn’t see much change week to week: 86 in “peak” (TRI RevPAR indexed to 2019 above 100), 58 in “recovery,” 19 in “recession” (TRI RevPAR indexed to 2019 between 50 and 80), and three in “depression” (TRI RevPAR indexed to 2019 below 50).
Outside the U.S.
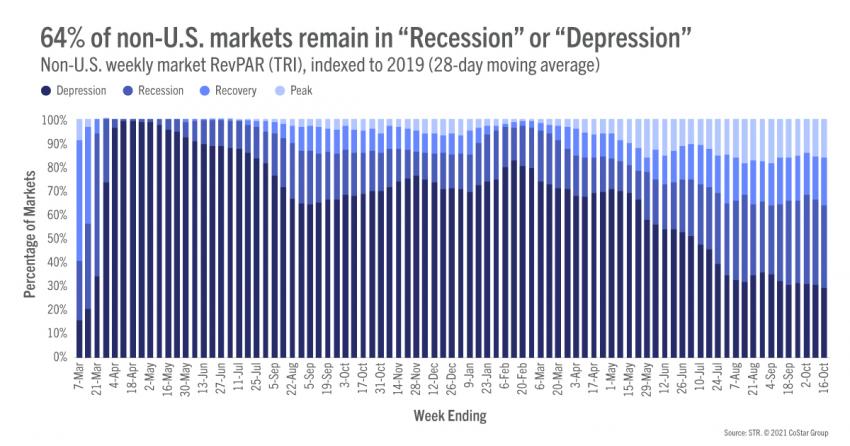
After two weeks of declines, TRI occupancy outside the U.S. rose 1.3 percentage points to 44.4%, but ADR fell 4%. Overall, ADR has fallen in six of the past seven weeks. Stronger occupancy growth was seen among the 10 largest countries (by hotel supply) but was accompanied by a sharper ADR decrease led by China, due a week-on-week comparison with the “Golden Week” holiday. Nearly a third of non-U.S. markets remain in the “depression” category with 34% in “recession.” Both categories have shown little change in weeks.
After the “Golden Week” holiday, which also provided the opportunity for additional annual leave, TRI occupancy for Mainland China increased substantially (6 pts) from last week to 51.6%. That level was still 23 percentage points down from 2019. Most of China’s markets remain behind 2019 levels but showed significant growth week over week—notably Shenzhen, Beijing and Tianjin. Sanya, Hainan, and Yunnan were among the markets that were down in the week—post holiday declines. While ADR fell week over week, most markets remain ahead of 2019 levels. Hong Kong continued to struggle as the border remains closed with Mainland China, and the market doesn’t have travel “bubbles” with other countries. Local hoteliers indicate that demand comes mainly from staycations, which hasn’t been as strong as in Mainland China.
U.K. TRI occupancy advanced to 63.8%, which was the highest level of the top 10 countries. London saw higher growth week on week (2 percentage points) versus. Regional UK which was flat. However, last week saw London sitting 26% behind 2019 levels, while Regional UK sits just 9% behind. This trend was seen across most major cities, although, based on Forward STAR data, cities may start to catch up. U.K. ADR dipped 1.4% week on week but sits just 1% behind 2019 levels. All markets, except London, showed weekly ADR ahead of 2019 levels. While London remains 9% behind 2019 levels, the market posted a 6% increase week on week. Regional U.K. saw a slight week-over-week decline (-1%) but remains 11% ahead of 2019 levels. Looking ahead, half-term begins 22 October, which will boost regional destinations (e.g. Gloucestershire).
Occupancy in Canada continued to trend down to 47%. That was Canada’s fourth straight weekly decrease. Among Canada’s large markets, Quebec saw the largest occupancy decrease, down four percentage points week on week. Montreal saw a modest occupancy decline (-1.2 percentage points) whereas Toronto was up by a similar amount. Canada’s ADR also fell (-1.5%) with the largest market-level decrease in Alberta.
Big Picture
The Columbus Day holiday drove most of the week’s performance in the U.S. but the modest midweek gains were a pleasant surprise. However, it is premature to conclude that we will continue to see midweek gains in the upcoming week (ending 23 October), as that week in 2019 produced a sharp demand decrease. Current TSA screening trends are also pointing to a slower week. With Halloween falling on a Sunday this year, we might see an uptick in the week ending 30 October. While ups and downs will continue for a while, the industry is in a much better place than it was earlier this year, and the outlook appears to be getting brighter.
To learn more about the data behind this article and what STR has to offer, visit https://str.com/.


Sign up to receive our stories in your inbox.
Data is changing the speed of business. Investors, Corporations, and Governments are buying new, differentiated data to gain visibility make better decisions. Don't fall behind. Let us help.


Sign up to receive our stories in your inbox.
Data is changing the speed of business. Investors, Corporations, and Governments are buying new, differentiated data to gain visibility make better decisions. Don't fall behind. Let us help.