
Through September 2021 with Forecasts from September 2022
Introduction
The CoreLogic Home Price Insights report features an interactive view of our Home Price Index product with analysis through September 2021 with forecasts from September 2022.
CoreLogic HPI™ is designed to provide an early indication of home price trends. The indexes are fully revised with each release and employ techniques to signal turning points sooner. CoreLogic HPI Forecasts™ (with a 30-year forecast horizon), project CoreLogic HPI levels for two tiers—Single-Family Combined (both Attached and Detached) and Single-Family Combined excluding distressed sales.
The report is published monthly with coverage at the national, state and Core Based Statistical Area (CBSA)/Metro level and includes home price indices (including distressed sale); home price forecast and market condition indicators. The data incorporates more than 40 years of repeat-sales transactions for analyzing home price trends.
HPI National Change
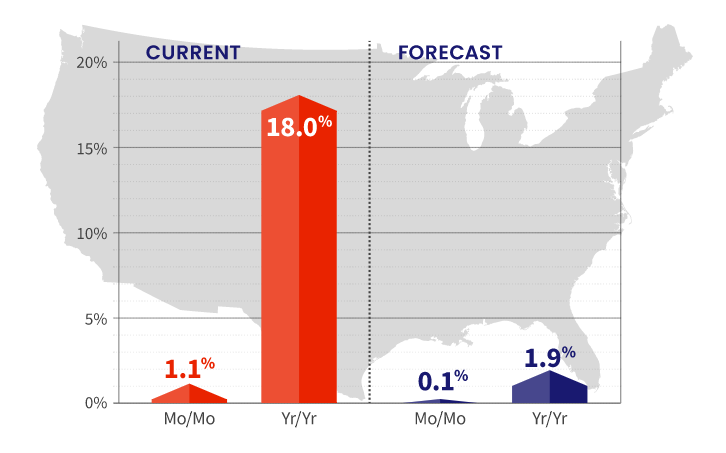
September 2021 National Home Prices
Home prices nationwide, including distressed sales, increased year over year by 18% in September 2021 compared with September 2020. On a month-over-month basis, home prices increased by 1.1% in September 2021 compared with August 2021 (revisions with public records data are standard, and to ensure accuracy, CoreLogic incorporates the newly released public data to provide updated results).
Forecast Prices Nationally
The CoreLogic HPI Forecast indicates that home prices will increase on a month-over-month basis by 0.1% from September 2021 to October 2021, and on a year-over-year basis by 1.9% from September 2021 to September 2022.
“The pandemic led prospective buyers to seek detached homes in communities with lower population density, such as suburbs and exurbs. As we head into 2022, we expect some moderation in the current pattern of flight away from urban cores as the pandemic wanes.”
-Frank Martell
President and CEO of CoreLogic
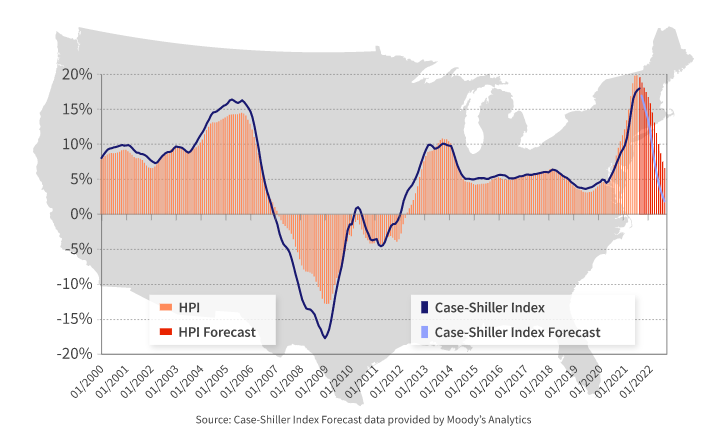
HPI & Case-Shiller Trends
This graph shows a comparison of the national year-over-year percent change for the CoreLogic HPI and CoreLogic Case-Shiller Index from 2000 to present month with forecasts one year into the future. We note that both the CoreLogic HPI Single Family Combined tier and the CoreLogic Case-Shiller Index are posting positive, but moderating year-over-year percent changes, and forecasting gains for the next year.
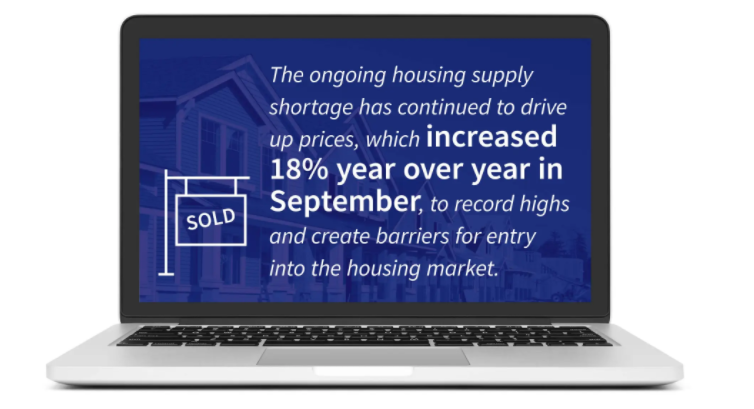
Economic Impact on Home Prices
Demand for homebuying remained strong through the end of the summer. However, the ongoing housing supply shortage has continued to drive up prices, which increased 18% year over year in September, to record highs creating additional challenges for entry into the homebuying market. High demand and low supply levels for entry-level homes, in particular, are sidelining many would-be first-time buyers.
As millennials continue to make up a large part of homebuying demand and flock to tech hubs like Seattle; San Jose, California and Austin, Texas, we may see this challenge intensify. This is reflected in a recent CoreLogic consumer survey, with 47.9% of this cohort stating they cannot afford to purchase a home in their preferred area.
“Remote work has allowed many employees to buy homes further away from their office. These homes are often in the suburbs or exurbs, where property prices and population density are lower and single-family detached housing more common.”
– Dr. Frank Nothaft
Chief Economist for CoreLogic
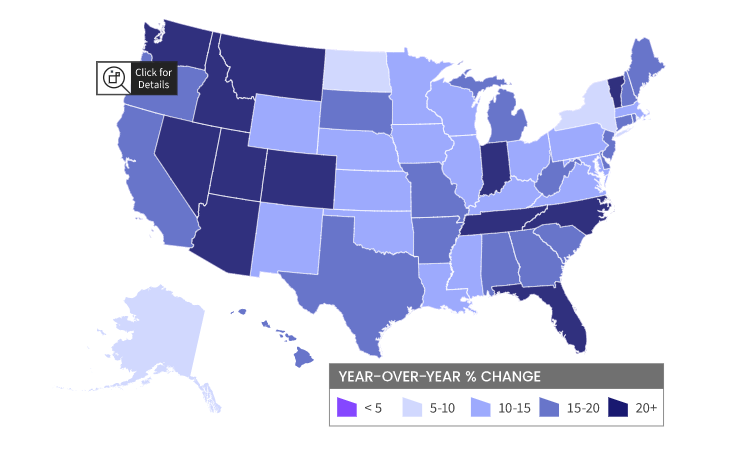
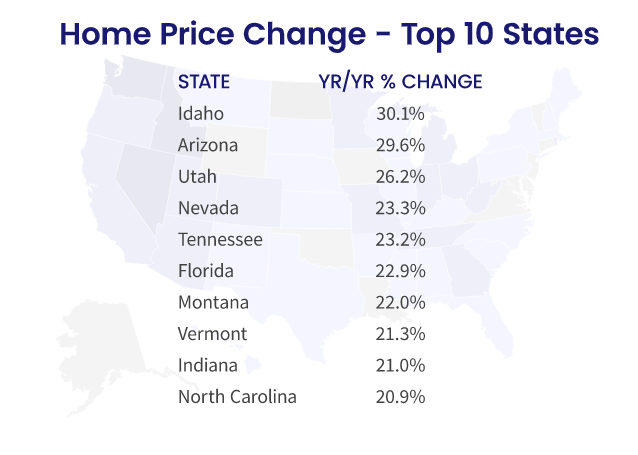
HPI National and State Maps – September 2021
The CoreLogic HPI provides measures for multiple market segments, referred to as tiers, based on property type, price, time between sales, loan type (conforming vs. non-conforming) and distressed sales. Broad national coverage is available from the national level down to ZIP Code, including non-disclosure states.
Nationally, home prices increased 18% year over year in September. No states posted an annual decline in home prices. The states with the highest increases year-over-year were Idaho (30.1%) and Arizona (29.6%).
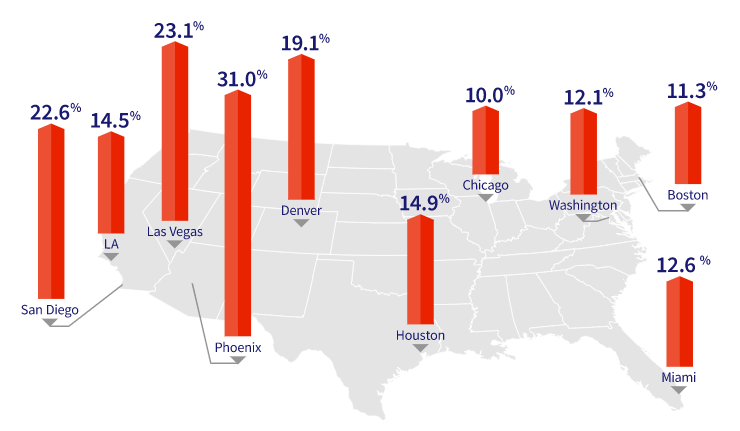
HPI Top 10 Metros Change
The CoreLogic HPI provides measures for multiple market segments, referred to as tiers, based on property type, price, time between sales, loan type (conforming vs. non-conforming) and distressed sales. Broad national coverage is available from the national level down to ZIP Code, including non-disclosure states.
These large cities continue to experience price increases in September, with Phoenix leading the way at 31% year over year.
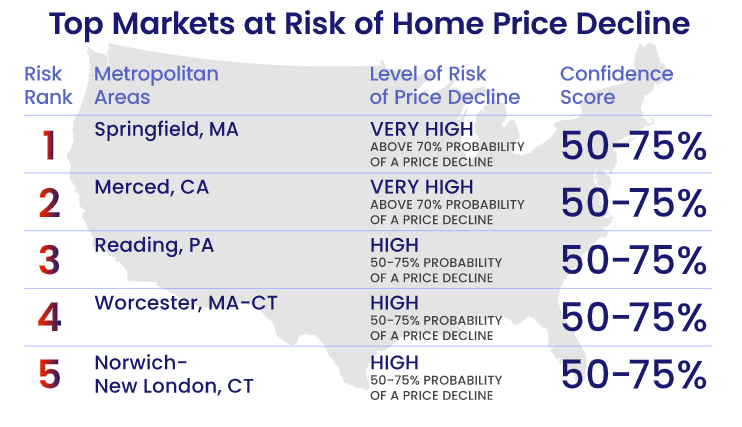
Markets to Watch: Top Markets at Risk of Home Price Decline
While home price changes on the local level vary, September gains across all of the top 10 metros surpassed their 2020 levels. However, metro areas where affordability constraints are prevalent continue to persist as prices rise. For instance, in September, home prices in San Diego increased 22.6% year over year and are forecasted to increase an additional 6.5% over the next 12 months.
Conversely, The HPI Forecast also reveals the continued disparity in home price growth across metros. In markets like Houston, which was hit hard by the collapse of the oil industry and the recent hurricane season, home prices are expected to decline 1.6% by September 2022.
The CoreLogic Market Risk Indicator (MRI), a monthly update of the overall health of housing markets across the country, predicts that metros such Springfield, Massachusett, and Merced, California are at the highest risk (above 70% probability) of a decline in home prices over the next 12 months. Norwich-New London, Connecticut; Reading, Pennsylvia; and Worcester, Massachusetts are also at high risk (50-70%) of a decline.
To learn more about the data behind this article and what CoreLogic has to offer, visit https://www.corelogic.com/.


Sign up to receive our stories in your inbox.
Data is changing the speed of business. Investors, Corporations, and Governments are buying new, differentiated data to gain visibility make better decisions. Don't fall behind. Let us help.


Sign up to receive our stories in your inbox.
Data is changing the speed of business. Investors, Corporations, and Governments are buying new, differentiated data to gain visibility make better decisions. Don't fall behind. Let us help.