ATTOM’s just released Q4 2021 U.S. Home Affordability Report shows the latest pattern in home affordability – home prices still manageable, but getting less affordable – has resulted in major ownership costs on the typical home consuming 25.2 percent of the average national wage of $65,546.
According to ATTOM’s latest home affordability analysis, the percent of wages needed to buy a median-priced single-family home is up from 24.4 percent in Q3 2021 and 21.5 percent in Q4 2020. The report noted the latest level of 25.2 percent is still within the 28 percent standard lenders prefer for how much homeowners should spend on mortgage payments, home insurance and property taxes.
The Q4 2021 report also shows that median-priced homes are less affordable in the fourth quarter compared to historical averages in 77 percent of U.S. counties analyzed. That figure is up from just 39 percent of counties in Q4 2020, to the highest point in 13 years, as home prices continue rising faster than wages.
ATTOM’s Q4 2021 home affordability report noted that compared to historical levels, median home prices in 440 of the 575 counties analyzed in Q4 2021 are less affordable than past averages. That number is up from 428 of the same group of counties in Q3 2021 and 224 in Q4 2020. The percentage of counties where affordability is worse than historical averages during Q4 2021 has hit another high point since Q3 2008.
Also according to ATTOM’s Q4 2021 home affordability analysis, among the 575 counties in the report, 135 are more affordable than their historic affordability averages in Q4 2021. That number is down slightly from 26 percent of the same group of counties in Q3 2021 and 61 percent in Q4 2020.
The report noted that counties with a population of at least 1 million that are more affordable than their historic averages (indexes of more than 100 are considered more affordable compared to historic averages) include New York County (Manhattan), NY (index of 129); Montgomery County, MD (outside Washington, D.C.) (119); Cook County (Chicago), IL (113); Santa Clara County (San Jose), CA (113) and Fairfax County, VA (outside Washington, D.C.) (109).
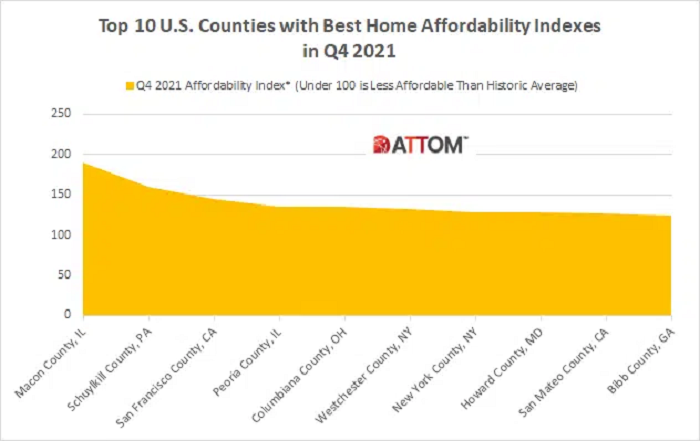
The Q4 2021 home affordability report also noted that counties with the best affordability indexes in Q4 2021 include Macon County (Decatur), IL (index of 191); Schuylkill County, PA (outside Allentown) (160); San Francisco County, CA (144); Peoria County, IL (135) and Columbiana County, OH (west of Pittsburgh, PA) (135).
In this post, we take a deep dive into the data behind the Q4 2021 home affordability analysis to uncover the complete list of the top 10 counties with the best affordability indexes. Those rounding out the top 10 counties that are more affordable than their historic averages in Q4 2021 include: Westchester County, NY (132); New York County, NY (129); Howard County, MD (128); San Mateo County, CA (127); and Bibb County, GA (124).
ATTOM’s Q4 2021 home affordability report also mentioned that counties with a population of least 1 million residents where the affordability index improved most or declined least from Q4 2020 to Q4 2021 are Wayne County (Detroit), MI (index up 11 percent); Cook County (Chicago), IL (up 3 percent); Santa Clara County (San Jose), CA (down 2 percent); Kings County (Brooklyn), NY (down 4 percent) and Montgomery County, MD (outside Washington, DC) (down 4 percent).
ATTOM’s home affordability report determines affordability for average wage earners by calculating the amount of income needed to meet major monthly home ownership expenses — including mortgage, property taxes and insurance — on a median-priced single-family home, assuming a 20 percent down payment and a 28 percent maximum “front-end” debt-to-income ratio. That required income is then compared to annualized average weekly wage data from the Bureau of Labor Statistics.
To learn more about the data behind this article and what Attom Data Solutions has to offer, visit https://www.attomdata.com/.


Sign up to receive our stories in your inbox.
Data is changing the speed of business. Investors, Corporations, and Governments are buying new, differentiated data to gain visibility make better decisions. Don't fall behind. Let us help.


Sign up to receive our stories in your inbox.
Data is changing the speed of business. Investors, Corporations, and Governments are buying new, differentiated data to gain visibility make better decisions. Don't fall behind. Let us help.