Source: https://www.corelogic.com/intelligence/single-family-annual-rent-growth-continues-at-a-rapid-pace/
U.S. Single-Family Rents Up 11.5% Year Over Year in November
Annual single-family rent growth hit seventh consecutive record.
Rent growth for detached properties slowed a bit while that of attached properties strengthened.
Overall Single-Family Rent Growth
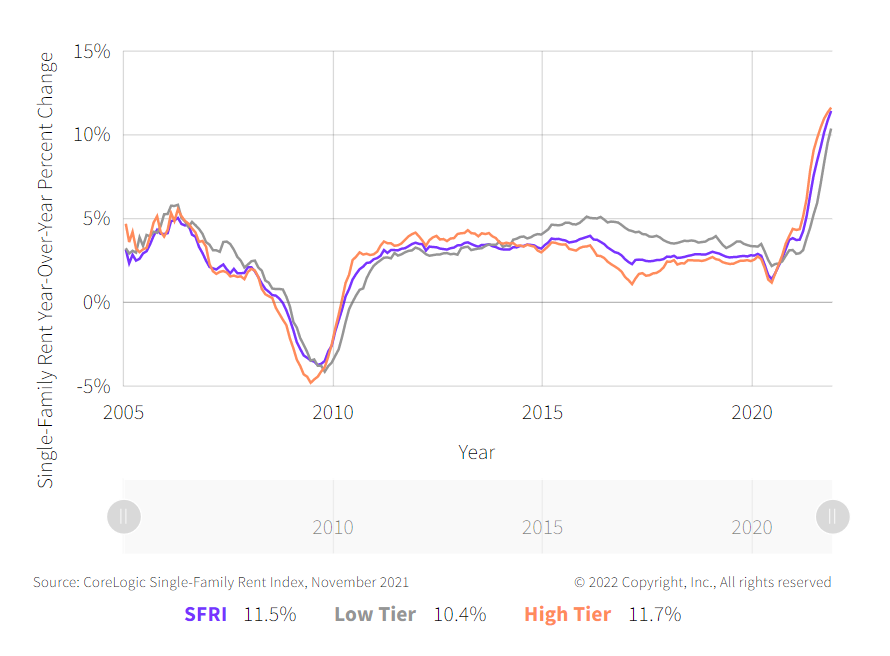
U.S. single-family rent growth increased 11.5% in November 2021, the fastest year-over-year increase in over 16 years1, according to the CoreLogic Single-Family Rent Index (SFRI). The index measures rent changes among single-family rental homes, including condominiums, using a repeat-rent analysis to measure the same rental properties over time. The November 2021 increase was more than three times the November 2020 increase, and while the index growth slowed in the summer of 2020, rent growth returned to its pre-pandemic rate by October 2020.
Figure 1: National Single-Family Rent Index Year-Over-Year Percent Change By Price Tier

Single-Family Rent Growth by Price Tier
Rent growth accelerated for all price tiers in November, though rents for high-priced rentals showed the highest increase. The low-price tier is defined as properties with rent prices less than 75% of the region’s median rent, and the high-price tier is defined as properties with rent prices greater than 125% of a region’s median rent (Figure 1).
Rent prices for the low-price tier, increased 10.4% year over year in November 2021, up from 3.1% in November 2020. Meanwhile, high-price rentals increased 11.7% in November 2021, up from a gain of 4% in November 2020. This was the fastest increase in the history of the SFRI for both the low- and high-price rent tiers.
Single-Family Rent Growth by Property Type
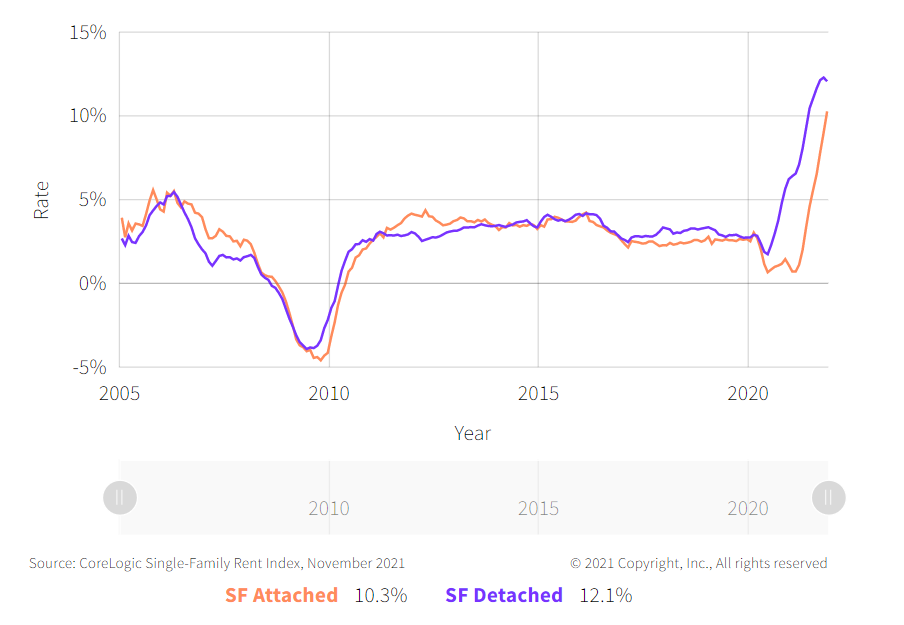
Differences in rent growth by property type2 emerged after the pandemic as renters sought out standalone properties in lower density areas (Figure 2), though the most recent data show that rent growth slowed a bit for detached properties and continued to strengthen for attached properties. Annual rent growth for detached rentals was 12.1% in November, compared with 10.3% for attached rentals.
Figure 2: Rent Growth for Detached Properties was Double That of Attached Properties

Metro-Level Results
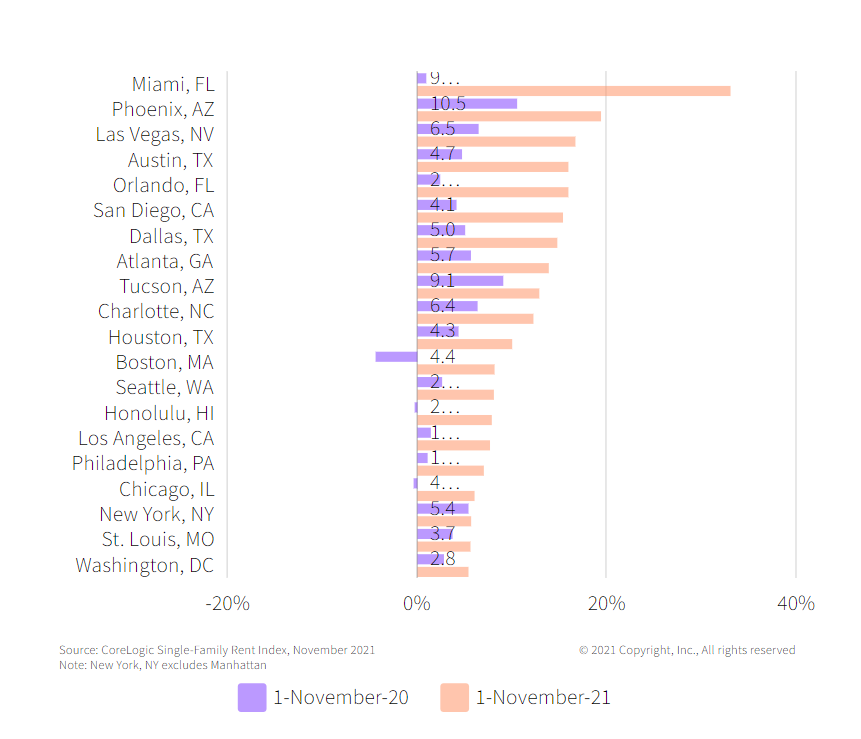
Figure 3 shows the year-over-year change in the rental index for 20 large metropolitan areas in November 2021. Among the 20 metro areas shown, Miami, with an increase of 33%, stood out with the highest year-over-year rent growth in November, followed by Phoenix at 19.4%. Washington, DC had the lowest increase at 5.4%, and Boston (+8.1%) showed significant improvement from a year ago when rents decreased 4.4%. All 20 metros shown in Figure 3 had higher rent growth than a year earlier.
Figure 3: Single-Family Rent Index Year-Over-Year Percent Change in 20 Markets

Single-family rent growth hit its seventh consecutive record high in November 2021, mirroring record price increases in the for-sale housing market. Annual rent growth in October 2020 had already recovered from pre-pandemic lows, and annual rent growth this November was more than three times that of a year earlier. Rapid increases in single-family rents, especially for lower-priced properties, have led to a continued erosion of affordability. Rent growth should continue to be robust in the near term, especially as the labor market continues to improve.
To learn more about the data behind this article and what CoreLogic has to offer, visit https://www.corelogic.com/.


Sign up to receive our stories in your inbox.
Data is changing the speed of business. Investors, Corporations, and Governments are buying new, differentiated data to gain visibility make better decisions. Don't fall behind. Let us help.


Sign up to receive our stories in your inbox.
Data is changing the speed of business. Investors, Corporations, and Governments are buying new, differentiated data to gain visibility make better decisions. Don't fall behind. Let us help.


