
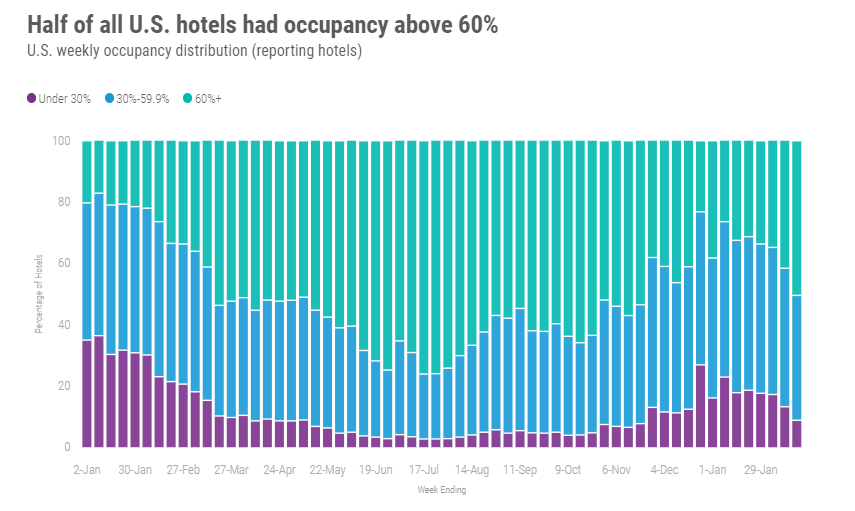
Driven by the Presidents’ Day holiday weekend, U.S. leisure travel made a big comeback and pushed occupancy 4.6 percentage points to 59.1% during the week of 13-19 February 2022. That was the highest level of the past 13 weeks and the second consecutive week in which occupancy expanded by more than four percentage points from the previous 7-day period. The demand expansion was somewhat widespread as 40% of the 166 STR-defined U.S. markets reported weekly occupancy of 60% or more. Additionally, more than half of all markets saw occupancy surpass 70% over the weekend leading up to the holiday. Average daily rate (ADR) also advanced, increasing 4.7% and contributing to a 13.5% rise in revenue per available room (RevPAR).
Of course, the big story was the weekend itself, when occupancy reached 73.8%, the highest such level since mid-October. Looking back at our entire historical database, the 2022 version of Presidents’ Day holiday weekend (Friday & Saturday) was the eighth highest in terms of occupancy. But there’s a catch, which has more to do with a “celebration of love” versus a celebration of presidents. Of the seven higher performing Presidents’ Day weekends, six shared the holiday with Valentine’s Day, making those weekends soar. The highest Presidents’ Day/Valentine’s Day weekend occurred in 2015, when occupancy hit 77.6%. Excluding those six, this year’s result was the second highest, behind 2018 by just a half-percentage point. If you look simply at room demand, 2022 surpassed 2018 by more than 300,000 room nights. Additionally, this year’s Presidents’ Day weekend demand level was 405,600 higher than 2015.
Market occupancy climbed to levels not seen since Columbus Day weekend as 15 markets reported weekend occupancy above 90%, led by Daytona Beach (95.9%) and six other Florida markets. Daytona Beach and the sounding area benefited from the annual Daytona 500 race. The most astonishing weekend occupancy was seen in Orlando (93%), which is the second largest market in the U.S. based on supply behind Las Vegas. This was Orlando’s highest weekend occupancy since Valentine’s Day weekend in 2020. Nine other markets, mostly in Florida and including Miami (93.7%), also saw pandemic-era highs over the weekend. Los Angeles had a good Presidents’ Day weekend as well with occupancy at 85%, which was higher than the market’s Super Bowl weekend (83%). Overall, only 15 markets reported occupancy below 60% during the weekend, which was the fewest in some time.
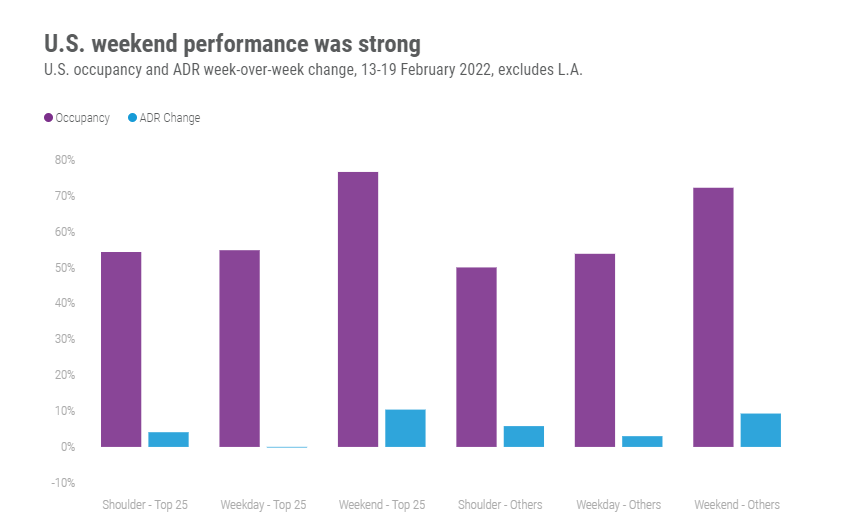
Weekday (Monday-Wednesday) occupancy rose for a fourth consecutive week with occupancy reaching 54%, a level last seen around Christmas. Among the Top 25 Markets, occupancy was a bit stronger (55%), led by Tampa (77.6%) and Miami (77%). Phoenix and Oahu Island also had weekday occupancy above 70%. New York City weekday occupancy grew for a second straight week to 51%. Among submarkets identified as central business districts (CBD), weekday occupancy inched closer to the 50% level at 46.5%. CBD results were weighed down by six markets where weekday occupancy was 35% or less, including in Chicago, Houston, Philadelphia, and Washington, DC.
Nominal (non-inflation-adjusted) ADR for the week was eight percent higher than what it was in 2019. This is the second week since Christmas when nominal ADR surpassed 2019. On an inflation-adjusted basis (real), ADR was three percent lower than what it was in 2019. As with occupancy, weekend nominal and real ADR was much stronger with both measures surpassing 2019 comps—nominal by 25% and real by 13%. Twenty-six markets reported weekend ADR above US$200, led by the Florida Keys (US$740) and Maui (US$639). Ninety seven percent of all markets reported nominal weekend ADR higher than in the comparable weekend of 2019. Real ADR was higher than in 2019 among 82% of all markets. Excluding Los Angeles, due to the Super Bowl in the previous weekend, Top 25 weekend ADR was strong with a 10% week-on-week gain. Eight Top 25 Markets reported double-digit growth over the weekend led by Miami (+36%) and Orlando (+21%). Only Los Angeles, Anaheim, and Houston saw an ADR decrease from the prior weekend.
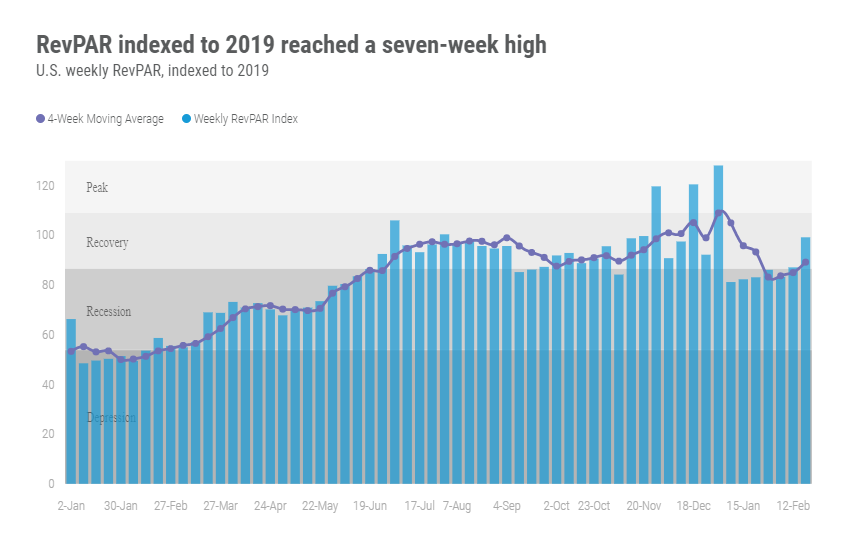
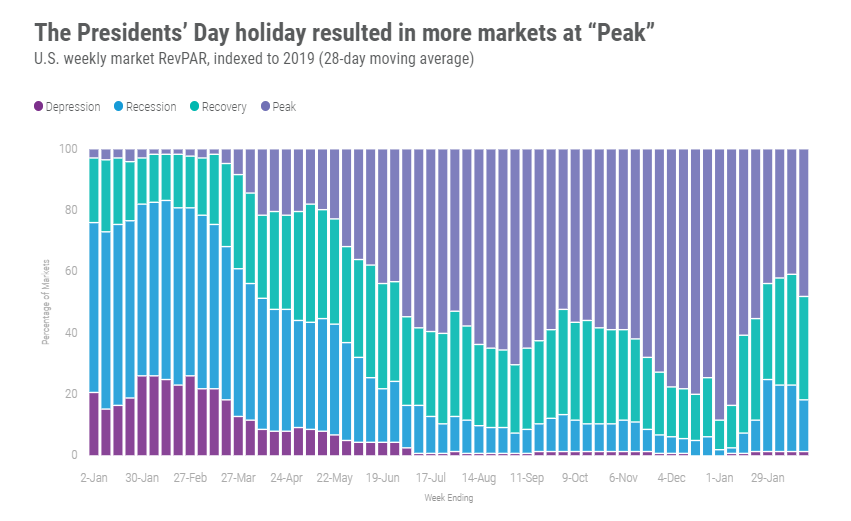
Excluding the Christmas holiday week, RevPAR hit a 17-week high at US$83. More than half of all markets were at “Peak” RevPAR (RevPAR indexed to 2019 above 100) with another 36% of markets in “Recovery” (RevPAR indexed to 2019 between 80 and 100). Real RevPAR was at “Peak” or in “Recovery” in 87% of markets. Of course, it was the weekend that shined with Friday/Saturday RevPAR (US$116) at its highest level since mid-October, even surpassing the Christmas holiday week. The highest weekend RevPAR was seen in the Florida Keys (US$702), Maui (US$513) and Miami (US$459). Looking at the past 28 days, slightly less than half of markets were at “Peak” with another third in “Recovery.” Taking to account inflation, 23% of markets are at “Peak” with the majority (48%) in “Recovery.” Overall, the U.S. remained in “Recovery” as it has for the past 39 weeks.
Around the globe
For a second consecutive week, non-U.S. occupancy grew five percentage points with occupancy advancing to 49%, a seven-week high. After falling in the previous week, ADR increased 1.9%. With sharp gains in occupancy along with ADR growth, RevPAR grew by 15.3% week on week, which was the largest such increase since early 2021, excluding the Christmas holiday week. The gains in performance were led by China, Spain, and the United Kingdom, which accounted for half of the weekly demand increase. China alone was responsible for 38% of the growth in demand for the week. Of the 104 countries tracked on a weekly basis, only 14 reported a decrease in weekly demand.
Among the top 10 countries, based on supply, the highest weekly occupancy was in the U.K. (68%), followed by Mexico (57%), Spain (54%) and China (49%). Germany continued to have the lowest occupancy (35%), but the country advanced four percentage points in the week. ADR among the top 10 was down (-1%) but the decrease was a result of the Winter Olympics ending in Beijing. Excluding China, ADR in the remaining nine countries was up collectively by 6% with a 17% gain in France as well as 7% or better lifts in Italy, Spain, and the U.K.
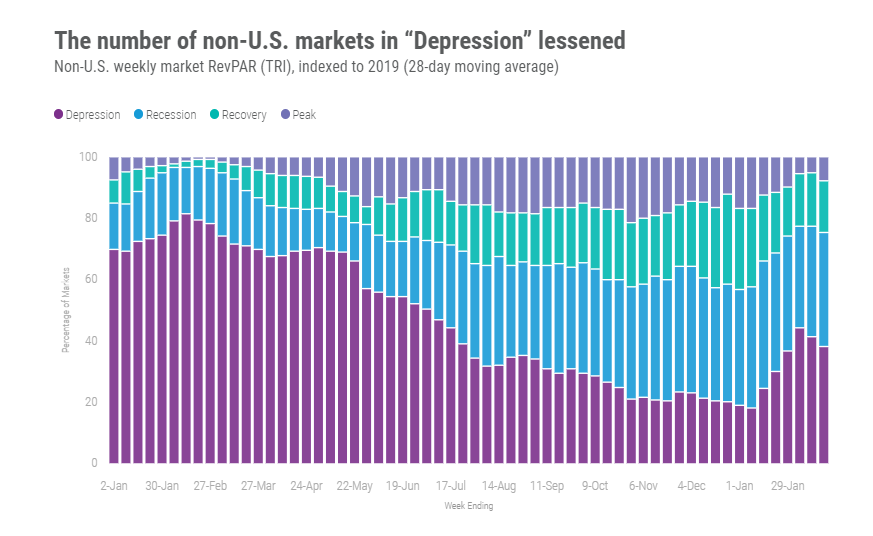
China’s demand growth was widespread with nearly all markets reporting gains, led by Shanghai and Beijing. London was the leader in the U.K., but demand growth was seen in every market except one. The highest occupancy of any non-U.S. market this week was Dubai (91%) with Bali at the other end of the spectrum (15%). Most markets (75%) remain in “Depression” (RevPAR indexed to 2019 below 50) and/or “Recession” (RevPAR indexed to 2019 between 50 and 80) but there has been some lessening in the percentage of markets in “Depression.”
Big Picture
This past week clearly showed that leisure travel is alive and well. And it’s only going to get better. That’s because the U.S. Spring Break season is set to begin in the coming weeks. Additionally, TSA airport security screenings are rising, after bottoming out in mid-January. Some of the increase in air travel is likely due to increasing business travel, which has been evident in weekday demand among the Top 25 Markets. Of course, business travel still has a way to go. However, the gains represent an important improvement and a good sign overall. However, better performance could stall in locations outside of the U.S. given the invasion of Ukraine. The extent and reach of the impact is unknown. We don’t anticipate the invasion will impact the U.S. hotel industry even as energy prices increase. Historically, higher energy prices have had limited impact on travel.
To learn more about the data behind this article and what STR has to offer, visit https://str.com/.


Sign up to receive our stories in your inbox.
Data is changing the speed of business. Investors, Corporations, and Governments are buying new, differentiated data to gain visibility make better decisions. Don't fall behind. Let us help.


Sign up to receive our stories in your inbox.
Data is changing the speed of business. Investors, Corporations, and Governments are buying new, differentiated data to gain visibility make better decisions. Don't fall behind. Let us help.