March 2022 Top-Line Metrics (percentage change from March 2019)
Occupancy: 64.0% (-6.2%)
Average daily rate (ADR): US$146.61 (+10.9%)
Revenue per available room (RevPAR): US$93.82 (+4.0%)
Key Points from the Month
U.S. hotel occupancy and RevPAR were the highest on an absolute basis since July 2021.
On a nominal basis, the country’s ADR level was the highest for any month on record. When adjusted for inflation, the March ADR level was roughly 2% below the 2019 comparable.
All chain scales reported ADR growth over March 2019.
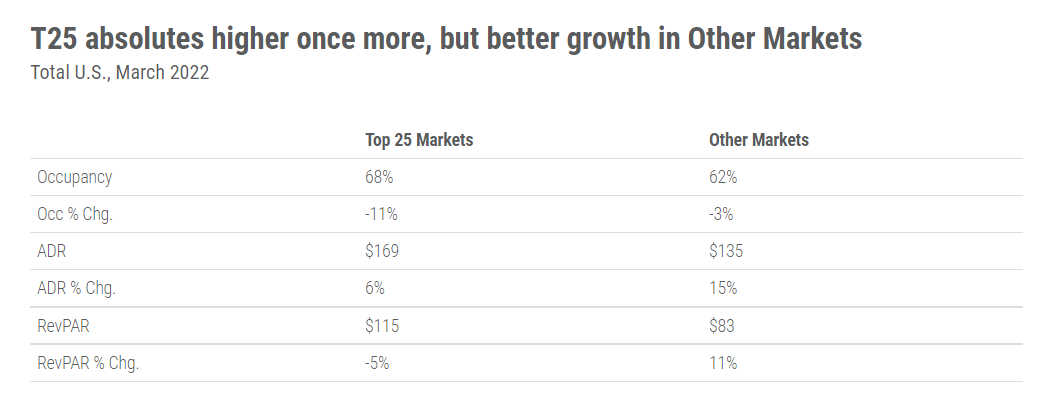
In a return to pre-pandemic trends, Top 25 Market KPIs are ahead of all other markets with occupancy, ADR, and RevPAR all higher in the major metros.
Chain Scales
All scales reported ADR growth over March 2019, ranging from +2.8% (upscale) to +26.8% (luxury) despite occupancy declines across the board. Upscale (+1.6%), upper midscale (+4.1%) and midscale (+1.0) properties posted demand growth, but each are competing with an influx of supply (+10.5%, +8.4% and +3.6%, respectively) which offsets any potential occupancy gains. Upper upscale showed the worst RevPAR decline (-8.4%), driven down by a 12.1% demand decline coupled with 4.6% growth in supply.
Top 25 Markets
Among the Top 25 Markets, Tampa experienced the highest occupancy level (84.7%), which was still down 3.6% from the market’s 2019 benchmark.
None of the Top 25 Markets saw an occupancy increase over 2019.
Markets with the lowest occupancy for the month included Minneapolis (50.1%) and Chicago (54.5%).
San Francisco/San Mateo reported the steepest decline in occupancy when compared with 2019 (-23.4%).
Top 25 Market KPIs were once again ahead of all other markets. This was not surprising from an ADR perspective, but surprising from an occupancy standpoint given the higher proportion of business/group demand that makes up Top 25 Market demand as well as the strict restrictions some of these markets held in place (example: San Francisco).

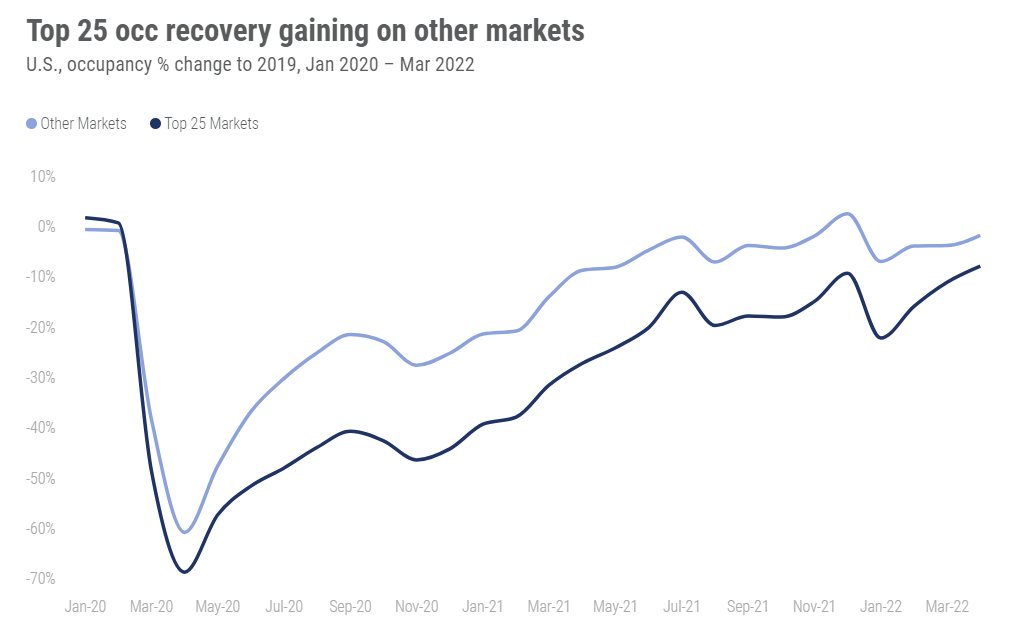
The Top 25 Markets are closing the delta to “All Other Markets” when it comes to occupancy recovery.

It is evident that All Other Market occupancy growth continues to improve month to month, so the shrinking delta between Top 25 Markets and All Other Markets suggests that Top 25 Market recovery is gaining momentum.
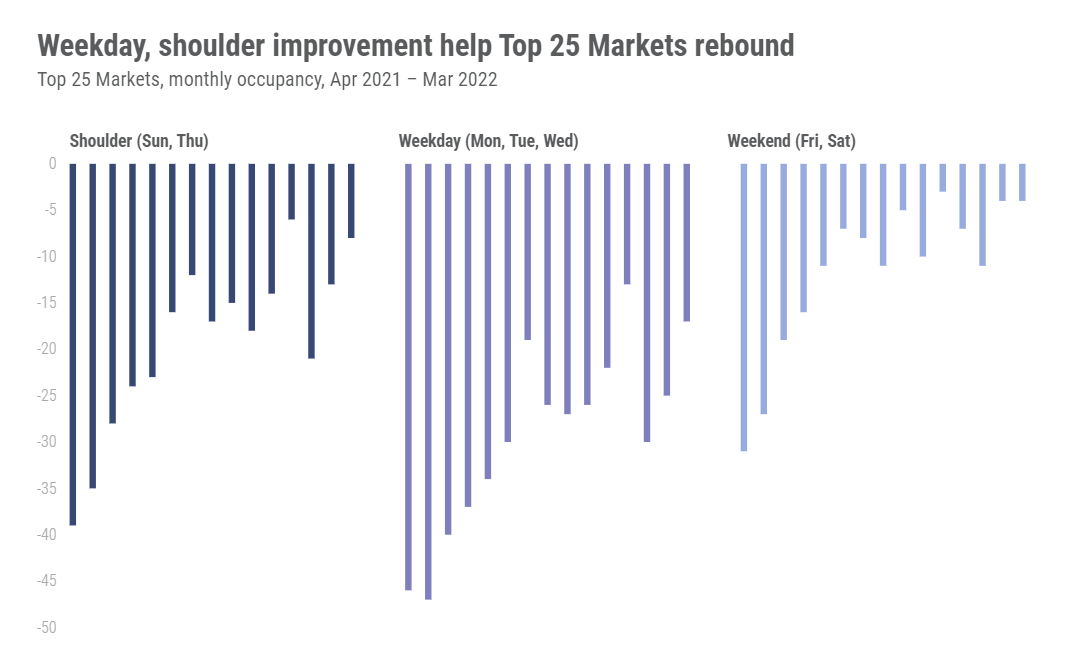
March continued to show improvement in weekday and shoulder day demand in Top 25 Markets. March was second-highest weekday and shoulder demand of the pandemic-era behind December 2021.

Latest Data
Our latest data through 23 April shows that after its typical pre-Easter slowing, the U.S. hotel industry rebounded with occupancy of 65.8%. U.S. weekly occupancy was the 10th highest of the pandemic era thus far. The Florida Keys (86.7%) led the nation followed by Charleston (80.8%) and Savannah (80.2%). Other notable occupancy levels were observed in Orlando (78.9%), which hosted The Cheerleading Worlds 2022, and New York City (78.5%), which recorded its third best level of the era. Of NYC’s 10 highest pandemic-era occupancy levels, six have occurred in the past six weeks.
Over the past 28 days, 70% of U.S. markets were at “peak” RevPAR (RevPAR indexed to 2019 above 100) with 27% in “recovery” (RevPAR indexed to 2019 between 80 and 100) and just 3% in “recession” (RevPAR indexed to 2019 between 50 and 80). Real RevPAR was at “peak” in 40% of markets. The good news is that even on an inflation-adjusted basis, there are no markets in “depression” (RevPAR indexed to 2019 below 50).
To learn more about the data behind this article and what STR has to offer, visit https://str.com/.


Sign up to receive our stories in your inbox.
Data is changing the speed of business. Investors, Corporations, and Governments are buying new, differentiated data to gain visibility make better decisions. Don't fall behind. Let us help.


Sign up to receive our stories in your inbox.
Data is changing the speed of business. Investors, Corporations, and Governments are buying new, differentiated data to gain visibility make better decisions. Don't fall behind. Let us help.


