Despite much multifamily analysis lauding 2022 as a continuation of 2021’s generational numbers in rent growth and absorption, 2022 has brought significant change for the industry. Certainly, looking at 12-month numbers paints a rosy picture. Yet, as has previously been covered at ALN, apartment demand has winnowed significantly on a year-to-date basis. Rent growth, now somewhat detached from demand, appears to be relying more on momentum and continued low vacancies after last year’s net absorption explosion. Neither factor is guaranteed to persist. Also, rising interest rates paired with compressed cap rates have reportedly begun to lead to widespread negative leverage.
To be sure, the picture is not all doom and gloom. However, it is important to recognize that conditions have materially shifted from last year. One useful perspective from which to evaluate those changes is that of price class.
As always, all numbers will refer to conventional properties of at least 50 units.
Class A
Over the last 12 months ending in May, national net absorption for Class A properties totaled more than 162,000 units. That was considerably more than in any recent 12-month period. As already mentioned, the annualized numbers still somewhat obscure the shift over the last handful of months. On a year-to-date basis through May, the roughly 41,000 net absorbed units in the Class A segment represent a 41% decline from the same period a year ago and are more in line with the total from 2018 and 2019.
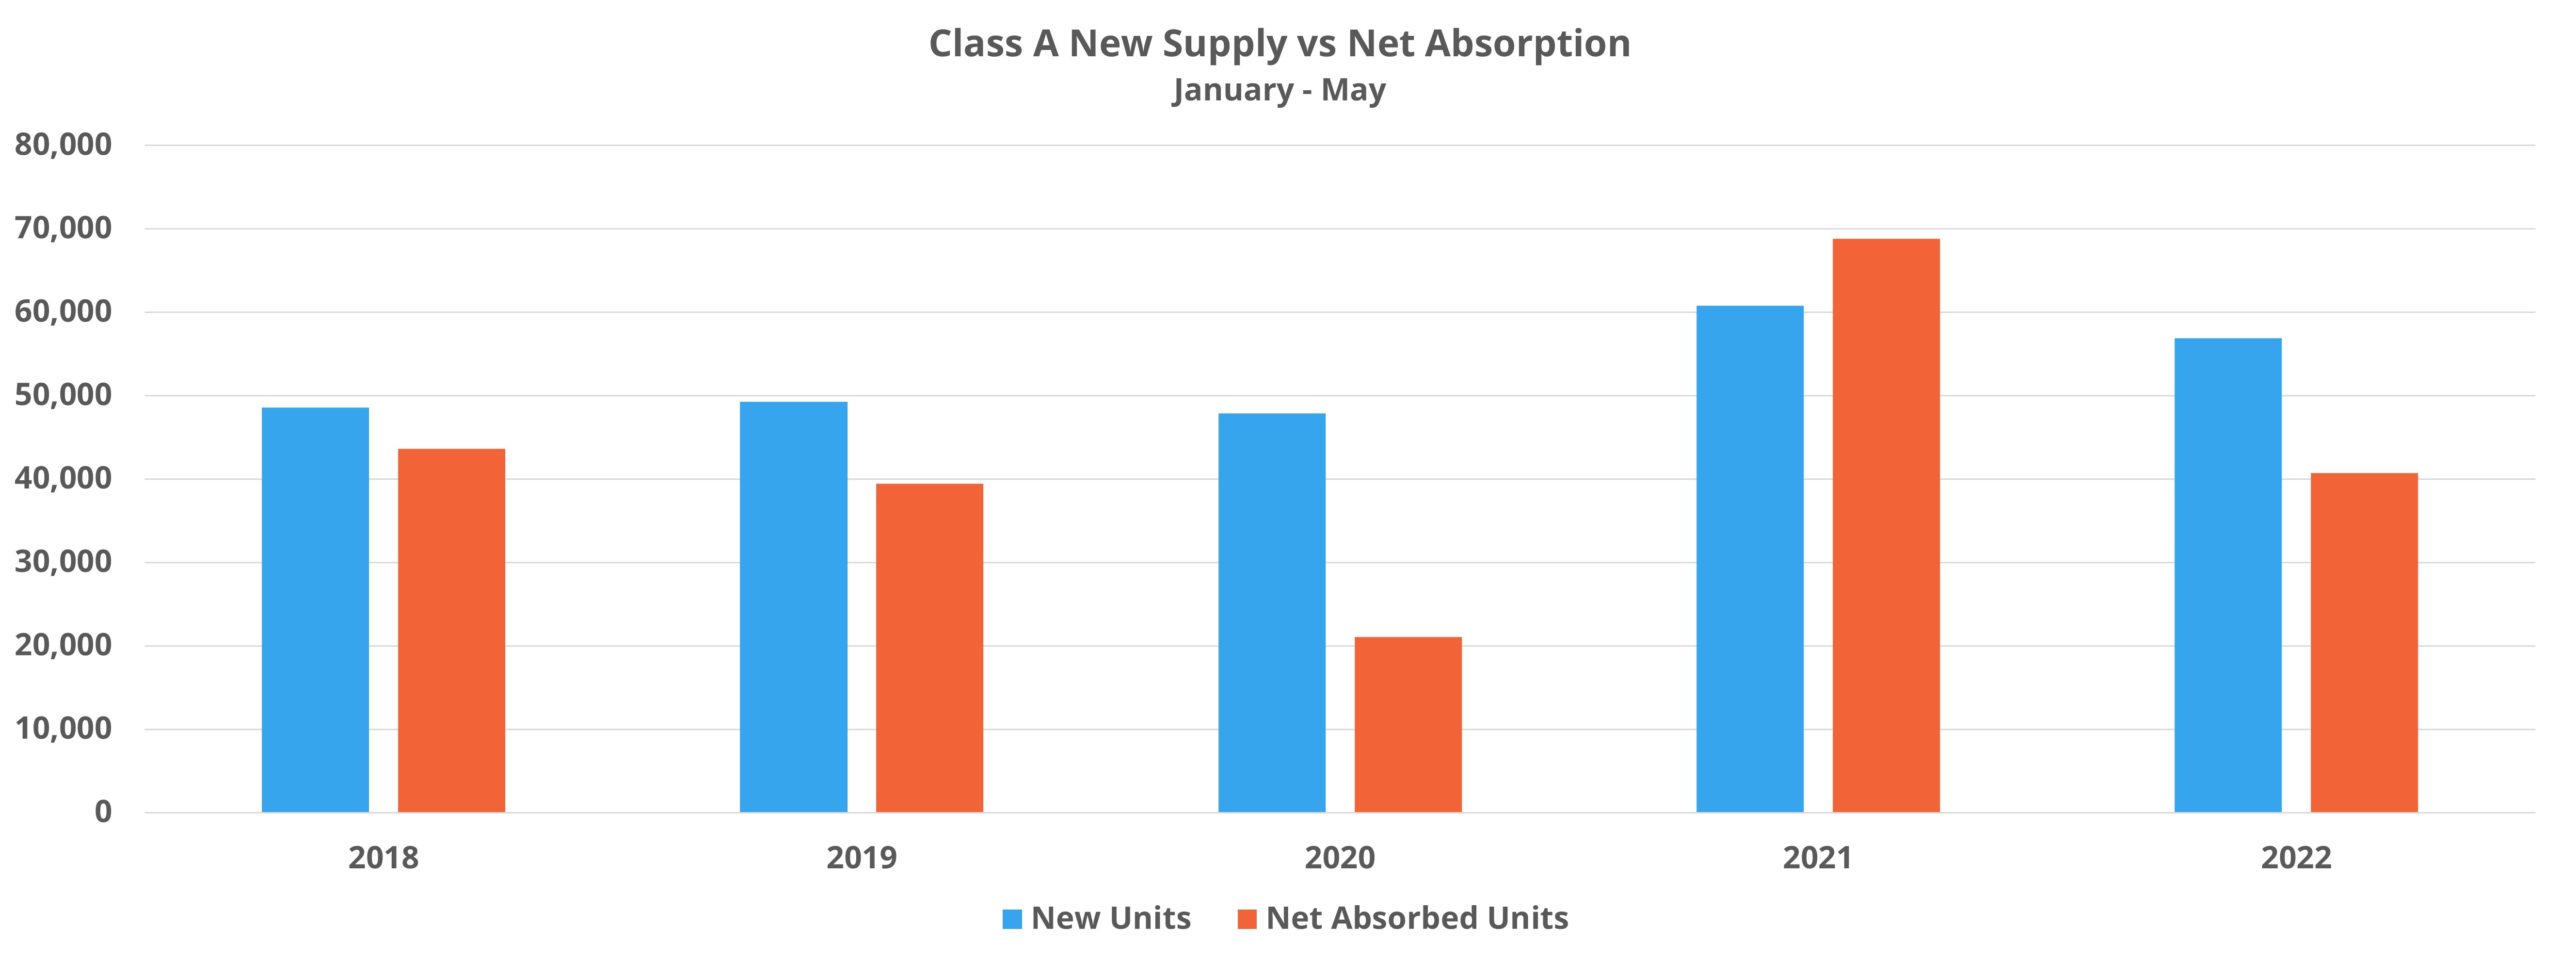
New supply has moderated so far this year compared to last, but the more than 56,000 new Class A units delivered through May were still more than in 2018, 2019, or 2020. With both new supply and apartment demand lagging compared to 2021, average occupancy so far this year has fallen by 0.8% to close May at a little below 89%. Three markets – Boston, Phoenix, and Raleigh – Durham have seen Class A average occupancy fall by 6% or more so far this year. For the latter two areas, the volume of new units was a major factor.
The average Class A unit finished May leasing for a little over $2,250 per month for new leases after a 5.7% average effective rent jump during the first five months of the year. An interesting analogue for this year was 2019. Average occupancy change, net absorption, and net absorption as a percent of vacant units were almost identical for Class A properties during the first five months of 2019 and 2022. The difference between the two periods was average effective rent growth for the period in 2019 was 2.1% compared to this year’s 5.7%. Two markets – Las Vegas and Orlando had already crossed the 10% gain threshold by the end of May.
Class B
Just less than 140,000 net units have been absorbed in the Class B space in the last 12 months The slowdown in this sector in recent months has been more pronounced than at the top of the market. This year’s value through May was 65% lower than last year’s and was barely half that from the same portion of 2018 and 2019.
The softening of demand has been most concentrated in urban regions where year-to-date net absorption has fallen by nearly 75% compared to last year. Nine markets overall have suffered negative net absorption in the Class B space so far this year, led by a net loss of about 500 leased units in Atlanta.
Just more than 35,000 new Class B units were delivered around the country during the first five months of the year. These are typically properties built in more outlying submarkets. New supply was down substantially from about 53,000 deliveries in the same period last year and was the lowest number of the last five years.
The reduction in new supply was not enough to offset the demand decline, but the average occupancy loss was mitigated to the tune of 0.3% to end May at just over 93%. No market lost more than the 2.8% decline in Tampa, thanks in part to seven new Class B properties being delivered in the period.
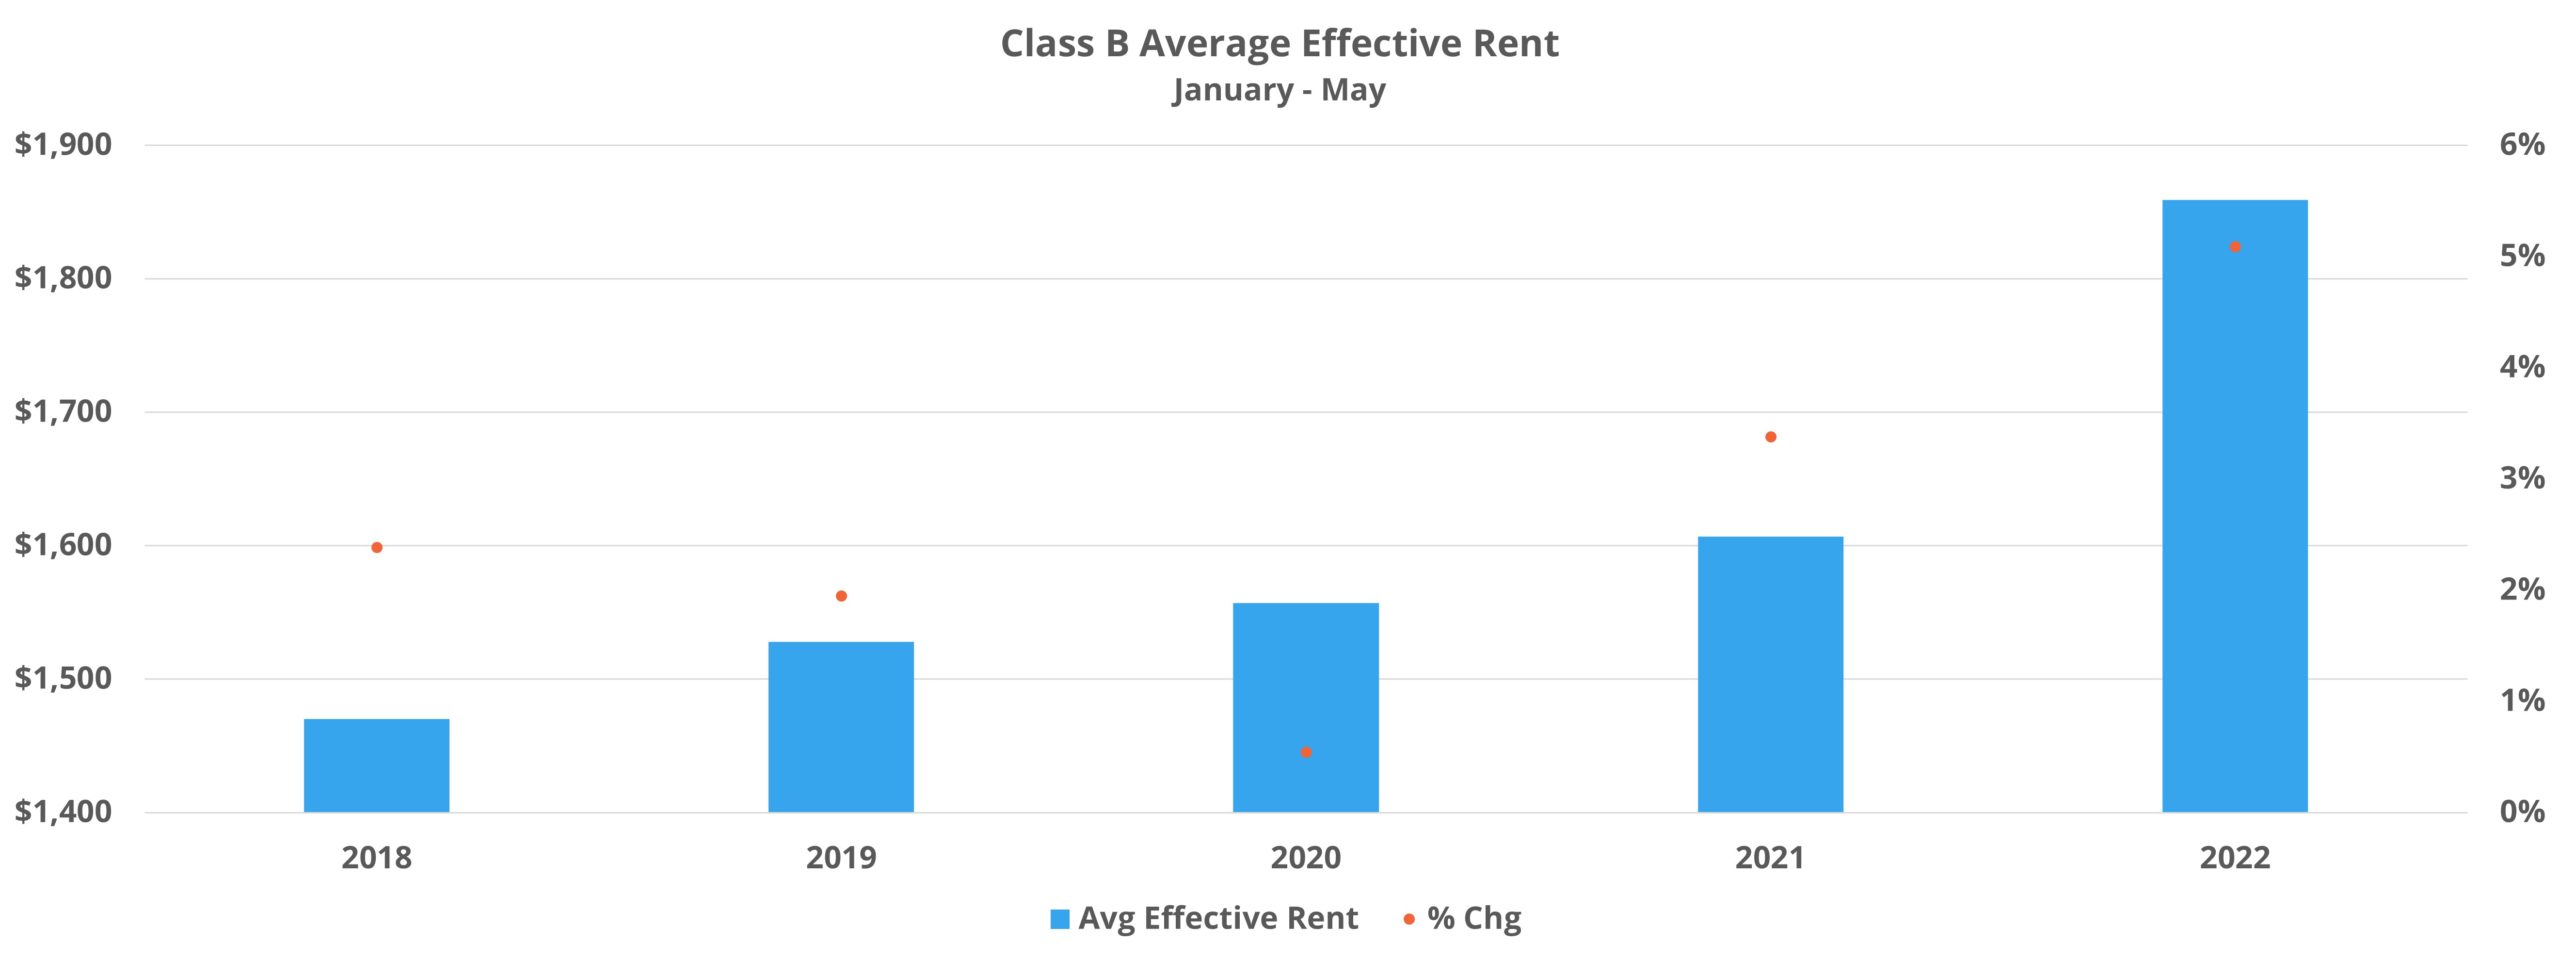
Due to average occupancy remaining higher than normal in light of reduced new supply, rent growth has maintained its torrid pace. A 5.3% gain through May in average effective rent for new leases was easily the highest of any recent year and brought the average Class B unit to almost $1,850 per month. Charlotte, Nashville, and Orlando closed the month in a three-way tie for Class B rent growth at more than 7%.
Classes C and D
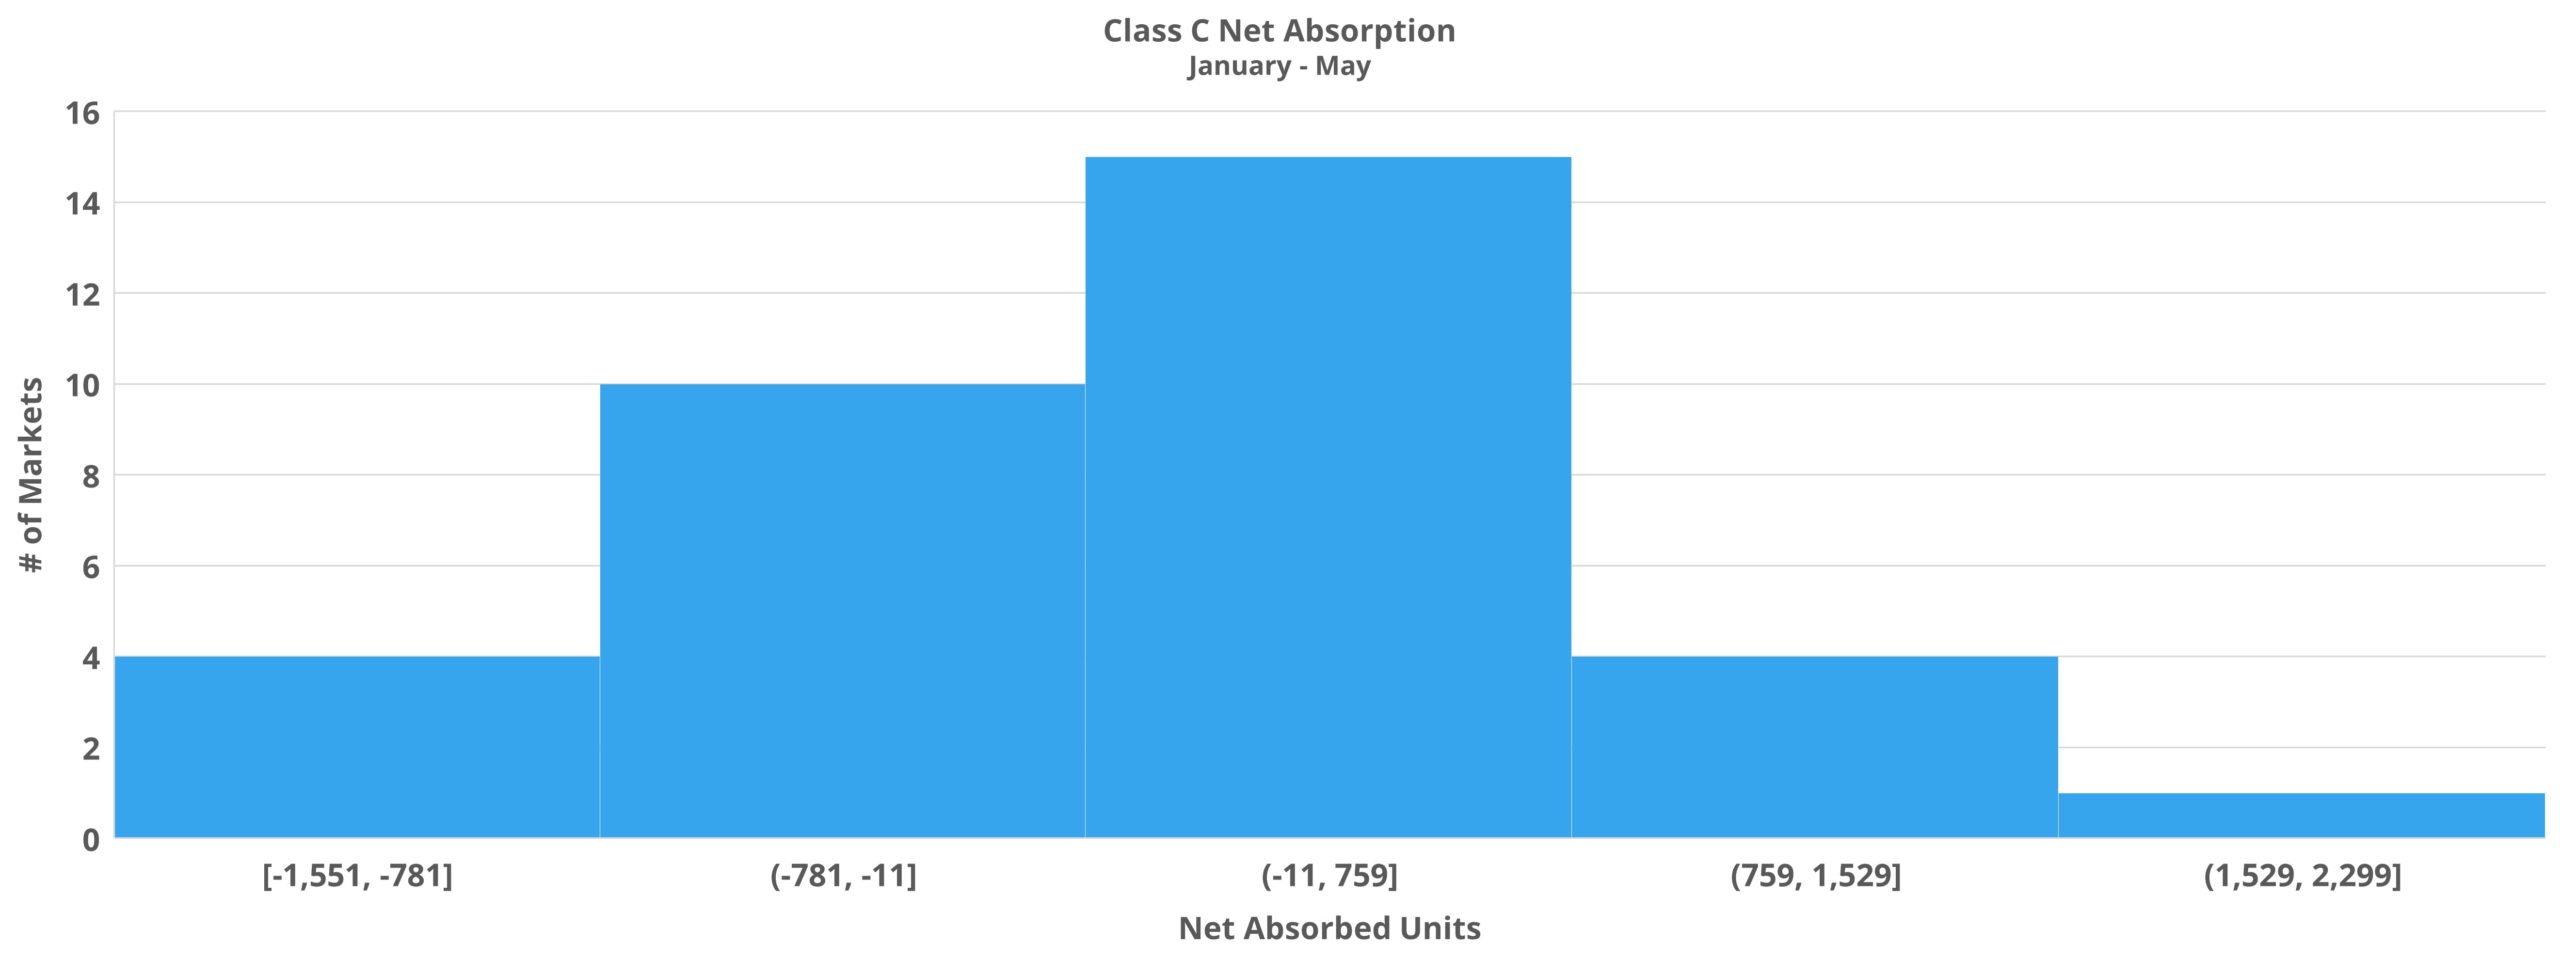
Though the decreases in net absorption so far this year compared to last year were fairly stark in the top two price classes, they pale in comparison to Classes C and D. For the Class C subset, about 4,700 net absorbed units through May was 93% lower than net absorption in the same period last year. Even in the COVID-affected 2020, Class C managed to absorb almost 15,000 net units from January through May. Aside from 2020, the lowest value in recent years was the roughly 41,000 net units in 2019.
Similarly, last year’s almost 23,000 net absorbed Class D units for the period was followed up this year by a net loss of around 1,600 net leased units. This marked the only negative value of the last five years and, aside from 2020, the lowest total in that span had been the more than 17,000 net absorbed units in 2019.
The reduction in new supply was not enough to offset the demand decline, but the average occupancy loss was mitigated to the tune of 0.3% to end May at just over 93%. No market lost more than the 2.8% decline in Tampa, thanks in part to seven new Class B properties being delivered in the period.
Due to average occupancy remaining higher than normal in light of reduced new supply, rent growth has maintained its torrid pace. A 5.3% gain through May in average effective rent for new leases was easily the highest of any recent year and brought the average Class B unit to almost $1,850 per month. Charlotte, Nashville, and Orlando closed the month in a three-way tie for Class B rent growth at more than 7%.
Classes C and D
Though the decreases in net absorption so far this year compared to last year were fairly stark in the top two price classes, they pale in comparison to Classes C and D. For the Class C subset, about 4,700 net absorbed units through May was 93% lower than net absorption in the same period last year. Even in the COVID-affected 2020, Class C managed to absorb almost 15,000 net units from January through May. Aside from 2020, the lowest value in recent years was the roughly 41,000 net units in 2019.
Similarly, last year’s almost 23,000 net absorbed Class D units for the period was followed up this year by a net loss of around 1,600 net leased units. This marked the only negative value of the last five years and, aside from 2020, the lowest total in that span had been the more than 17,000 net absorbed units in 2019.
To learn more about the data behind this article and what ALN Apartment Data has to offer, visit https://alndata.com.


Sign up to receive our stories in your inbox.
Data is changing the speed of business. Investors, Corporations, and Governments are buying new, differentiated data to gain visibility make better decisions. Don't fall behind. Let us help.


Sign up to receive our stories in your inbox.
Data is changing the speed of business. Investors, Corporations, and Governments are buying new, differentiated data to gain visibility make better decisions. Don't fall behind. Let us help.