
Latin America, home to some of the most urbanized cities in the world, is one of the fastest growth spots for ride-hailing. Traffic congestion, limited public transport infrastructure make it difficult to cope with peak demand during morning commute times in large cities like Sao Paulo, Mexico City and Bogota.
Amidst the intense rivalry amongst ride hailing companies in Latin America, Measurable AI’s transactional e-receipt panel reveals that Uber and 99 (owned by Chinese ride-hailing company Didi Chuxing) are the major rivals in these two markets.
Let’s prod further to see what consumer insights can be unearthed from our granular dataset.
Who is Winning Market Share in Brazil and Mexico?
First, let’s take a look at what Measurable AI’s e-receipt consumer panel reveals about market share between Uber and Didi’s 99. For Brazil, our insights reveal that Uber is winning, owning roughly 65% of market share versus the 35% occupied by Didi for 1Q22.1
Turning to the ride-hailing scenario for Mexico, Didi leads Uber, owning about 56% and 44% market share respectively as of 1Q22.
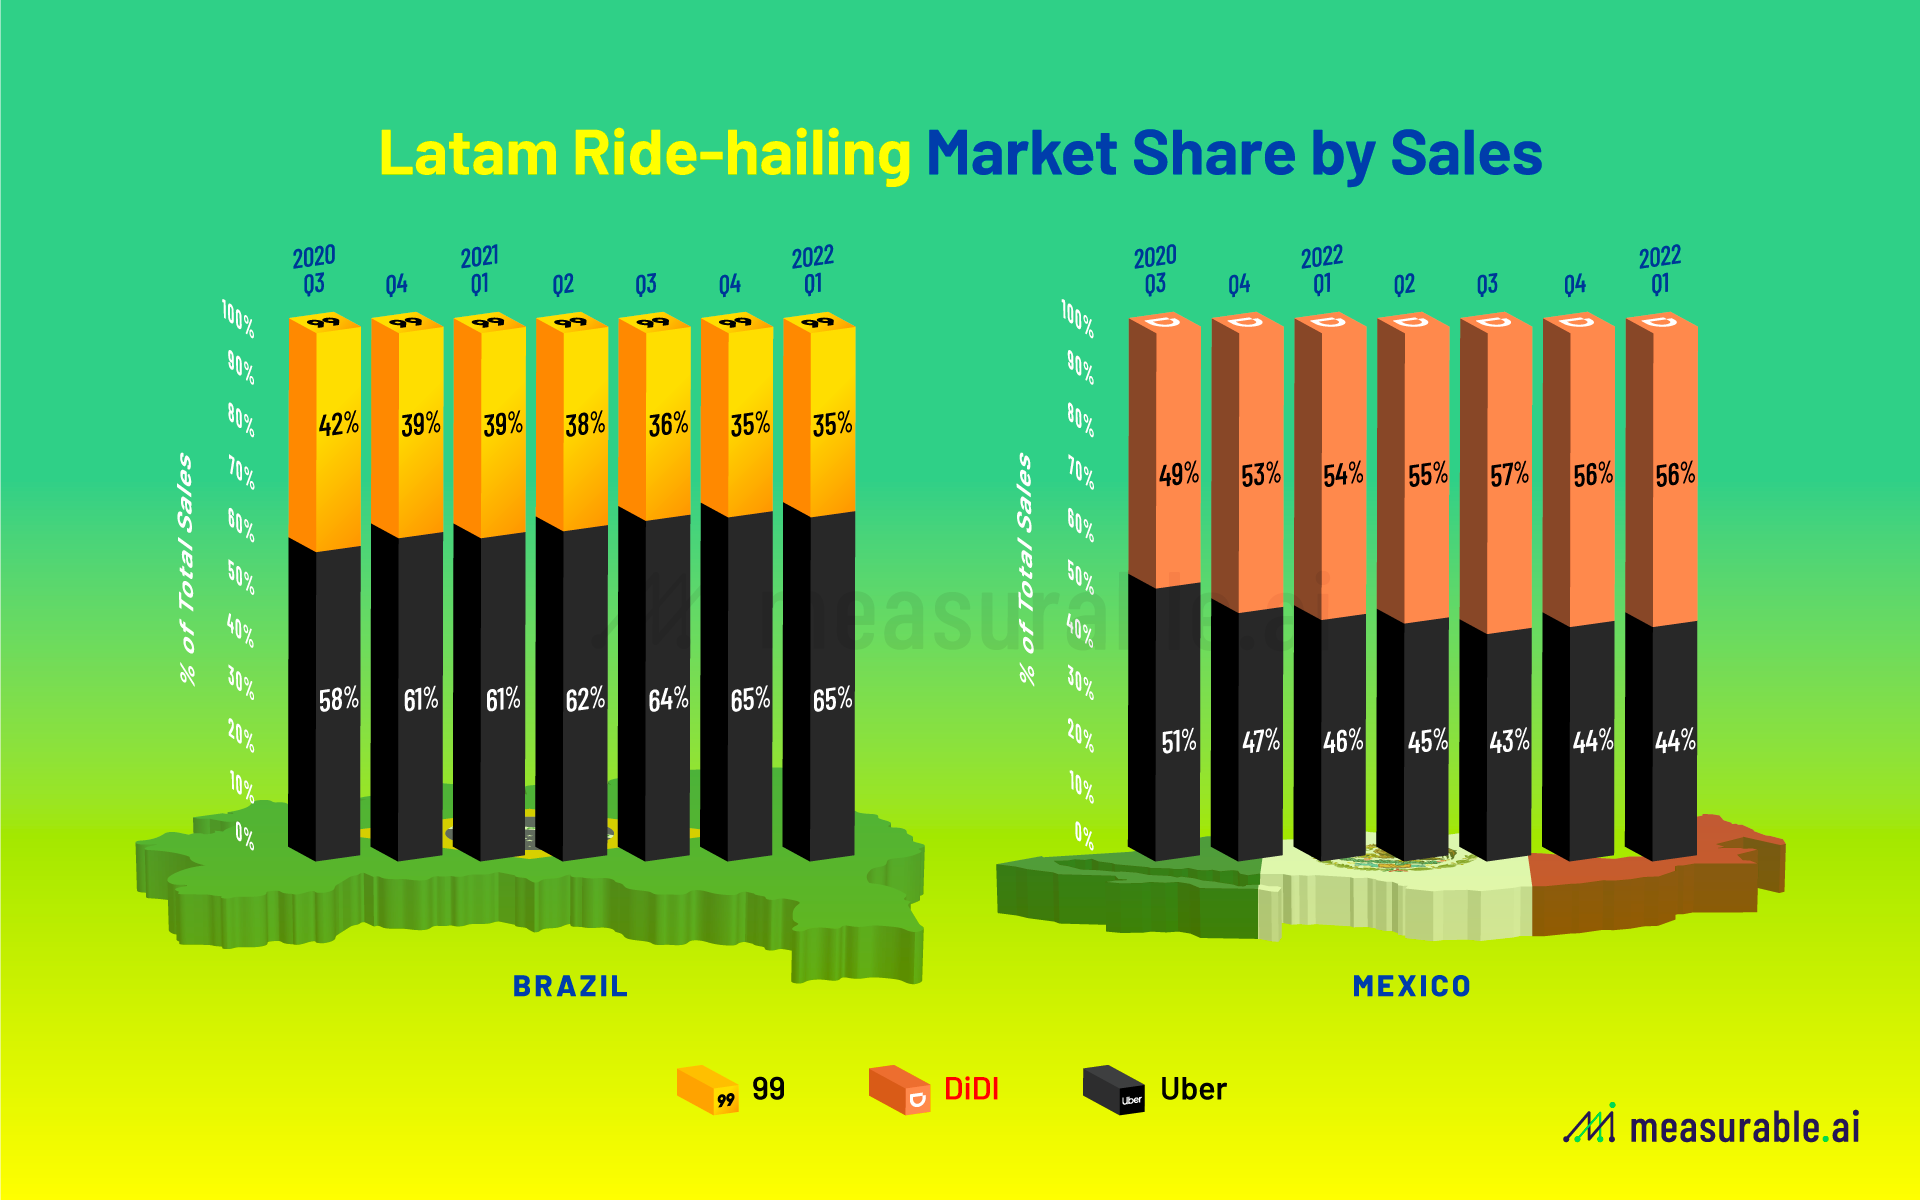
Measurable AI: Latam Ride-hailing Market Share by Sales; *Estimated Sales in this chart are based on metrics “total price”, the dollar amount of each order before promotions and discounts, captured from Measurable AI’s transactional e-receipts consumer panel.
Which City Within Brazil and Mexico Accounts For the Most Rides?
Brazil is Uber’s biggest market outside of the US, with over 600,000 drivers serving 100+ cities in the country. Sao Paulo is Uber’s busiest city in the world, which together with NY, LA, Chicago and London account for 22% of bookings worldwide. As for the busiest city in Mexico where most Uber and Didi rides were ordered, Measurable AI’s granular dataset reveals that Mexico city takes the lead.
As gleaned from Measurable AI’s e-receipt panel in 2022 for Latin America, around 17% of Uber rides and 12% of 99 rides in Brazil originate from Sao Paulo. For Mexico, roughly 24% of Uber rides and 18% of 99 rides in Mexico originate from Mexico city.
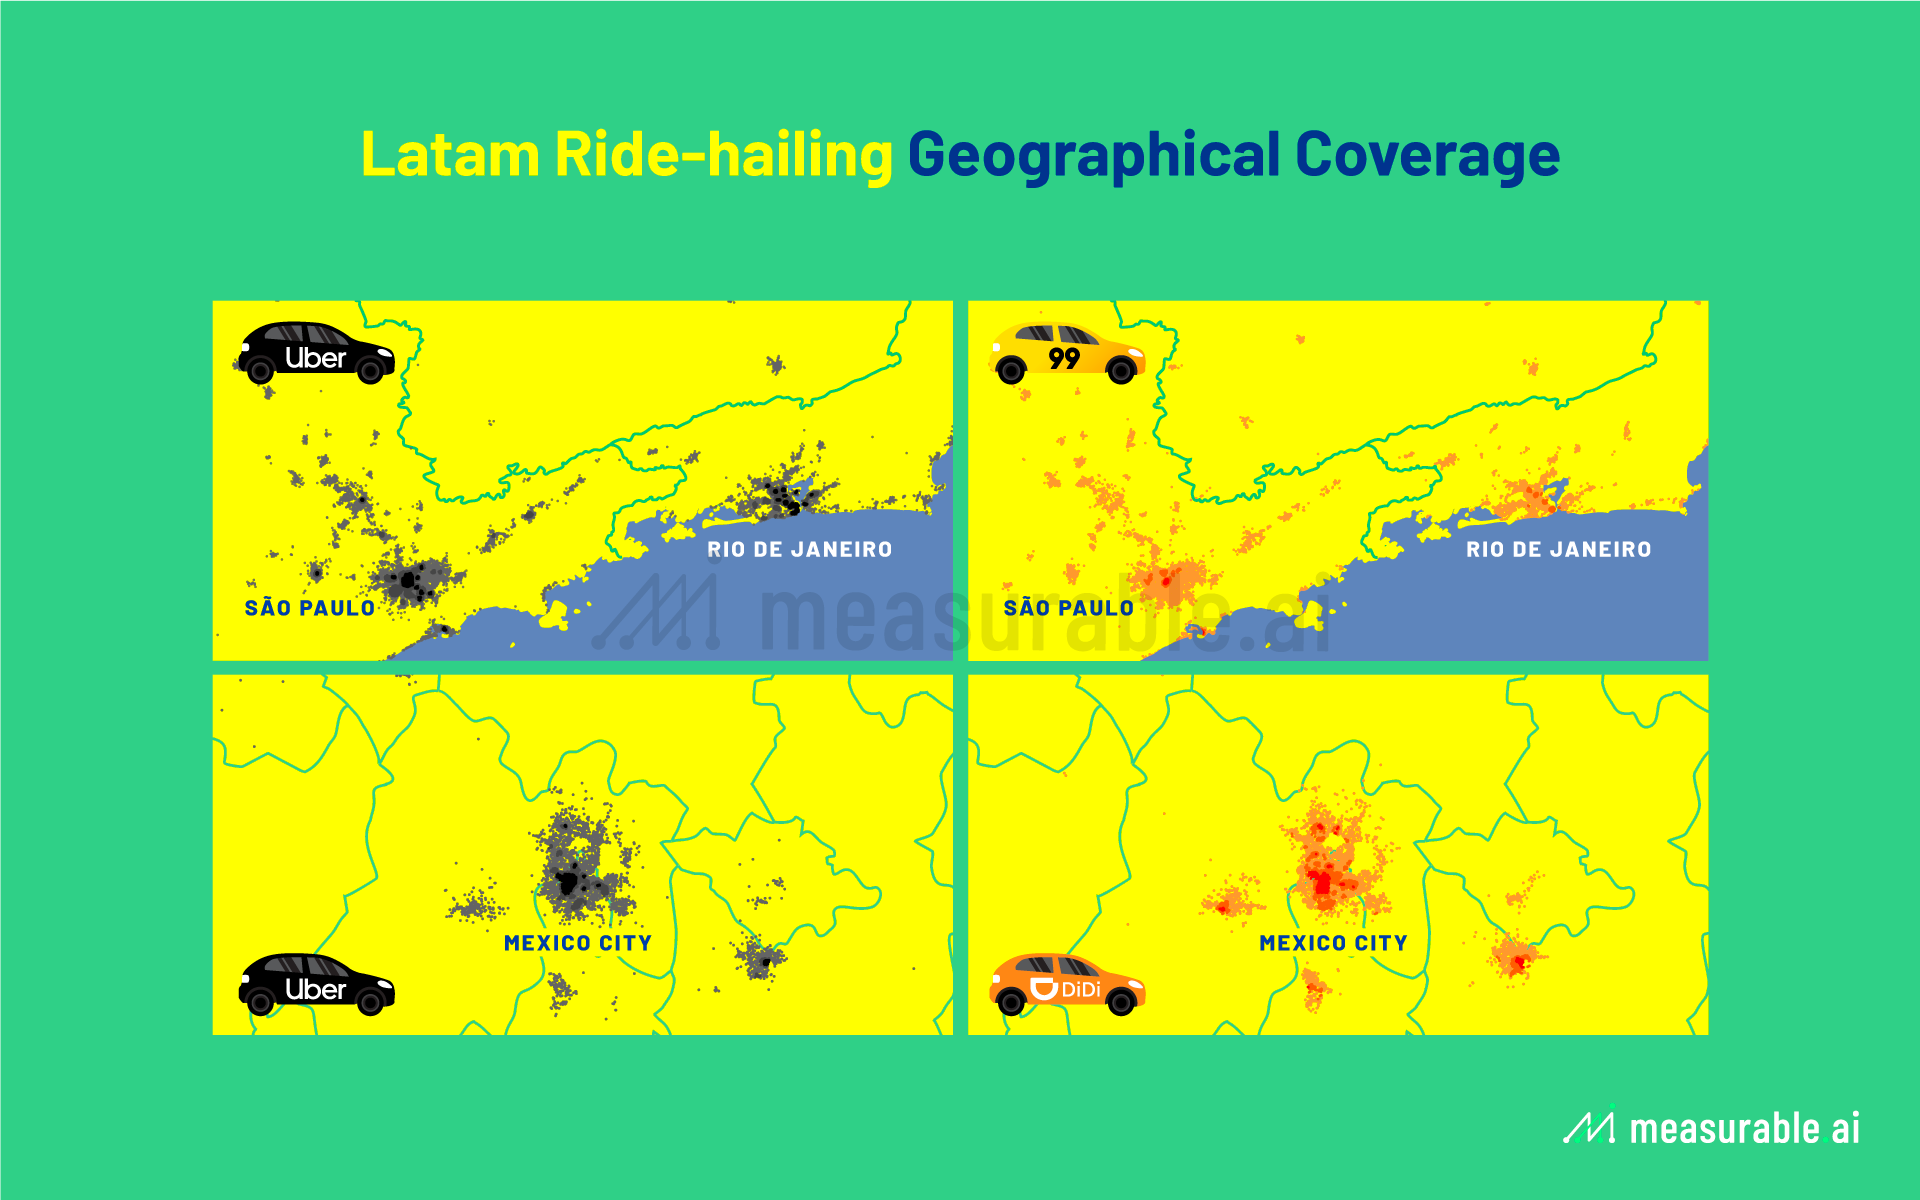
While monthly completed trips in Brazil for Uber and Didi’s 99 are not publicly disclosed, they are believed to have 28 million active users combined – approximately 90% of the Brazilian population. In terms of the number of drivers, it is estimated that 99 has 750,000 active drivers compared to Uber’s over 600,000.
How Much is the Average Ride-hailing Trip in Brazil and Mexico?
How much does the average rider in Brazil and Mexico spend per ride when it comes to ride-hailing services? As of March 2022, Measurable AI’s e-receipt panel reveals that the average ride cost in Brazil and Mexico works out to be roughly BRL $92 (~USD $17.5) and MXN $385 (~USD $19.2).
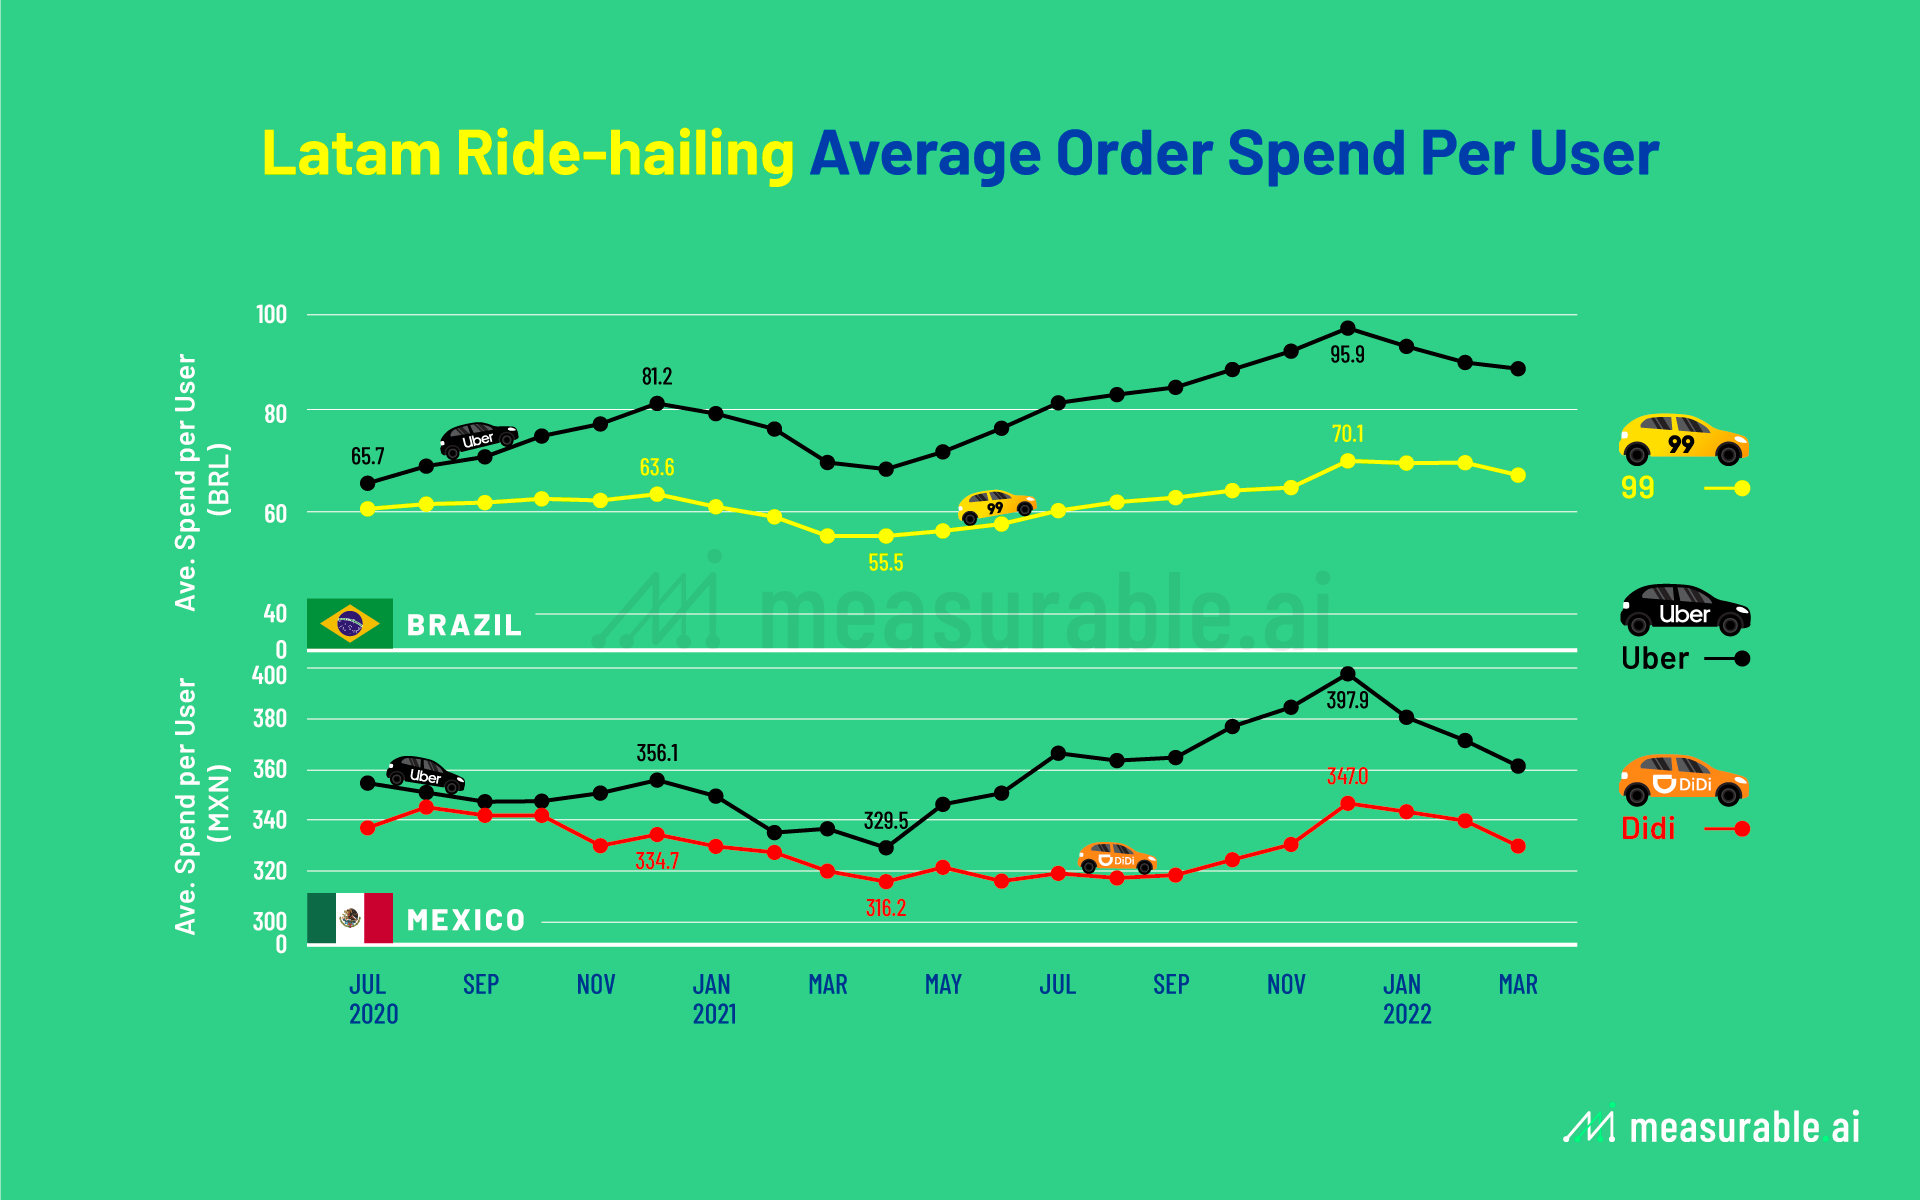
Interestingly enough, as can be seen from the chart above, there is a sharp surge in prices for both Uber and 99 throughout 2021 when it comes to the average spend per user.
From Measurable AI’s Brazilian panel, by year end 2021, the monthly average spend per user for Uber and 99 increased by 18.1% and 10.3% respectively when compared to year end 2020. When it comes to our Mexican panel, the monthly average spend per user for Uber increased by 11.6% when compared to year end 2020, reaching a year end peak of around USD $19.2. For 99, the price increased by 3.7%, reaching a year end peak of USD $17.4. This begs the question, what is driving the peak in prices throughout 2021?
The steep rise in prices may be largely attributable to the rising fuel costs which account for the largest portion of Brazil’s inflation. As of October 2021, prices have increased 40% from a year ago. As such, this has caused many drivers to quit. According to Sao Paulo’s Association of App Drivers (Amasp), 25% of drivers for both Uber and 99 have quit since the start of the pandemic.
Another headwind facing Uber and 99 are the shortage of cars. Most motorists in Brazil actually don’t own their vehicles and rental companies have hiked rates due to the shortages of cars. Teros, a consultancy in Sao Paulo, estimates that rental agencies have increased prices over 20% this year.
Do Riders Prefer Didi or Uber Depending on How Long Their Commute Is?
Do Latin American riders exhibit preferential treatment towards one ride hailing company over the other depending on the distance of their journey?
We explore this by splitting our sample of riders into two groups: overlapped versus non-overlapping riders. Overlapping riders are defined as riders in our panel who have chosen to book a ride on both Uber and 99 across 2021. From Measurable AI’s 2021 dataset for Brazil and Mexico, we came up with the following findings.
Non-overlapping Riders
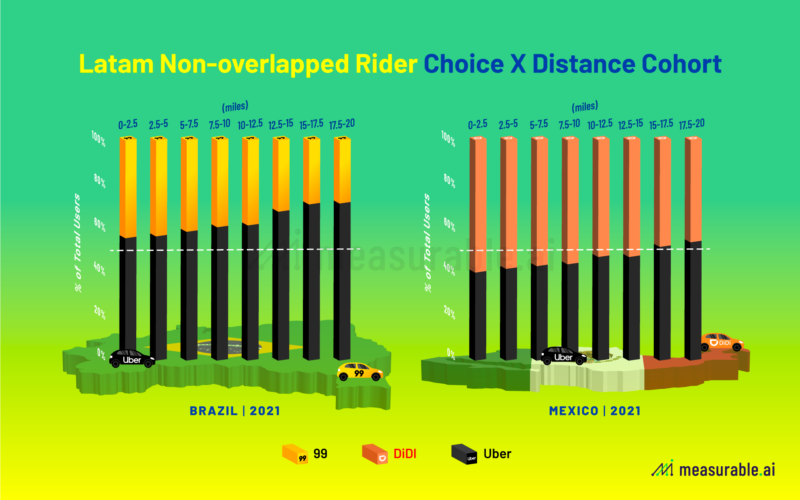
For the Brazil market, the choice to opt for Uber over 99 is positively correlated with the distance of the journey. The longer the commute, the more likely it is for Brazilian riders to choose Uber over 99. While for the Mexico market, the choice to opt for DiDi’s 99 over Uber is more noticeable for short commutes that are 15 miles or less.
Let’s look at the average number of rides a typical Uber or 99 ride-hailing customer books on a weekly basis in Brazil and Mexico. For Brazil, our panel reveals that Uber registered 2.6 orders per rider while 99 clocks in at 2.5 orders per rider (a close tie indeed!). While for Mexico, our dataset shows that the average rider there books 2.2 Uber rides and 2.5 Didi rides a week on average.
Overlapping Riders
We now look into the cohort of overlapping riders (i.e. those in our panel who have ridden both a Uber and Didi ride). For Brazil, 17.6% of riders in our consumer panel chose to ride on both Uber and 99 whereas for Mexico, this figure was 15.8%.
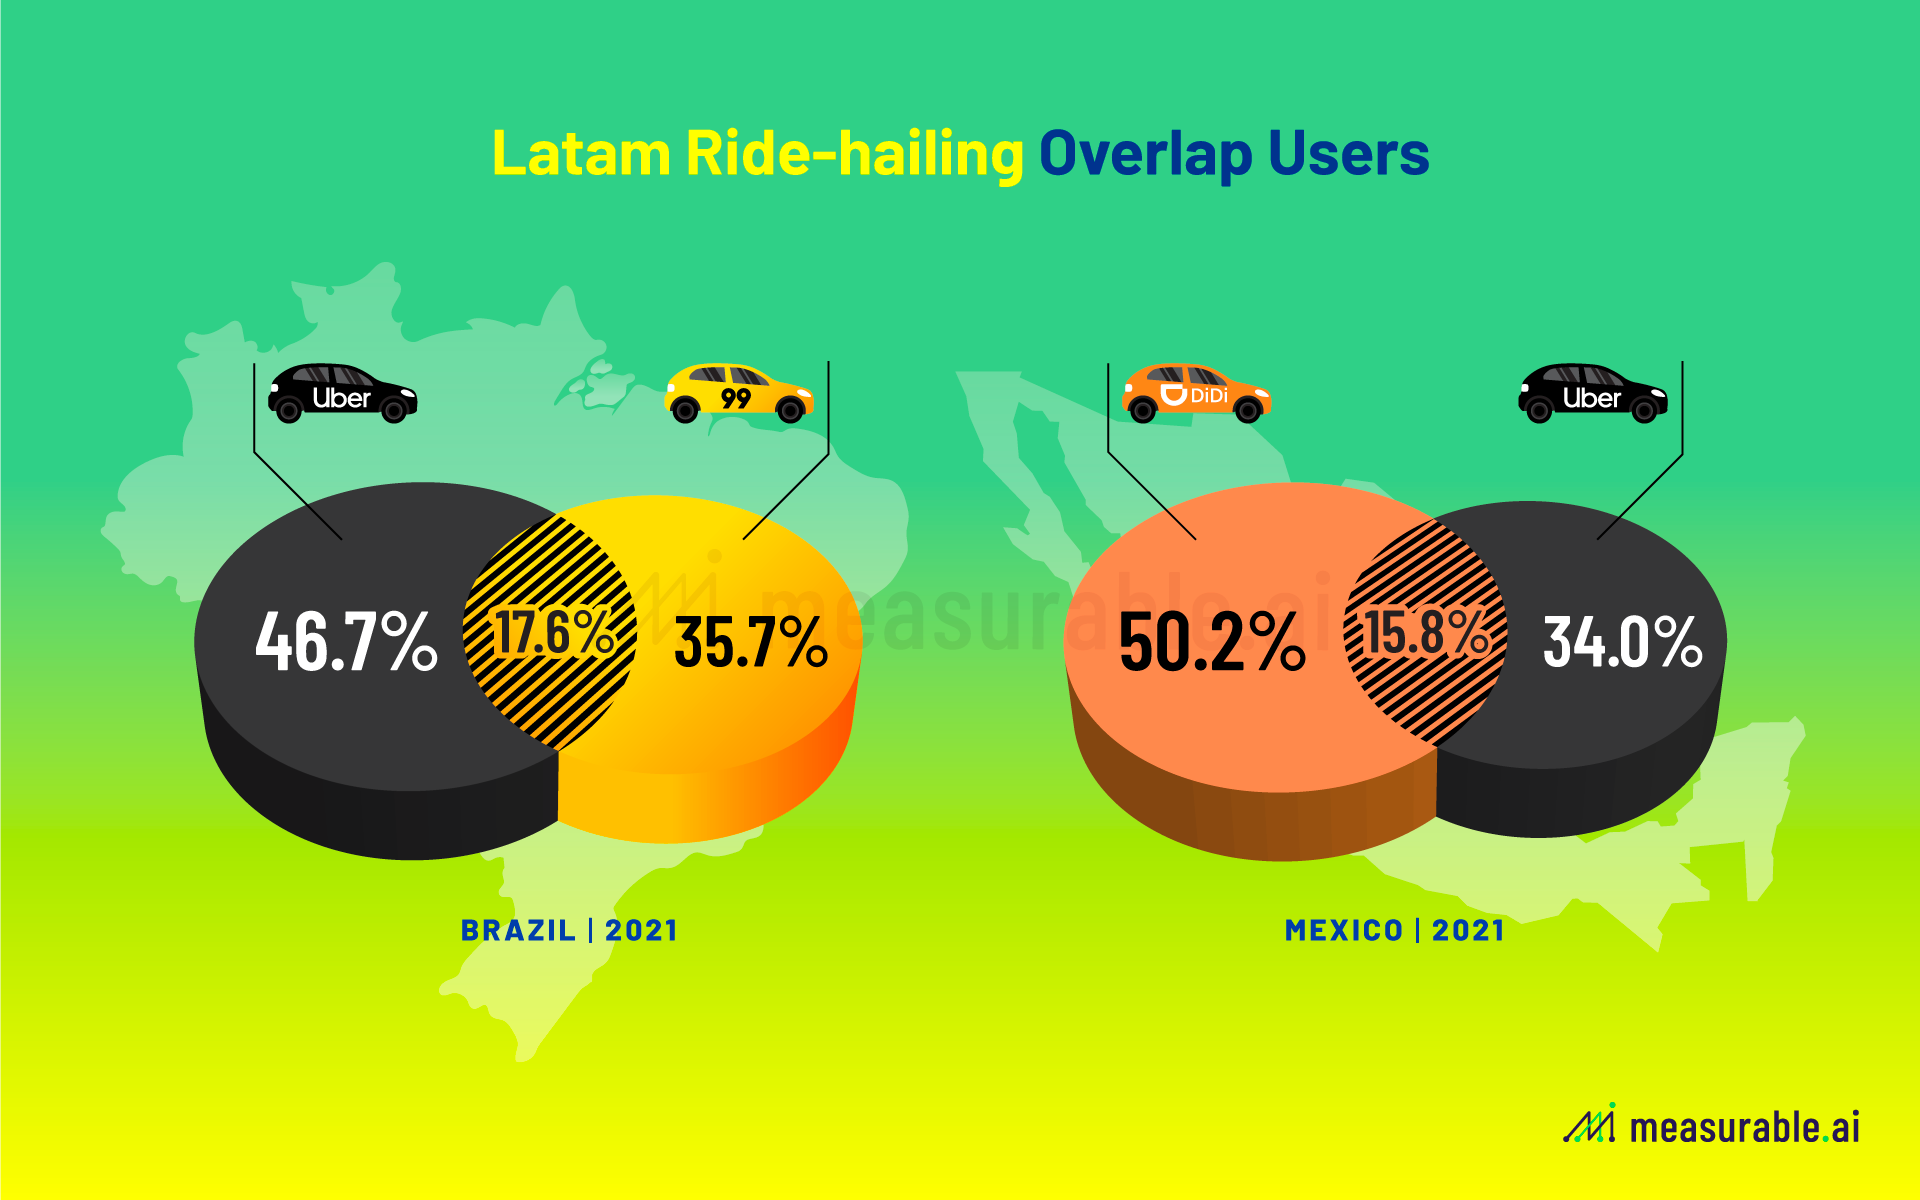
Turning to our cohort of overlapping riders from our panel, it’d be interesting to see how loyal are Latinos’ to the ride-hailing companies Uber vs. Didi. Do they have a preferred ride-hailing company that they vehemently stick to or are they flexible when it comes to choosing which ride-hailing app to ride with?
From Measurable AI’s LatAm dataset for 2021, it seems that amongst our panel overlapping riders, these riders exhibited a preference for Uber: Uber registered 2.8 orders per rider while 99 registered 2.5 orders per ride a week on average.
Turning to our Mexican e-receipt dataset, our panel overlapping riders reveals that those who choose to ride on both platforms preferred Didi for shorter commutes (5 miles or less) while for longer commutes they exhibited a preference for riding with Uber. In terms of the average number of orders per rider, DiDi and Uber registered 2.6 and 2.2 respectively a week on average.
Which Car Type is Most Popular Amongst Uber and 99 in Latin America?
For Brazil and Mexico, an Uber or 99 ride-hailing app ride is usually cheaper than a taxi, especially if the journey is long. It’d be interesting to see which type of cars within the two services are the most popular in both countries and how this stacks up along with the pricing.
From Measurable AI’s LatAm dataset, we found that UberX, 99pop, and DiDi-Express were the most popular in both Brazil and Mexico. Prodding further, we came up with the following findings on pricing for the major types of car in the first 10-mile cohort.
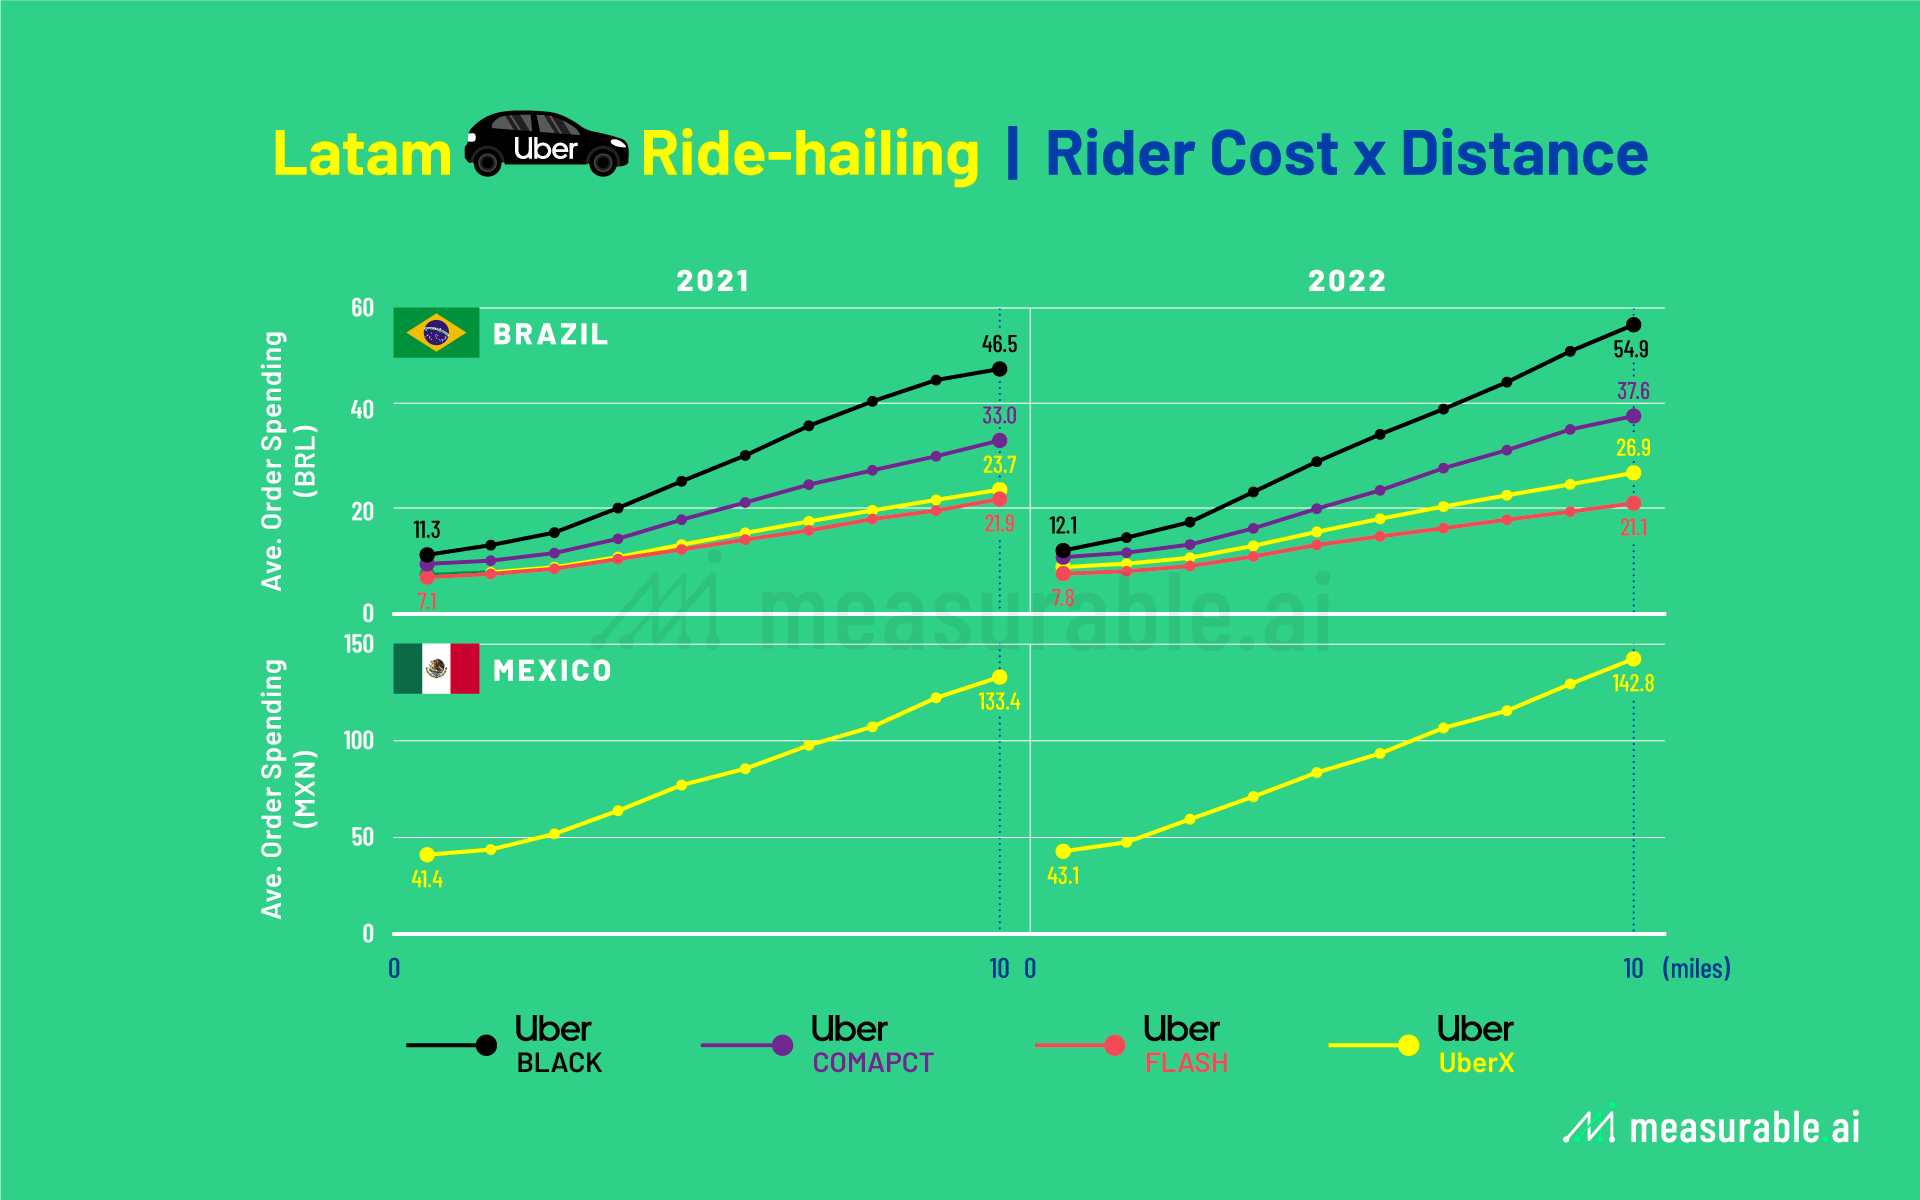
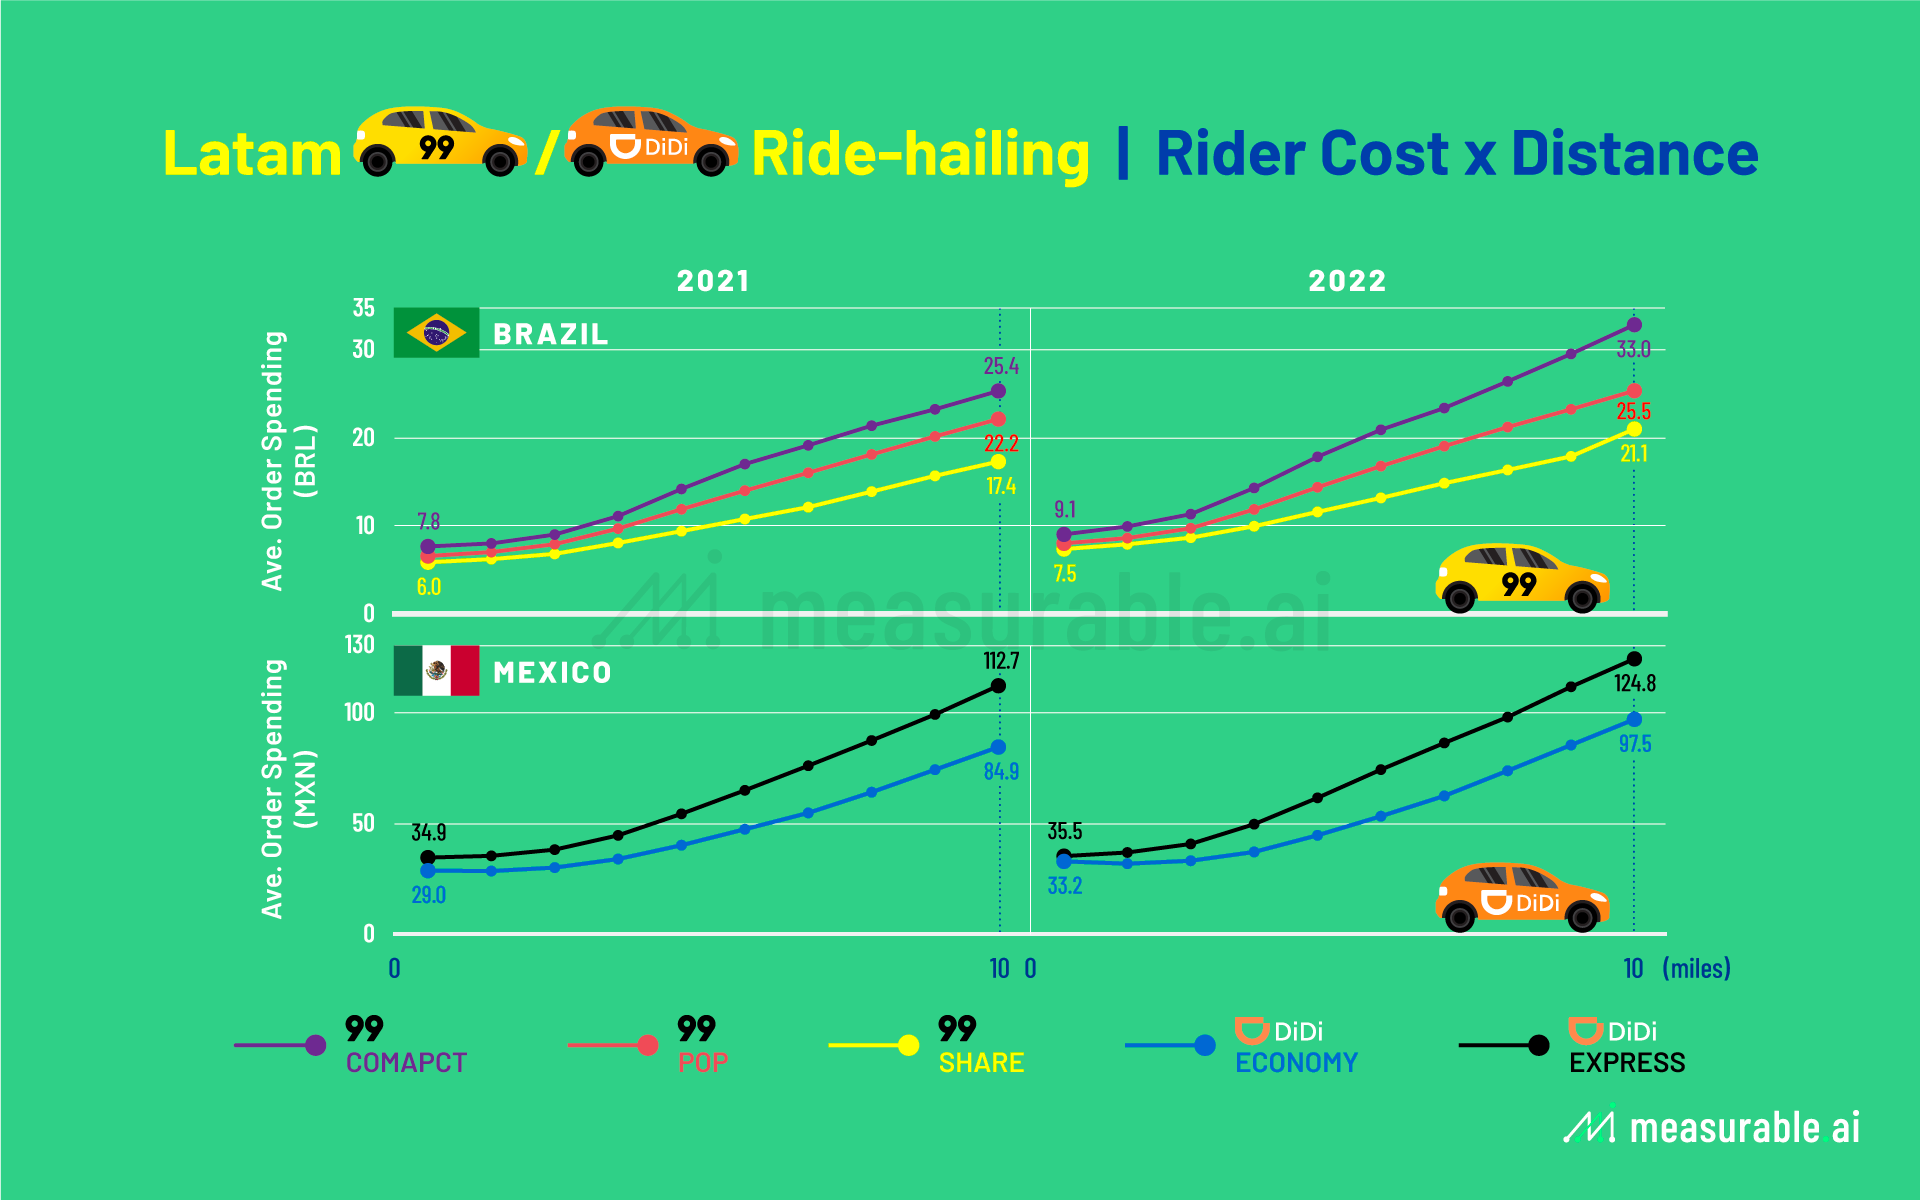
As can be seen, the prices of riding with either of the two platforms in 2022 increased quite significantly from a year ago in 2021. This was particularly the case for Uber Black and 99 Comfort in Brazil whereby prices hiked by some whopping 19% and 30% YoY respectively for the long commutes (~ 9 miles). As explained earlier, this could largely be attributable to the rising oil prices and shortage of cars experienced throughout 2021.
Latin America is a key growth area for ride-hailing companies. The growing urban population, poor urban planning and limited mobility are the major drivers underpinning the growth of the market. The total regional population in Latin America will exceed 660 million, 82% of which will be living in cities.


Sign up to receive our stories in your inbox.
Data is changing the speed of business. Investors, Corporations, and Governments are buying new, differentiated data to gain visibility make better decisions. Don't fall behind. Let us help.


Sign up to receive our stories in your inbox.
Data is changing the speed of business. Investors, Corporations, and Governments are buying new, differentiated data to gain visibility make better decisions. Don't fall behind. Let us help.


