The return of pumpkin-themed menu items signals the arrival of fall in the coffee space. Over the years, everything from pumpkin spice lattes to pumpkin muffins have gained a massive following. We dove into the foot traffic data for two leading QSRs – Starbucks and Dunkin’ Donuts – to take a closer look at how the launch of fall menu items drove visits to the chains.
Show Me the Pumpkin
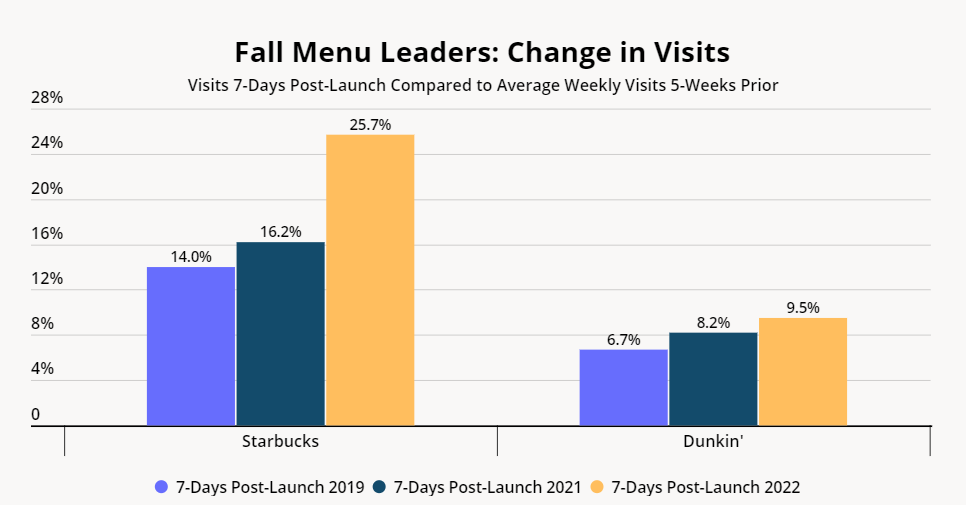
To analyze the impact of Dunkin’s and Starbucks’ fall menu launches, we compared each chain’s average visits in the five weeks prior to its fall menu launch to visits in the seven days post-launch. In 2019, 2021, and 2022, visits to the chains spiked in correlation with the fall-themed menu releases. And foot traffic increased with each subsequent comparison, indicating that fall menus grew in popularity from year to year. A number of factors contributed here including the dissipating impact of inflation, the back to school season and more, but the PSL impact stood out.
Compared to the previous five-week visit average, Starbucks’ fall menu launch on August 30, 2022 increased foot traffic to the chain by 25.7% in the first seven days. In 2021 the menu launch increased foot traffic by 16.2% and in 2019 the launch drove a 14.0% increase in visits.
Dunkin’ had similar success with its fall menu releases. Compared to the previous five-week visit average, Dunkin’s fall menu launch on August 17, 2022 increased foot traffic to the chain by 9.5% in the first seven days. In 2021 and 2019, the menu launch increased foot traffic by 8.2% and 6.7%, respectively.

Pumpkin Power
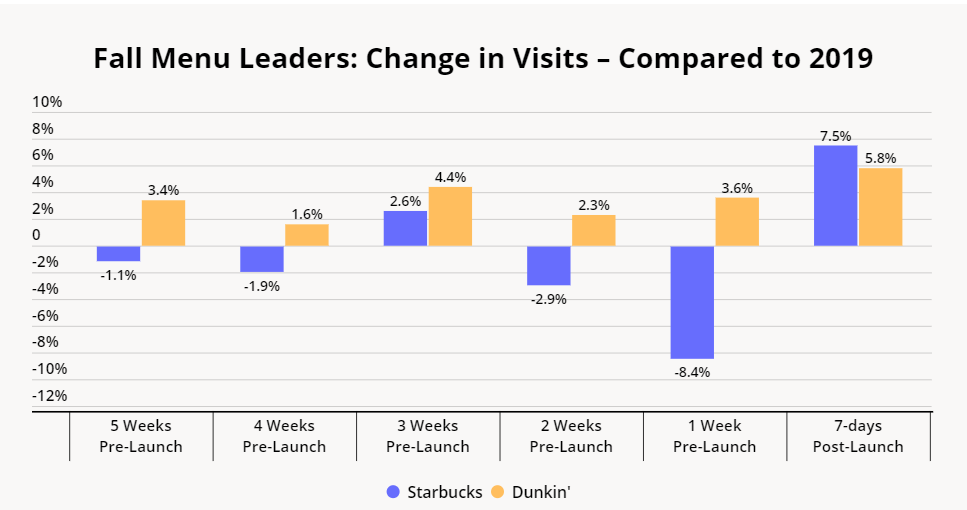
For all of the turbulence in the coffee space since the onset of the pandemic, the fall menu releases were a foot traffic catalyst for both Dunkin’ and Starbucks in 2022. Year-over-three-year (Yo3Y) visit growth for the chains in the first seven days after the fall menu launch in 2022 outperformed the same post-launch period in 2019.
The seven days after the fall menu launched in 2022 helped close the previous week’s -8.4% Yo3Y visit gap for Starbucks – its widest visit gap of the five-week period – as the chain’s Yo3Y visit growth rose to 7.5% in the seven days post-launch. Dunkin’s Yo3Y visit growth of 3.6% the week prior to the chain’s fall menu launch rose to 5.8% in the seven days post-launch.

Pumpkin Peaks
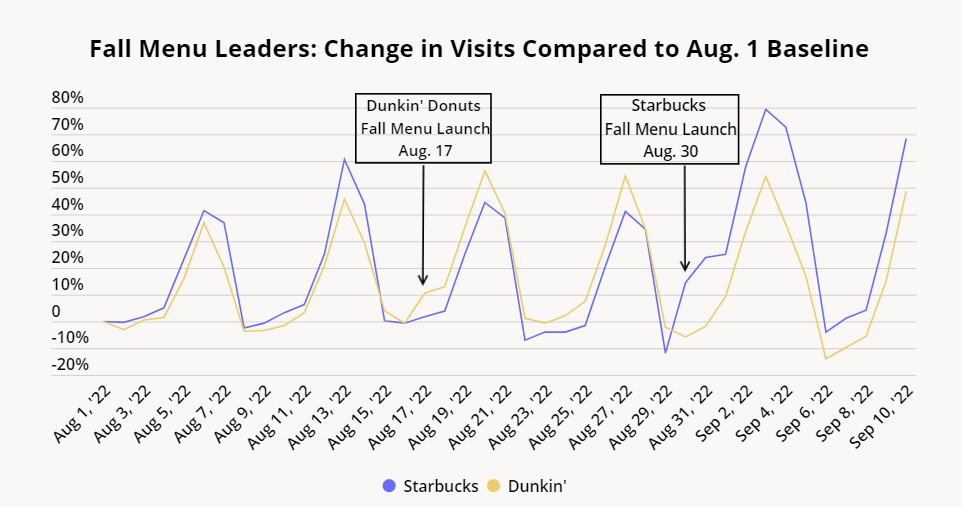
Analysis of visits to Dunkin’ and Starbucks compared to an August 1, 2022 baseline revealed the impact of the fall menu launches on daily foot traffic. Each menu release drove foot traffic to the respective chain in the days following the launch.
Between August 1 and August 17, 2022 – the release date of Dunkin’s fall menu lineup – Dunkin’s daily visits rose by 10.6% and surpassed Starbucks’ change in visits over the same period (+1.6%). Dunkin’s baseline visits change peaked over the weekend following the launch, rising to 56.3% on August 20, 2022.
On August 30, 2022, the date Starbucks released its fall menu, the chain’s visits compared to the August 1, 2022 baseline rose to 14.6% while Dunkin’s fell to -5.7% in comparison to the baseline. Starbucks’ baseline visits change peaked over the weekend following the launch, rising to 79.5% on September 3, 2022.

Pumpkin Takeaways
It’s clear that while it may still feel like summer, consumers couldn’t wait to get their hands on fall flavors. Foot traffic in the wake of 2022’s fall menu releases boomed, kicking off a strong season for Dunkin’ and Starbucks.
To learn more about the data behind this article and what Placer has to offer, visit https://www.placer.ai/.


Sign up to receive our stories in your inbox.
Data is changing the speed of business. Investors, Corporations, and Governments are buying new, differentiated data to gain visibility make better decisions. Don't fall behind. Let us help.


Sign up to receive our stories in your inbox.
Data is changing the speed of business. Investors, Corporations, and Governments are buying new, differentiated data to gain visibility make better decisions. Don't fall behind. Let us help.


