
The types of homes sold shifted in July, which also pushed down the median sales price
Home price appreciation dropped in July for the first time since December 2018, ending a 40-month streak of growth. But depending on the statistic referenced, this decline could be considered either an extreme or minor correction.
One of the most widely-cited industry metrics for home price changes is the median sales price, which determines trends based on the midpoint of all houses sold in a given market. By contrast, repeat sales indexes, such as CoreLogic‘s Home Price Index (HPI) and the CoreLogic S&P Case-Shiller Index, measure appreciation based on the difference between the price of a home now versus its previous sale.
Repeat sales statistics more accurately measure appreciation, and July data demonstrates how using the median sales price can skew commentary and assumptions about real estate market trends.
Figure 1: MOM HPI and Median Price Changes
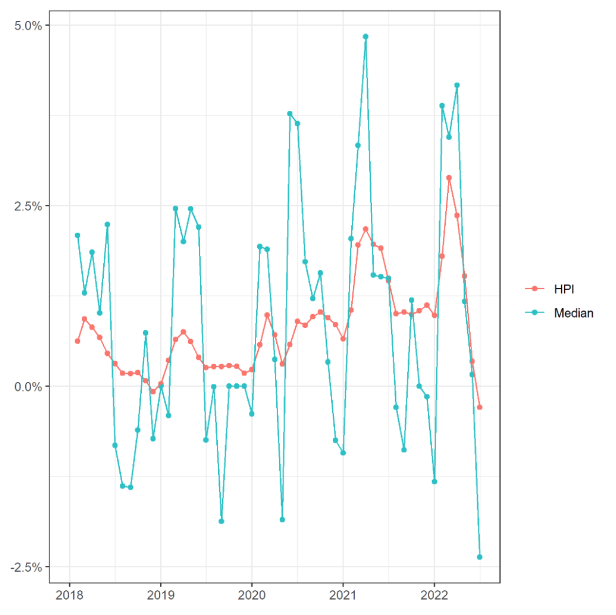
Figure 1 shows month-over-month changes in the HPI and median sales price since 2018, and both metrics show that July’s decline was exceptional. Although the decrease in the HPI was much smaller than the median, it was the only such decline during the month of July since 2010. The drop in the median sales price was the biggest since January 2016, when it declined by 3%.
Still, the large discrepancy between the two metrics demonstrates an important point: The housing market slowdown is due more to buyer adjustment in the types of homes purchased (or buyers leaving the market entirely) than it is because sellers are reducing prices, as the median sales price does not accurately account for the types of homes sold.
The median sales price’s broader lens includes movements in all price tiers of homes sold and does not isolate movements in an individual home’s price. CoreLogic’s HPI uses a repeat sales methodology that avoids this by comparing the most recent sales price of an individual home with its previous sales price.
Figure 1 illustrates the extreme seasonality in median price changes, with winter months registering declines of 1% to 2% every year. The HPI is also subject to seasonal movements but shows only minor dips each year.
The median sales price generally overstates seasonal patterns in real estate markets because the composition of sales changes greatly during winter months, with transactions moving away from more expensive suburban homes to smaller urban homes. Though demand does decrease in these months, the actual effect of seasonality is small since more sellers can wait for buyers to return in the summer instead of cutting prices to sell immediately. December 2021 underscores this point: The median says that prices dropped by 1.2%, but the HPI, which again records how much more (or less) a home sold for compared with its last sale, shows that prices actually rose by 1%.
Shifting back to July 2022 numbers, the reason the median sales price dropped more than the HPI is that the profile of homes purchased changed, with a shift to smaller properties in more affordable areas, which reflects decreased buyer budgets.
Figure 2 shows how far above or below the average square footage of a home purchase was relative to the typical purchase since 2018. The sharp drop in recent months is clear. People are buying smaller homes because of 2022’s rapid mortgage rate hikes, which has caused the average monthly payment to skyrocket. In July, the average home purchased was 30 square feet smaller than one that had typically sold in July in the same county.
Figure 2: Average Square Footage of Homes Purchased and Deviation From Monthly Average
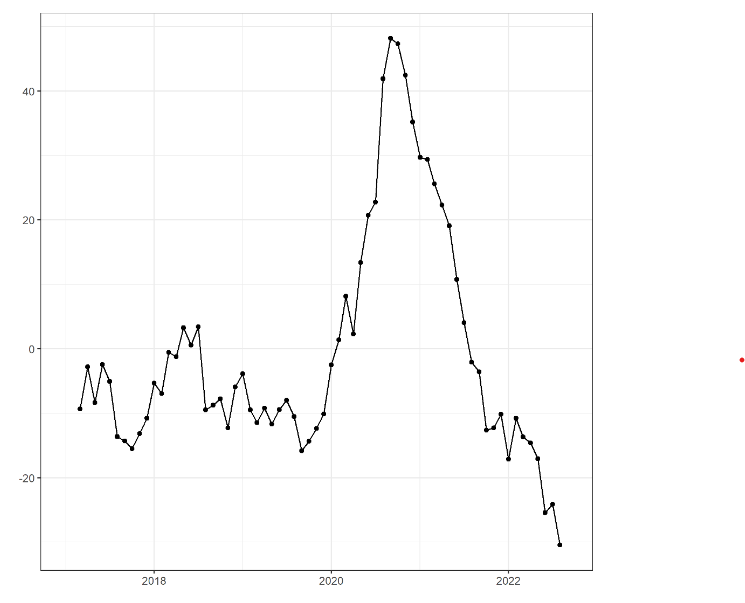
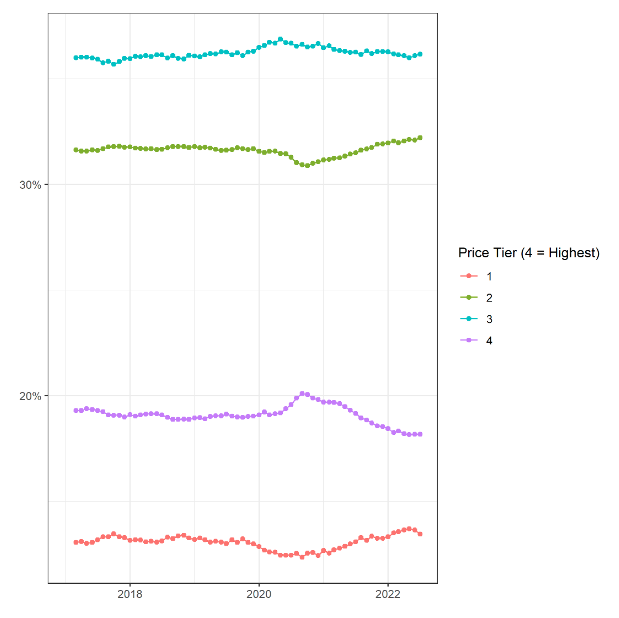
Figure 3 shows the deviation from monthly averages for purchase shares by price tier. Sales are calculated by ZIP code, with the most expensive 25% in a given metropolitan statistical area (MSA) classified as a “4” and the least-expensive 25% classified as a “1.” It is clear from this data that sales are transitioning to more affordable areas of the country. The most expensive areas have dropped off particularly, falling from 20% in mid-2020 to 18% today.
Figure 3: Share of Purchases by ZIP Code Price Tier (Seasonally Adjusted)
This is not to say that home price declines are not on the horizon, and they have already arrived in many areas of the U.S. The HPI did show drops in July of more than 2% in Western metros such as Boise, Idaho; Seattle; and San Jose, California. The CoreLogic HPI Market Risk Indicator projects that home prices in Boise are at a very high probability of a decline of 10% or more over the next 12 months. It is important to remember that when the market changes rapidly, the composition of sales also changes, leading to statistics like the median sales price often missing the mark. Indeed, the median prices in Boise, Seattle and San Jose all dropped by more than 5% in July, which suggests that price declines were around double what they actually were.
To learn more about the data behind this article and what CoreLogic has to offer, visit https://www.corelogic.com/.


Sign up to receive our stories in your inbox.
Data is changing the speed of business. Investors, Corporations, and Governments are buying new, differentiated data to gain visibility make better decisions. Don't fall behind. Let us help.


Sign up to receive our stories in your inbox.
Data is changing the speed of business. Investors, Corporations, and Governments are buying new, differentiated data to gain visibility make better decisions. Don't fall behind. Let us help.