Housing price declines are concentrated in higher-priced areas and are causing U.S. price levels to move closer together
Quick Takes:
Housing prices have increased for over a decade. Following the fallout from the 2000s housing crisis, which ended in July 2012, home prices have posted year-over-year increases every month. As prices appreciated, the spread in housing costs across the country grew further apart.
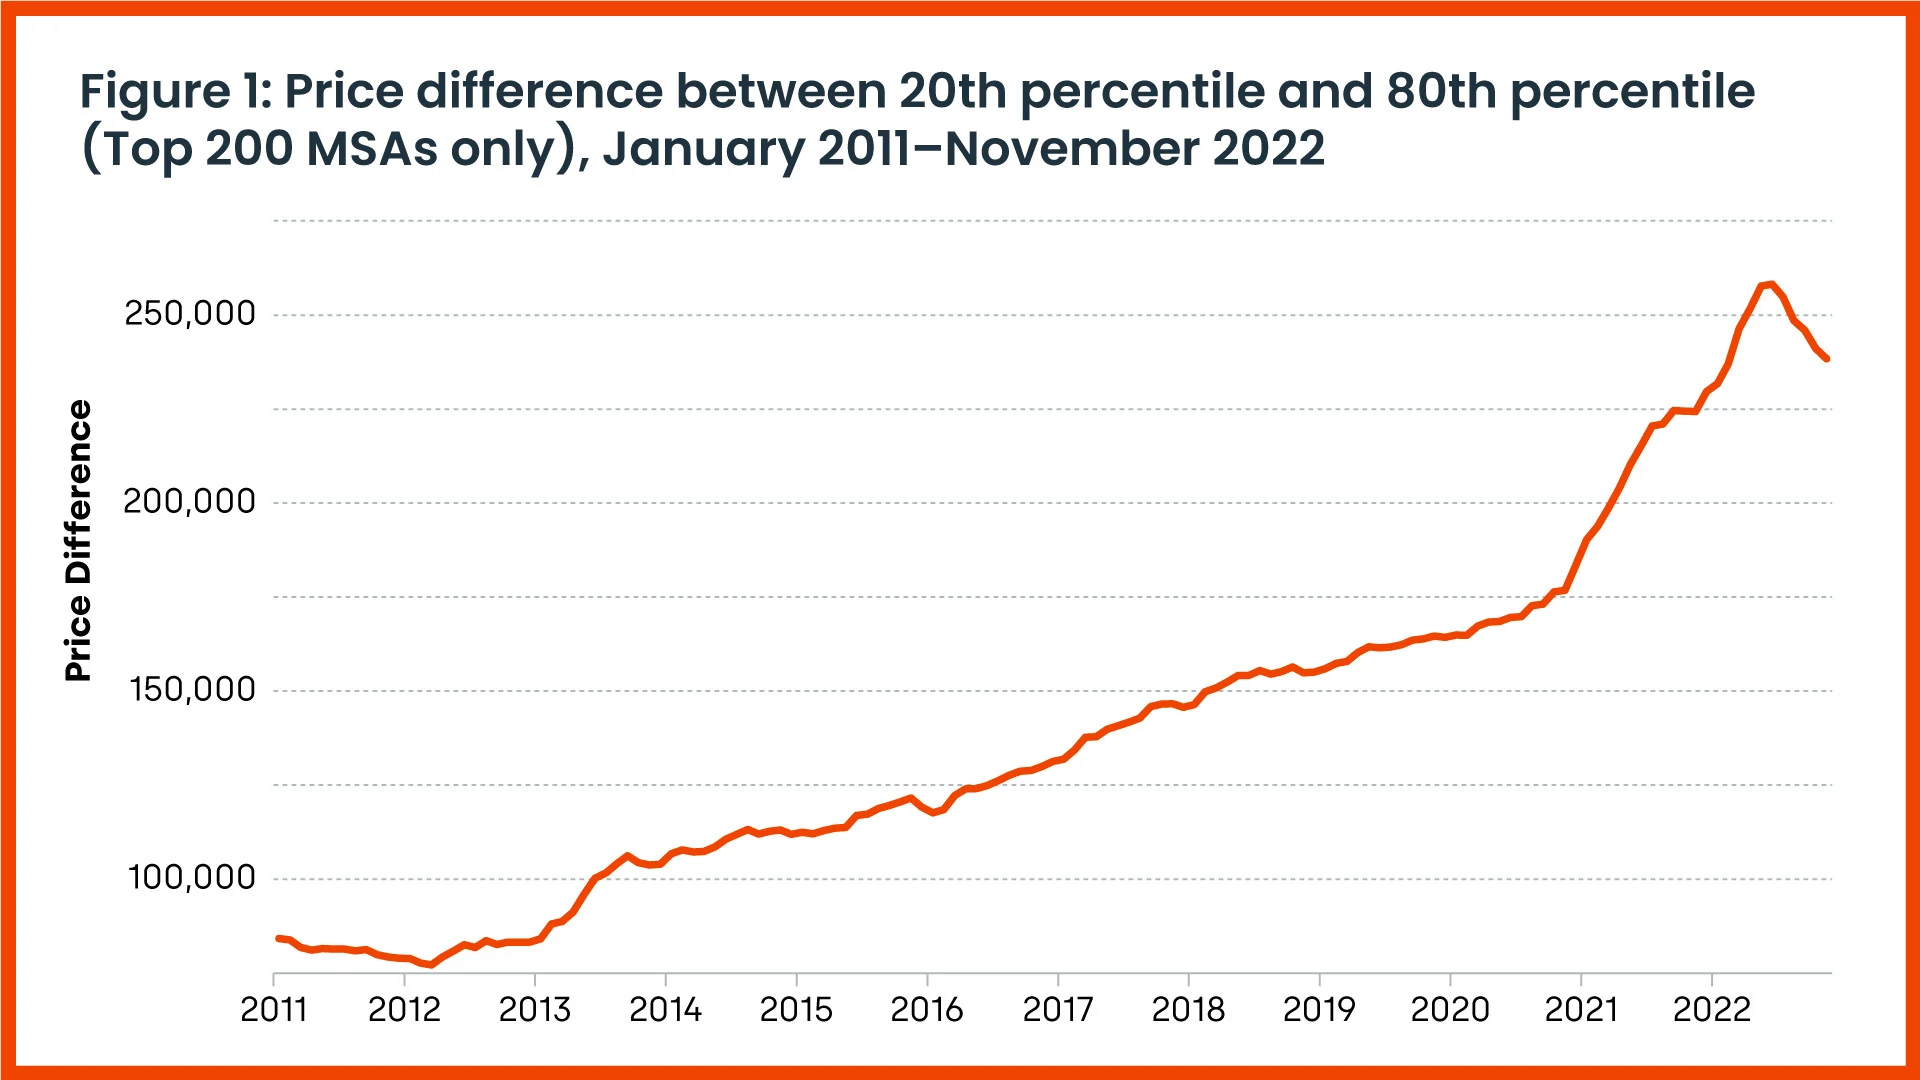
This level of dispersion hit an all-time high in July 2022, when the difference between the 40th most-expensive MSA and the 160th most-expensive MSA was $268,000. Since then, the home price spread between these two cities has shrunk to $238,000. Figure 1 shows the path of this price range and makes it clear that the housing price spread rises when home prices appreciate and falls when they depreciate.

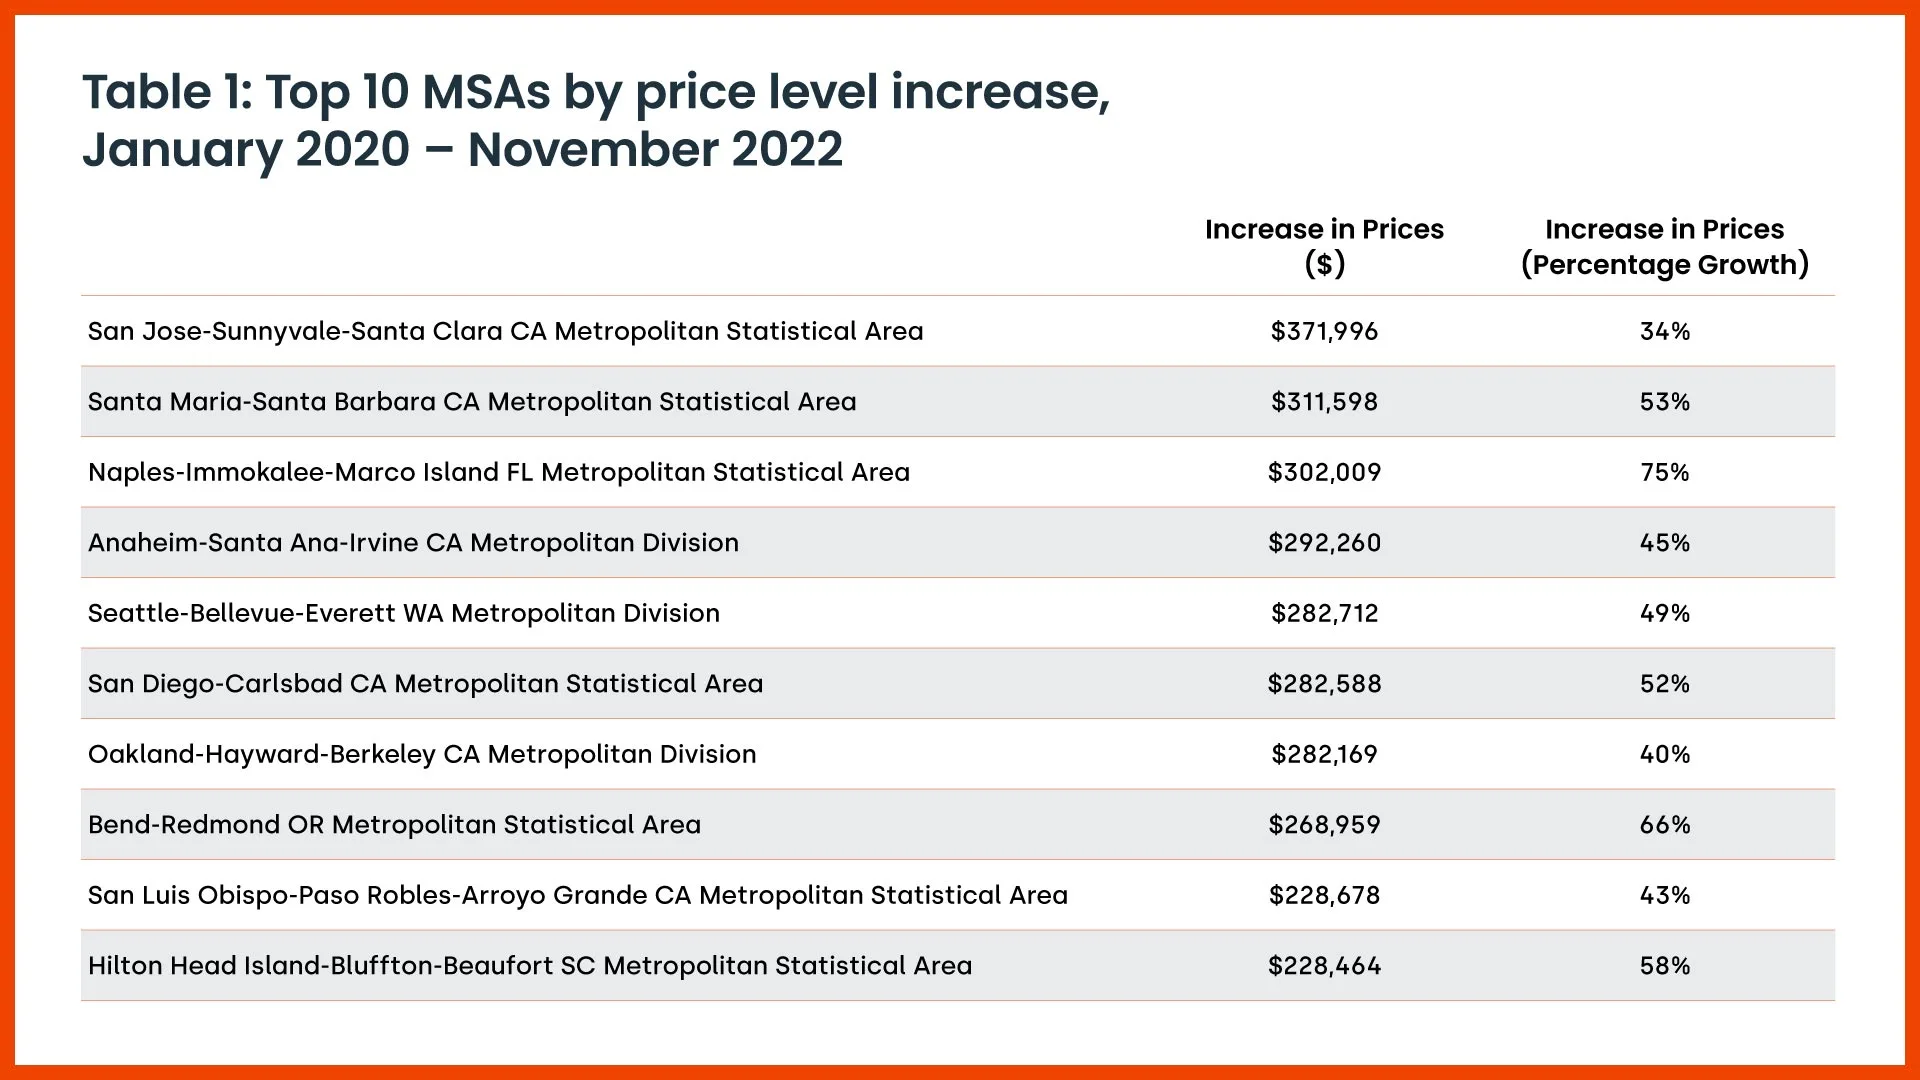
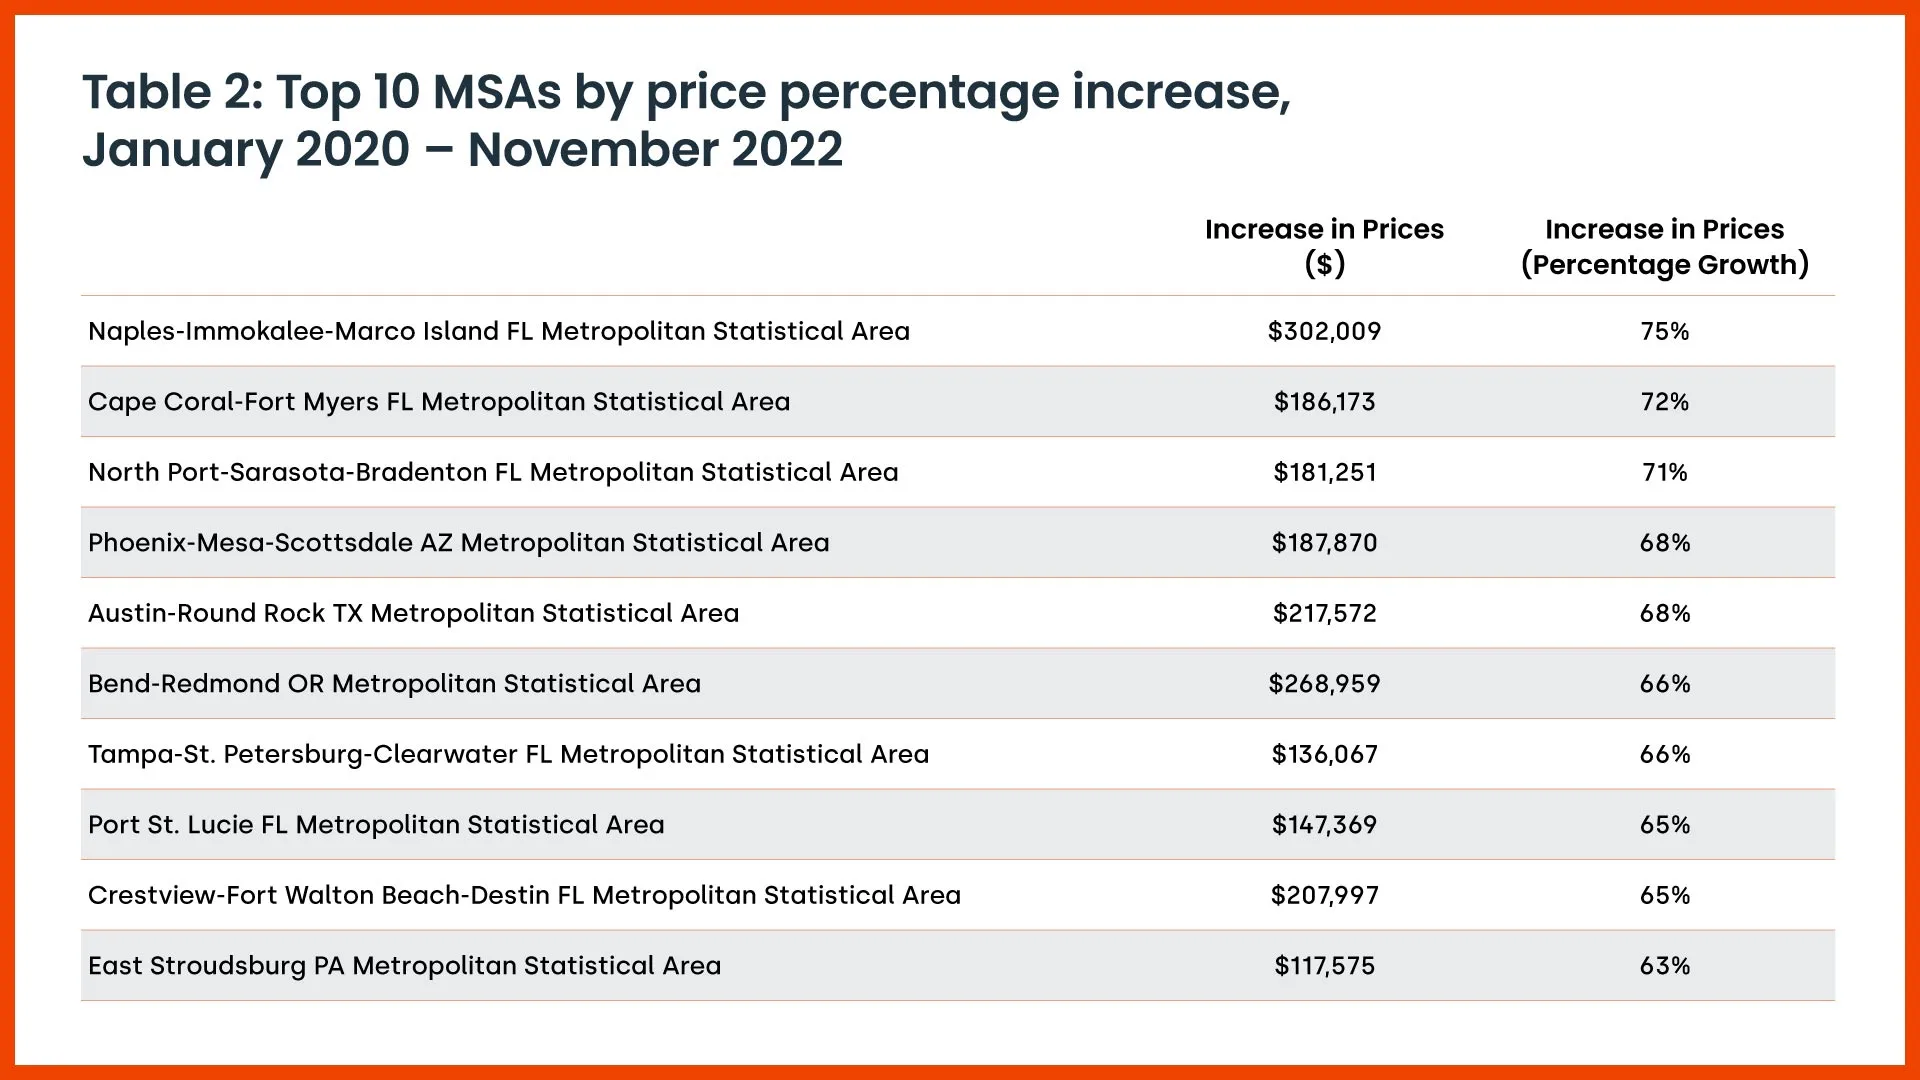
Tables 1 and 2 show why home prices stretched further apart. It is well documented that housing prices appreciated the most in many midpriced metros, such as Austin, Texas; Tampa, Florida; and Phoenix. This increase in home prices is attributable to an influx of homebuyers who migrated to less-dense locations with lower prices to take advantage of their new ability to work remotely.
However, price appreciation is typically reported in percentage terms rather than dollar terms. If we consider price appreciation from a dollar standpoint, the top markets for home price appreciation are somewhat different — and high-priced — areas in California like San Jose and Santa Barbara, which enter the top 10 rankings thanks to base prices that were already at a higher level than most other areas of the country. At the same time, these cities had lower growth in home prices on a percentage basis. Thus, the geography of the pandemic-era boom was not so different from the home price appreciation trend that has been ongoing since 2012, in that the most-expensive places in the country were stretching further from the cheaper areas.


The data clearly suggests that when home prices go up, the dispersion of prices across the country increases, and when home prices decline, dispersion shrinks. As prices begin to drop, the most notable declines are concentrated in some of the most-expensive areas of the country, bringing housing prices across the country closer together. This means that if the current pattern holds, we can expect to see more severe price drops in the most-expensive areas of the country.
To learn more about the data behind this article and what CoreLogic has to offer, visit https://www.corelogic.com/.


Sign up to receive our stories in your inbox.
Data is changing the speed of business. Investors, Corporations, and Governments are buying new, differentiated data to gain visibility make better decisions. Don't fall behind. Let us help.


Sign up to receive our stories in your inbox.
Data is changing the speed of business. Investors, Corporations, and Governments are buying new, differentiated data to gain visibility make better decisions. Don't fall behind. Let us help.


