Introduction
While the coronavirus’s short-term impact on the housing market has already started to materialize in the form of softening rents, the long-term implications for the urban landscape are still far from certain and being hotly debated. One of the biggest outstanding questions is the degree to which COVID will shift preferences away from cities. Over the past several months, many consider the close quarters associated with urban density to be a liability, and many of the local amenities that city-dwellers love are shut down in compliance with social distancing requirements. At the same time, there are indications that a shift towards remote work will outlast the pandemic, weakening the physical link between housing choice and employment opportunities.
This has led some to hypothesize an end to urbanization and a retreat to more affordable suburban and rural lifestyles. Anecdotal stories abound, but hard data on these trends remains scant. We hope to inform the conversation with a new analysis of recent search behavior on the Apartment List marketplace. The data show subtle regional shifts, but no overwhelming evidence of a large-scale urban exodus.
Methodology
Our team analyzed search behavior for the millions of users who registered for Apartment List between January 1 and June 30, 2020. Results are broken down by quarter, which roughly translates to the periods before and after the serious economic consequences of the pandemic started to materialize.1
Search locations are the cities that users are searching in, based on their user preferences on our platform. Origin locations are where the cities they are searching from, based on IP address. We then compare origin locations and search destinations to identify the following:
Are users looking to move to different parts of the country? Searches are broken down into the following categories:
Are users expressing shifting preferences for urban living? Searches are broken down two ways:
By density:2
By primary v. secondary cities:3
Quarter-over-quarter changes are calculated as the percentage change in the search of a given search type. For example, if 20 percent of users searched in Q1 and 40 percent searched in Q2, the QoQ change would be +100 percent.
People Are Moving Again, and They’re Not Trying to Escape Density
Google trends data show that online apartment searching bottomed out in late March before rebounding to pre-pandemic levels through April and early May. This strong rebound is further supported by a recent Apartment List survey, in which 21 percent of Americans (and 29 percent of renters) said that because of the pandemic, they are now more likely to move during the remainder of 2020. Many have hypothesized that this wave of moves will be characterized by migration away from high-density areas, as Americans seek affordability and space in a post-COVID world. However, our data are not yet showing evidence of an urban out-migration, at least at the national level.
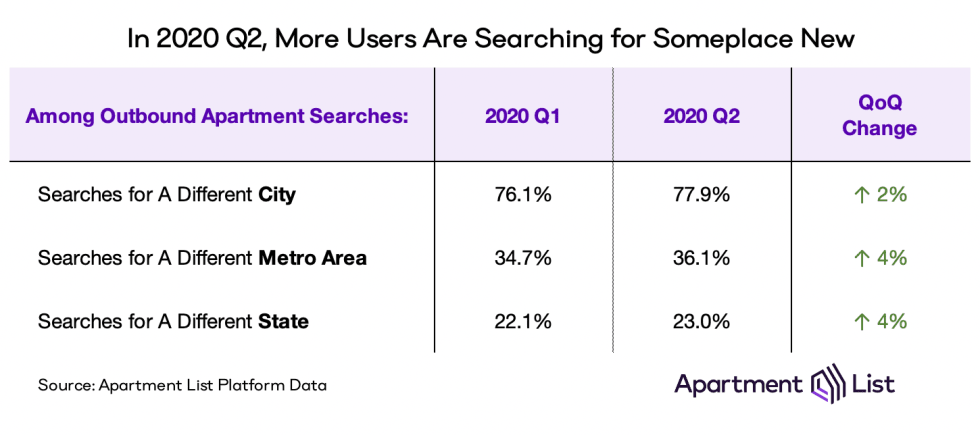
We do see a slight uptick in the share of renters looking to move someplace new. 78 percent of renters were searching in a different city from where they currently live in Q2, up from 76 percent in Q1. Similarly, the share of users searching in a different metro rose slightly from 35 percent to 36 percent, and the share searching out-of-state ticked up from 22 percent to 23 percent.

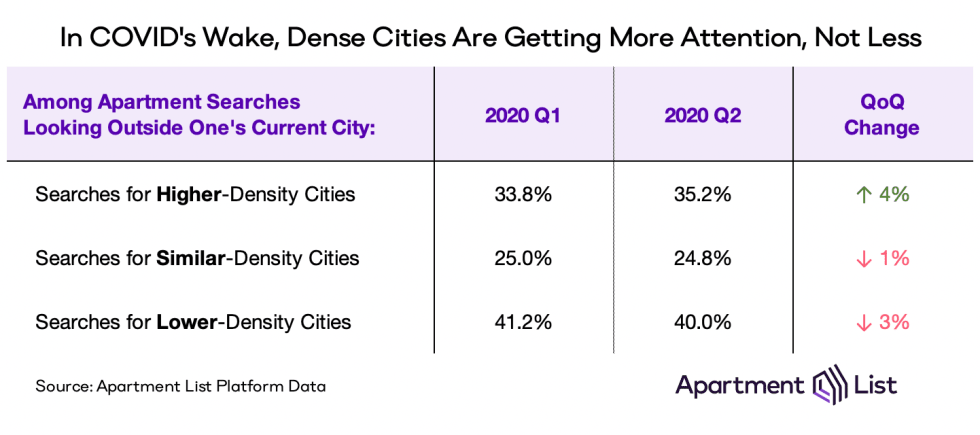
But even if renters are a bit more likely to search in new locations, they are not eschewing density. In anything, we actually see a slightly greater appetite for density than we did prior to the pandemic. Among users searching beyond their current city in Q2, just over 35 percent are looking for homes in a city with higher population density than where they currently live, a 4 percent increase quarter-over-quarter. Despite density’s bad reputation recently, searches to lower-density cities have actually ticked down 3 percent quarter-over-quarter.

Suburban Residents, Not Urban Dwellers, Are Driving New Search Interest
A separate approach for tracking changes in search activity across urban and suburban locations is to break out “principal” and “secondary” cities, as defined in the methodology section above. Principal cities are the largest (and typically the densest) cities in each region; they tend to drive a majority of the local economic activity and are often home to some of the priciest real estate. Meanwhile, the surrounding cities and suburbs that we refer to here as “secondary” cities tend to offer more spacious living accommodations and greater affordability.
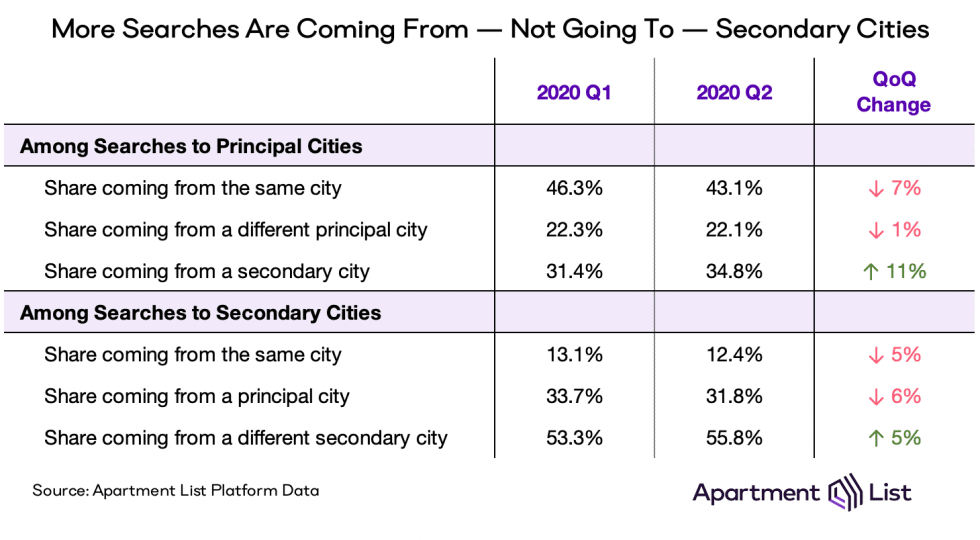
If we’re on the precipice of a transformational suburban shift, we might expect to see principal-to-secondary searches rise while secondary-to-principal searches fade. In reality, we see the opposite trend emerge; in Q2, principal cities received more search attention from secondary cities, not the other way around. Among all inbound searches for America’s 50 largest principal cities, the share coming from secondary cities rose from 31 percent in Q1 to 35 percent in Q2. Furthermore, among inbound searches to secondary cities, the share coming from principal cities dropped from 34 percent in Q1 to 32 percent in Q4.

Overall, it is the residents of these lower-density secondary cities that are driving much of the new search activity. They comprised 51 percent of all outgoing apartment searches in Q1, and 54 percent of searches in Q2.
Search Trends Vary Widely by Location
While data aggregated nationally show that search activity is increasing in dense urban regions, trends vary significantly at the metro level. Below we profile four dense cities that demonstrate how preferences are changing across time and place: New York City, San Francisco, Chicago, and Boston. Following these profiles are an interactive table and map that can be used to explore granular quarterly changes in search behavior for each of the nation’s 50 largest cities.
New York City, NY

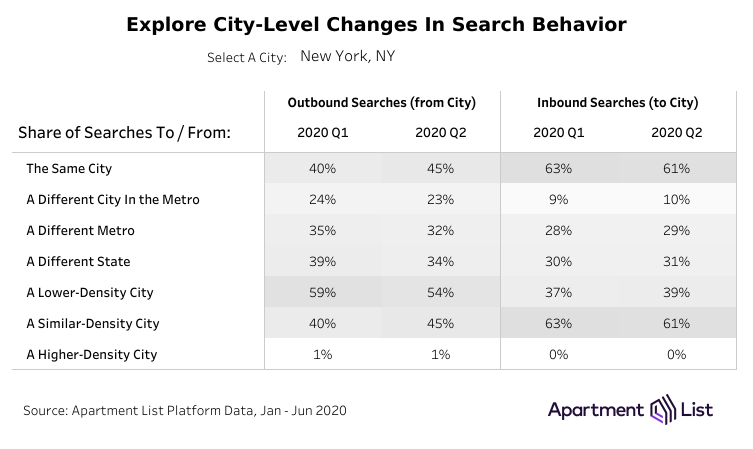
The nation’s largest city is, on paper, primed for a potential urban exodus. New York City was a global epicenter of the pandemic through late-March and April, with significant repercussions not just for the city’s health, but also its economy. Furthermore, expensive housing has long created significant financial pressure for residents even in strong economic times. Yet, search data actually show New Yorkers doubling-down on their home city in Q2.4 Within-city searches rose 12 percent between Q1 and Q2, while out-of-city, out-of-metro, and out-of-state searches each fell. And among those who are considering leaving the city, they don’t appear to be doing so out of a fear of density. In Q2 a larger share are looking for new homes in places with a similar (high) population density, while lower-density moves became less common.
San Francisco, CA

While much smaller than New York City, San Francisco is comparable in terms of its high population density and staggering housing costs. One difference is that San Francisco has avoided a major coronavirus outbreak on the scale of that seen in New York. Yet residents are showing a greater propensity to move outside the core city; there has been a 9 percent quarter-over-quarter increase in the share searching for apartments in nearby secondary cities, such as Oakland and Berkeley. But interest in leaving the Bay Area, and especially leaving California, has declined substantially. Notably, the share of users searching for apartments in lower-density cities remains stable, signaling that for many San Franciscans, moves are motivated by the search for more affordable housing, rather than decreased interest in an urban lifestyle.
Chicago, IL

Chicago provides a different example; it is a dense city showing signs for coronavirus-related out-migration (although it’s population has already been declining for some time now). During the second quarter of 2020, within-city searches have dropped 15 percent, while more residents have set their eyes on moves outside the city, metro, and state. The share searching in cities with a similar population density dropped 13 percent, while the share searching in lower-density cities rose 6 percent. After it’s local outbreak in mid-May, residents of Chicago appear to be wearier of density going forward than in New Yorkers or San Franciscans.
Boston, MA

Among the nation’s dense urban cities, Boston is the only one whose search data truly signal the potential for an oncoming urban exodus. Quarter-over-quarter, the city witnessed a 20 percent drop in the share of within-city searches, while searches to the metro’s secondary cities rose 6 percent, searches to other metros rose 28 percent, and out-of-state searches rose 30 percent. Furthermore, there was a 15 percent drop in similar-density searches coinciding with a 13 percent increase in searches for lower-density cities. Given the city’s close proximity to several other metros and states, these types of searches may naturally be more common in Boston than more spread-out parts of the country. But that said, the quarter-over-quarter changes are noticeably more dramatic than other dense cities, even those within the dense Northeast megalopolis stretching between Boston and Washington DC.
Full Local Data
The cases above illustrate how differently search patterns are playing out across different parts of the country. But they represent just a handful of the cities for which we have detailed search data.

Conclusion
While stories of Americans abandoning cities proliferate, our search data present a far more nuanced account of COVID-19’s impact on housing choice. Since the start of the pandemic, users have, on the whole, become slightly more likely to search in cities with higher population density than where they currently live. Similarly, searches from suburbs to core cities have become more common, rather than the other way around.
That said, these aggregate statistics mask that in certain markets, we are seeing early signs of a shift away from downtown. In Boston and the Bay Area, for example, search activity is up in the more affordable suburbs. In New York City, however, the opposite is true. If anything, these data show that search patterns in the COVID era defy broad generalizations.
In prior research, we have found that to the extent that the pandemic is incentivizing moves, it is doing so primarily among those who have fallen victim to the economic fallout of the crisis and who now need to find more affordable housing. In this sense, the pandemic’s impact on migration trends may not be so different from what we’ve seen in prior recessions. We also find evidence that a growing embrace of remote work will play a role, but this represents an acceleration of trends observed prior to the pandemic, and these shifts are likely to play out over years, not months. The long-term implications of this continually evolving situation are still far from clear – we will continue monitoring the data closely and reporting changes as they occur.
Footnotes
To learn more about the data behind this article and what Apartment List has to offer, visit https://www.apartmentlist.com/.


Sign up to receive our stories in your inbox.
Data is changing the speed of business. Investors, Corporations, and Governments are buying new, differentiated data to gain visibility make better decisions. Don't fall behind. Let us help.


Sign up to receive our stories in your inbox.
Data is changing the speed of business. Investors, Corporations, and Governments are buying new, differentiated data to gain visibility make better decisions. Don't fall behind. Let us help.


