While 2020 has left little to be surprised about, the home purchase market has surprised for the better. Strong home buying activity continued to soar into autumn, with September reaching the strongest annual growth since pre-Great Recession. And, according to the flow of home purchase loan applications, the trend is likely to continue through the end of the year. Overall, 2020 home sales will likely outpace last year’s levels and turn 2020 into the strongest year since 2006.
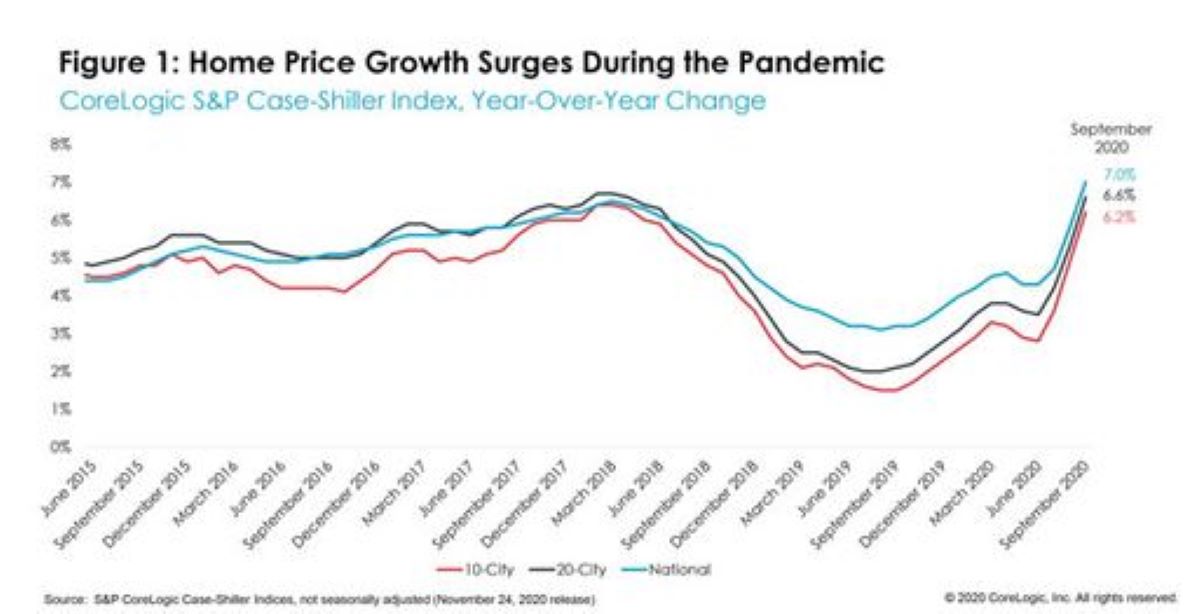
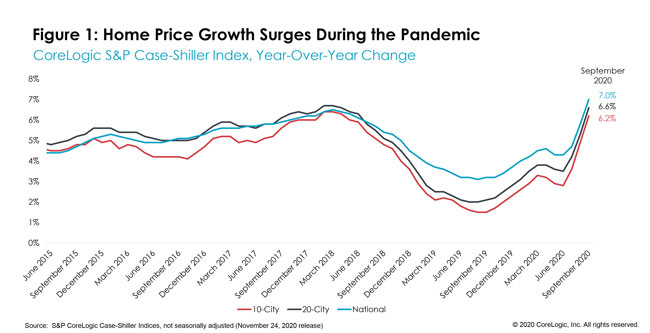
The national Case-Shiller Index surged 6.95% in September, reaching yet another new high and advancing at the fastest rate since May 2014. The index is now 23% above the peak reached during pre-Great Recession. The month-to-month index also accelerated — growing at the fastest pace since spring 2013 — increasing 1.16% from August.
While home prices have continued to increase despite the economic challenges, record-low mortgage rates have been the key in buoying home buying activity. For example, according to CoreLogic estimates, low rates have kept the typical mortgage payment more than 30% lower than 2006, prior to the Great Recession. Thus, even with recent rapid home price acceleration, buyers are still paying less on a monthly basis than they did 14 years ago – notwithstanding larger down payments.
Additional pressure on home price growth has come from another record low – available for-sale inventory, which is at the lowest level since at least 1999. But low for-sale inventories are not only due to the pandemic or low turnover rate among existing homes, but also due to a bleak decade of housing production. Over the last two decades, the U.S. population has added 2.3 times more people than housing units. In the previous two decades, population grew at 1.2 times the rate of additional housing units.
The 10- and 20-city composite indexes were also up considerably, up 6.17% and 6.57% year over year, respectively. Both indices continue to surge at the fastest pace in two years as well (Figure 1).
The 10-city price index is keeping the pace of growth with the 20-city index, suggesting demand in the largest metro areas remains strong, despite fears that work-from-home trends will weaken the relevance of big cities.
Phoenix, one of the urban areas in the 20-city Case-Shiller Index, has remained the city with the strongest home price acceleration for 15 consecutive months, up 11.4% year over year in September. Seattle remained in second place, with an annual increase of 10.1%, while San Diego (up 9.5%) remained third on the list. Cleveland, Los Angeles and Boston all followed with a 7.7% increase each in September. Chicago (up 4.7%) and New York (up 4.3%) continue to experience relatively slower price gains, but still showed a considerable acceleration in September.
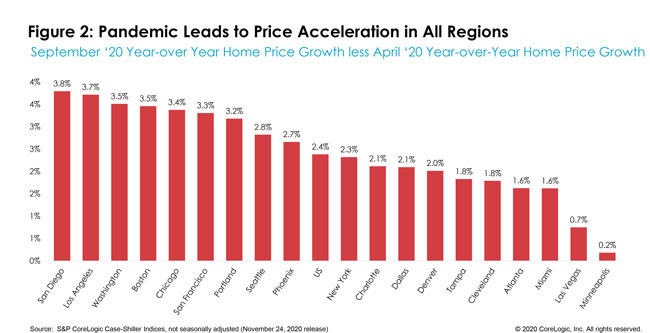
Compared to pre-pandemic price growth in April, price growth jumped in all cities in September. Even Las Vegas and Minneapolis, where gains had remained below pre-pandemic pace throughout the spring and summer, are now showing positive increases compared to last year (Figure 2).
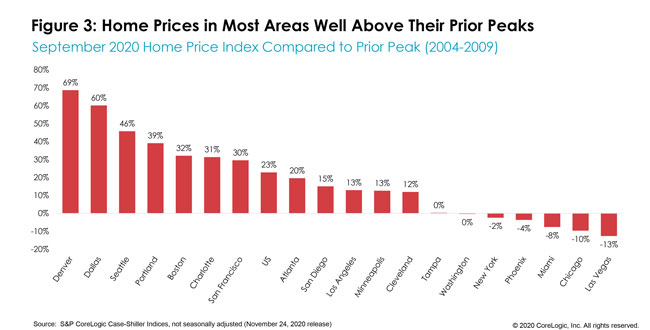
Nationally, September home prices were 23% higher than the previous peak. While home prices continue to reach new historical highs, some metro areas have still not recovered their pre-Great Recession peaks. Six metro areas are still lagging, with Las Vegas being the slowest to catch-up to its previous high. Phoenix, which has been growing at the fastest pace for the past 15 consecutive months, has still not reached its previous peak, and remains about 4% below that level (Figure 3).
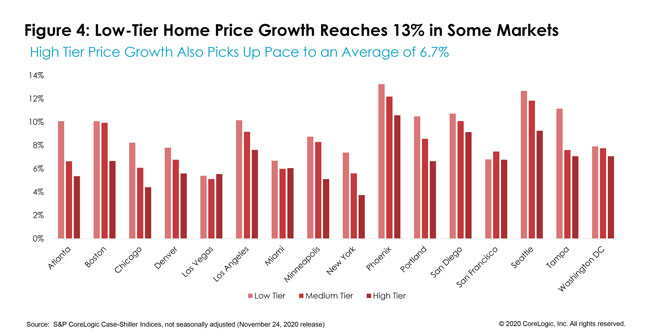
Lastly, homes in the lower one-third of the price distribution continue to experience its greatest competition from buyers, leading to the average annual growth rate of 9.2% across the 16 cities (Figure 4). In September, Phoenix and Seattle both experienced jumps of 13% or more in lower-tier home prices. The average growth among medium-tier priced homes was 8.1%, and highest-tier prices were up 6.7% on average.
*Due to the COVID-19 crisis, S&P Dow Jones Indices and CoreLogic are unable to generate a valid September 2020 update of the Detroit S&P CoreLogic Case-Shiller indices for the September release; thus, Detroit was excluded from the analysis.
To learn more about the data behind this article and what CoreLogic has to offer, visit https://www.corelogic.com/.


Sign up to receive our stories in your inbox.
Data is changing the speed of business. Investors, Corporations, and Governments are buying new, differentiated data to gain visibility make better decisions. Don't fall behind. Let us help.


Sign up to receive our stories in your inbox.
Data is changing the speed of business. Investors, Corporations, and Governments are buying new, differentiated data to gain visibility make better decisions. Don't fall behind. Let us help.