One of the major determining factors for multifamily performance is population and household change. 2020 appears to have brought about some dramatic shifts in population movement according to some early analyses such as one using LinkedIn data. Whether it was apartment demand results in suburban areas versus urban core, or the difference in demand between certain markets, signs of these shifts appear in the multifamily data. To what extent these changes will be short-term or long-term, it remains too early to know for certain.
In this space today, we’ll focus on ALN markets with strong population growth and markets with significant population loss between 2017 and 2019 according to the US Census Bureau. This will provide the backdrop for further analysis of 2020 changes as more robust data becomes available. The first part of the evaluation will be according to total population change but be on the lookout for our follow-up piece with rankings adjusted for market size. Because each ALN market contains only complete metropolitan statistical areas (MSAs), MSAs will be combined where appropriate to represent whole ALN markets.
Top Gainers by Total Population
Phoenix led the way in this three-year period with a population increase of nearly 220,000 people. The gain in population was fairly well-distributed across the various age groupings. Growth was most pronounced in the age categories over 60 , but the 30 to 34 and 40 to 44 groups also experienced strong gains.
A little more than 180,000 new residents in the Tampa market was enough to vault that market to number two on the list. Florida was one of three states with two markets in the top 10 for population growth — along with North Carolina and Texas. For Florida, the other area was Orlando at number 10 on the list. In Tampa, growth was similarly strong in the age categories representing the 60 years and older population. As with Phoenix though, there was notable growth in specific younger groups as well. In particular, the 10 to 14 age range as well as those in their 30’s. Each of these subsets bode well for economic activity and the 10 to 14 demographic especially is a positive indication of future household formation and growth.
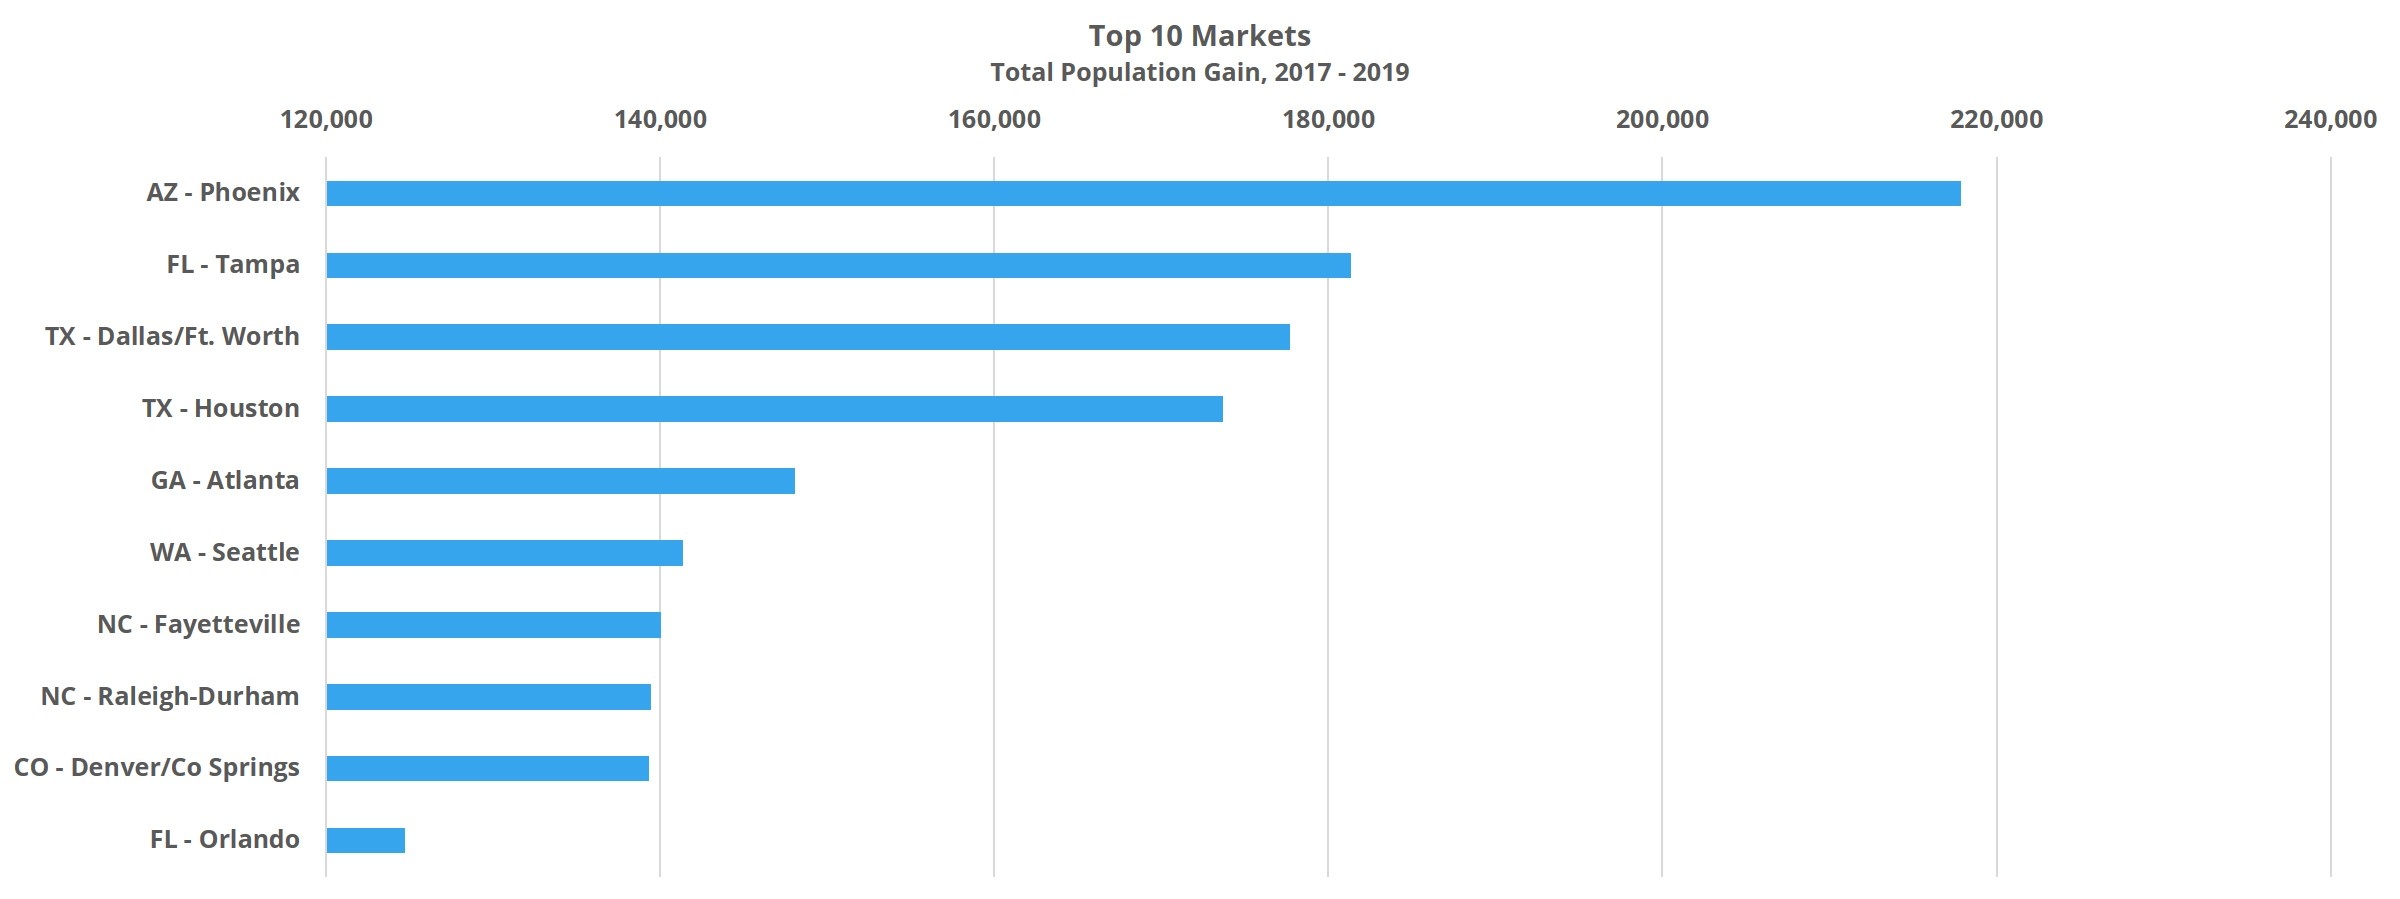
Third in the rankings was Dallas – Fort Worth (DFW) with a total population gain of just below 180,000 from 2017 through 2019. Once again, the older age groups saw notable growth, especially in the 60 to 64 and 70 to 74 groups. Strong growth was also seen in the 34 to 39 age range as well as the 10 to 14 range. Significant population growth spread across the age spectrum as was seen in DFW is ideal for multifamily. Of the three states with multiple markets in the top 10 for population growth, Texas is most strongly represented with DFW at number three and Houston positioned at number four.
Top Losers by Total Population
The market to lose by far the most in total population through this three-year evaluation period was New York City. An eye-popping 1.1 million people left the area. That is nearly 10 times the loss of the number two market despite being less than double the size of said market. Making matters worse, the decreases were most apparent in the working-age cohorts. Those from ages 25 to 29 were among the sharpest population declines, as were those in the 34 to 39 age group. The other two subsets with profound decreases were the 45 to 49 and 50 to 54 age groups.
The market to lose the second-most in total population was the Los Angeles – Orange County area. A loss of around 140,000 people is far less dramatic than the 1.1 million lost in New York but is certainly significant. Here too, the aggregate loss is compounded by where the losses were concentrated. The lower age groups were most impacted. Losses were steep for children nine and younger, as well as for those between 15 and 24 years old. With regard to the latter, this is a prime demographic for new household formation, and is a profound loss. Those ages 40 to 49 also left the LA area to an especially high degree relative to other cohorts.
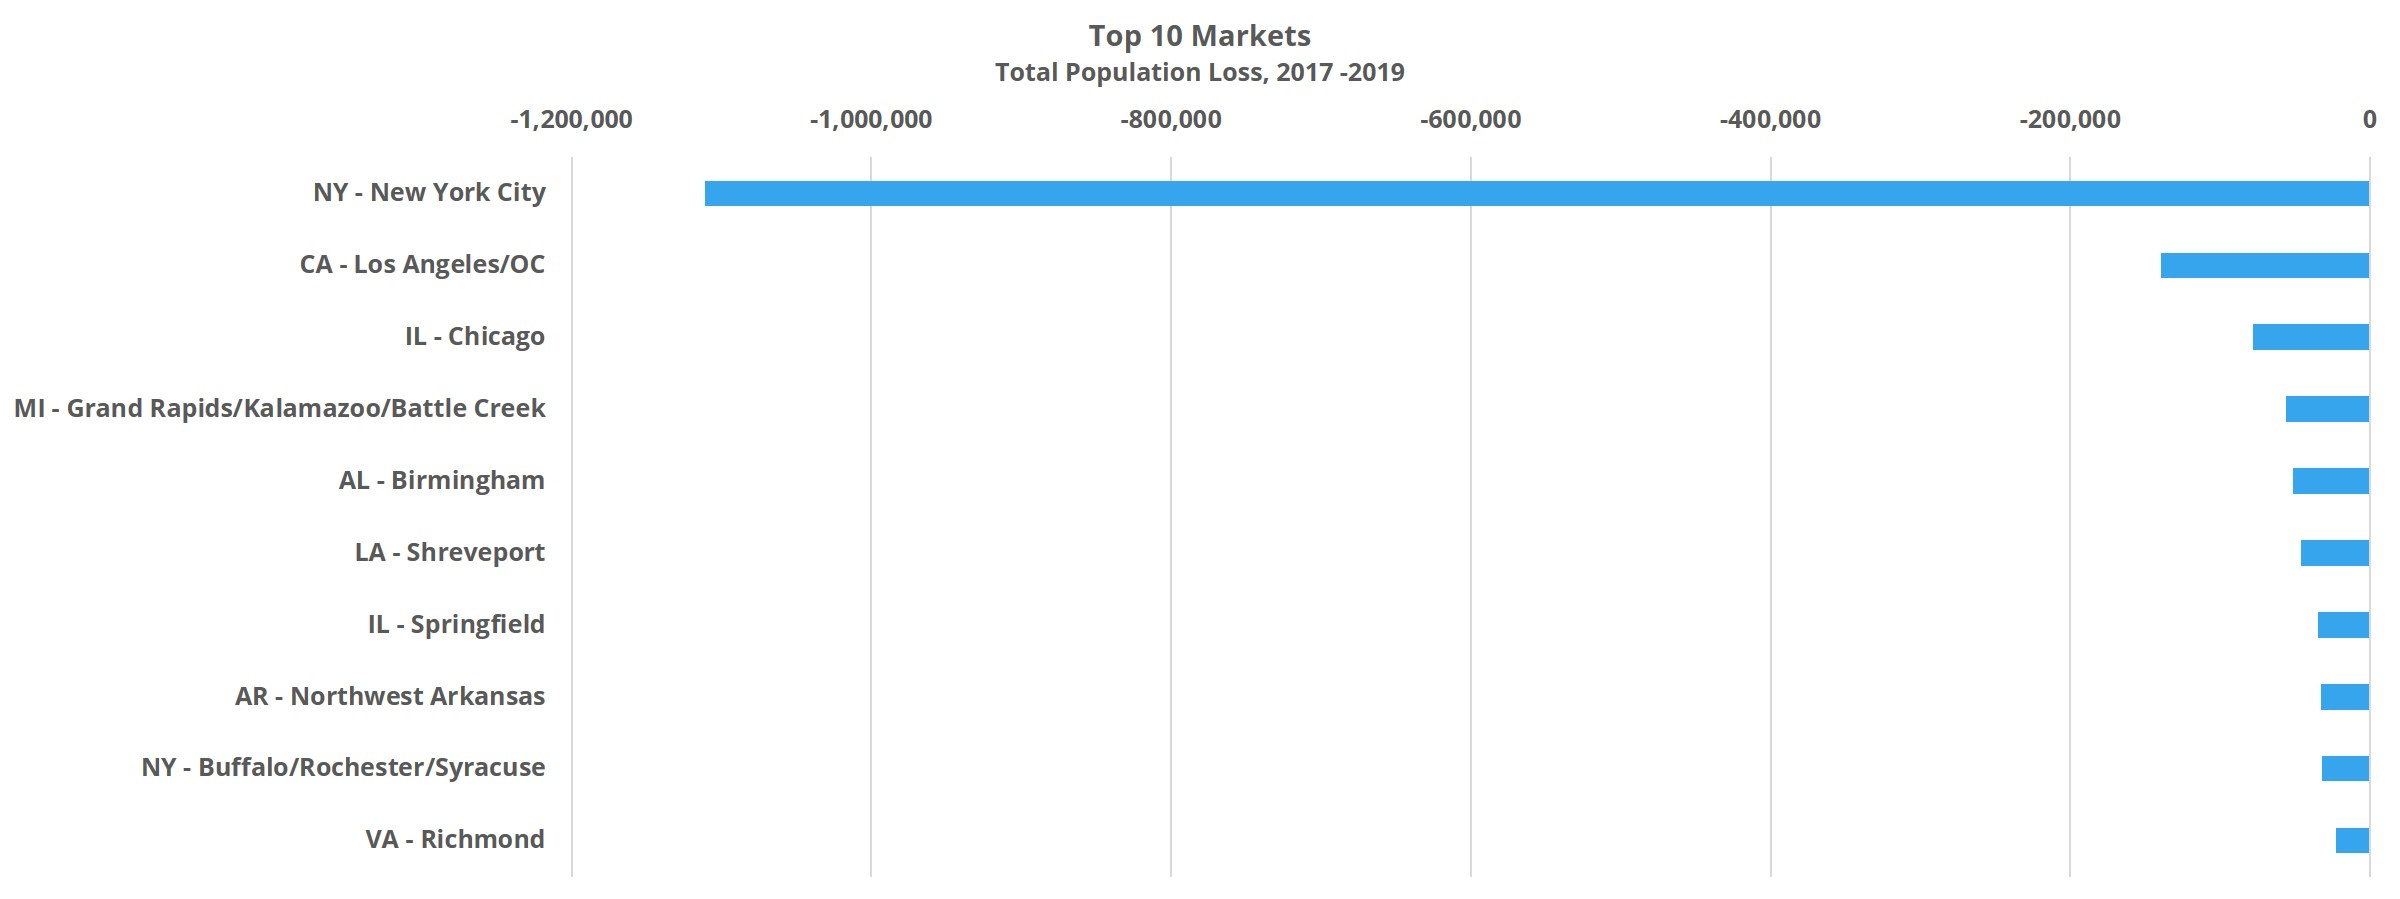
With a loss of about 80,000 people, the Chicago market was number three for largest total population decline. The losses were not as concentrated in the younger age categories as in New York or LA, but large decreases were seen in mostly working-age categories. The exception to that was in the youngest cohort, children under five. Residents between 45 and 59 represented the largest apportionment of lost population, with those between 50 and 54 especially affected.
Takeaways
Southern markets of varied sizes dominated the list of total population gainers from 2017 to 2019. Only two markets, Denver – Colorado Springs and Seattle, cracked the top 10 outside the southern portion of the country. On the other side of the coin, the markets that struggles most with population change was more of a mix of market profiles. The most affected markets were large and expensive urban markets like New York, LA and Chicago, but there were others like Richmond, VA and Shreveport, LA that faced other challenges.
These shifts in population preceded the events of 2020. The large scale shift in living and work arrangements that started in 2020 will likely exacerbate some of these urban flight trends and will have serious implications for the multifamily industry moving forward.
To learn more about the data behind this article and what ALN Apartment Data has to offer, visit https://alndata.com.


Sign up to receive our stories in your inbox.
Data is changing the speed of business. Investors, Corporations, and Governments are buying new, differentiated data to gain visibility make better decisions. Don't fall behind. Let us help.


Sign up to receive our stories in your inbox.
Data is changing the speed of business. Investors, Corporations, and Governments are buying new, differentiated data to gain visibility make better decisions. Don't fall behind. Let us help.