
After a rough second quarter in 2020 when the multifamily industry was dealing with the full impact of the COVID-19 pandemic, national apartment demand rebounded strongly in the second half of the year. It was this resurgence, above and beyond demand seen in the same portion of 2019, that buoyed overall annual performance numbers and prevented dramatic declines in average occupancy and rent.
This positive momentum has carried over into the new year so far with net absorption in both January and February surpassing the same months last year. This is a welcome development after the setbacks and challenges of 2020 and merits a closer look. This month we will do just that, and as usual, only conventional properties of at least 50 units will be included in the evaluation.
National Overview
At the national level, slightly less than 200,000 net units were absorbed in the second half of 2020. In the same portion of 2019, net absorption totaled about 115,000 units. This nearly 75% increase in demand was enough to outweigh the 60% decline in the first half of the year compared to 2019 on a percentage basis. However, a deficit of approximately 41,000 absorbed units remained at the close of 2020. The reason that fewer total units were absorbed in 2020 compared to 2019 despite the 75% increase in the back half of 2020 is that significantly more units were absorbed in the first half of 2019 than in the second half – a condition that was inverted in 2020.
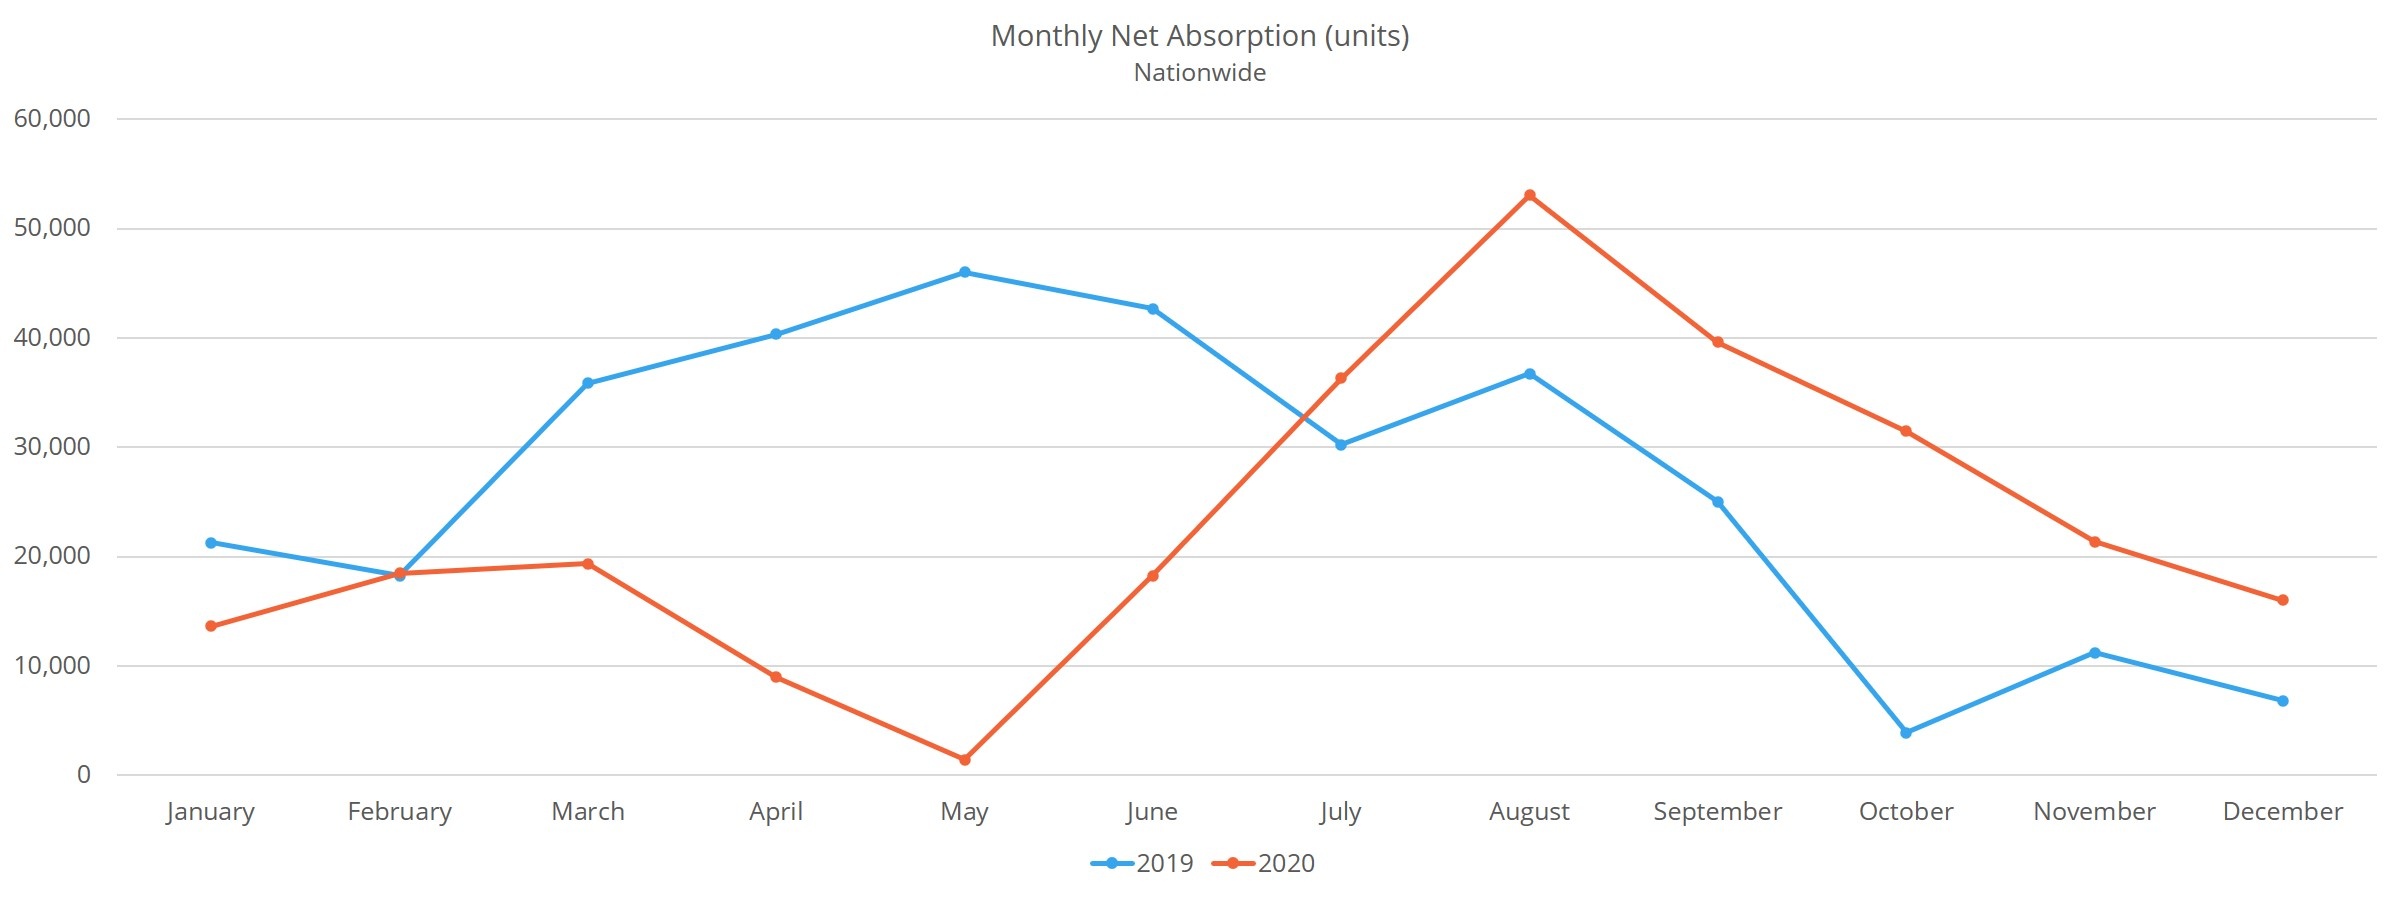
Through the first two months of 2021, the story has been much the same. Apartment demand was about 30% higher in January and February of this year compared to in 2020 thanks to net absorption of around 42,000 units. This was roughly on par with the level of absorption seen in the first two months of 2019 and 2018.
Price Class View
Across all four price classes apartment demand began to rebound around June, mirroring the overall national trend. It took until the start of the fourth quarter of 2020 for demand in the top two price classes to resemble that of the last couple of years. For Class A properties, after lagging all year, fourth quarter net absorption finished right in line with that from both 2018 and 2019. All told, just over 25,000 Class A units were absorbed from October through December. So far in 2021, 18,000 net absorbed units in Class A properties have outstripped the 14,000 units from the opening two months of 2020 – an increase of 20%.
Like the Class A Sector, he bump in demand for Class B properties began comparatively late in 2020 and annual absorption compared favorably to the same period in 2019. Monthly demand slightly outpaced both 2018 and 2019 beginning in September, and from September through December net absorption of a little more than 34,000 units easily bettered the approximately 22,000 absorbed units from the same months in 2019. This positive change continued into the new year. A little more than 15,000 absorbed units this year equaled a 15% increase from the first two months of last year.
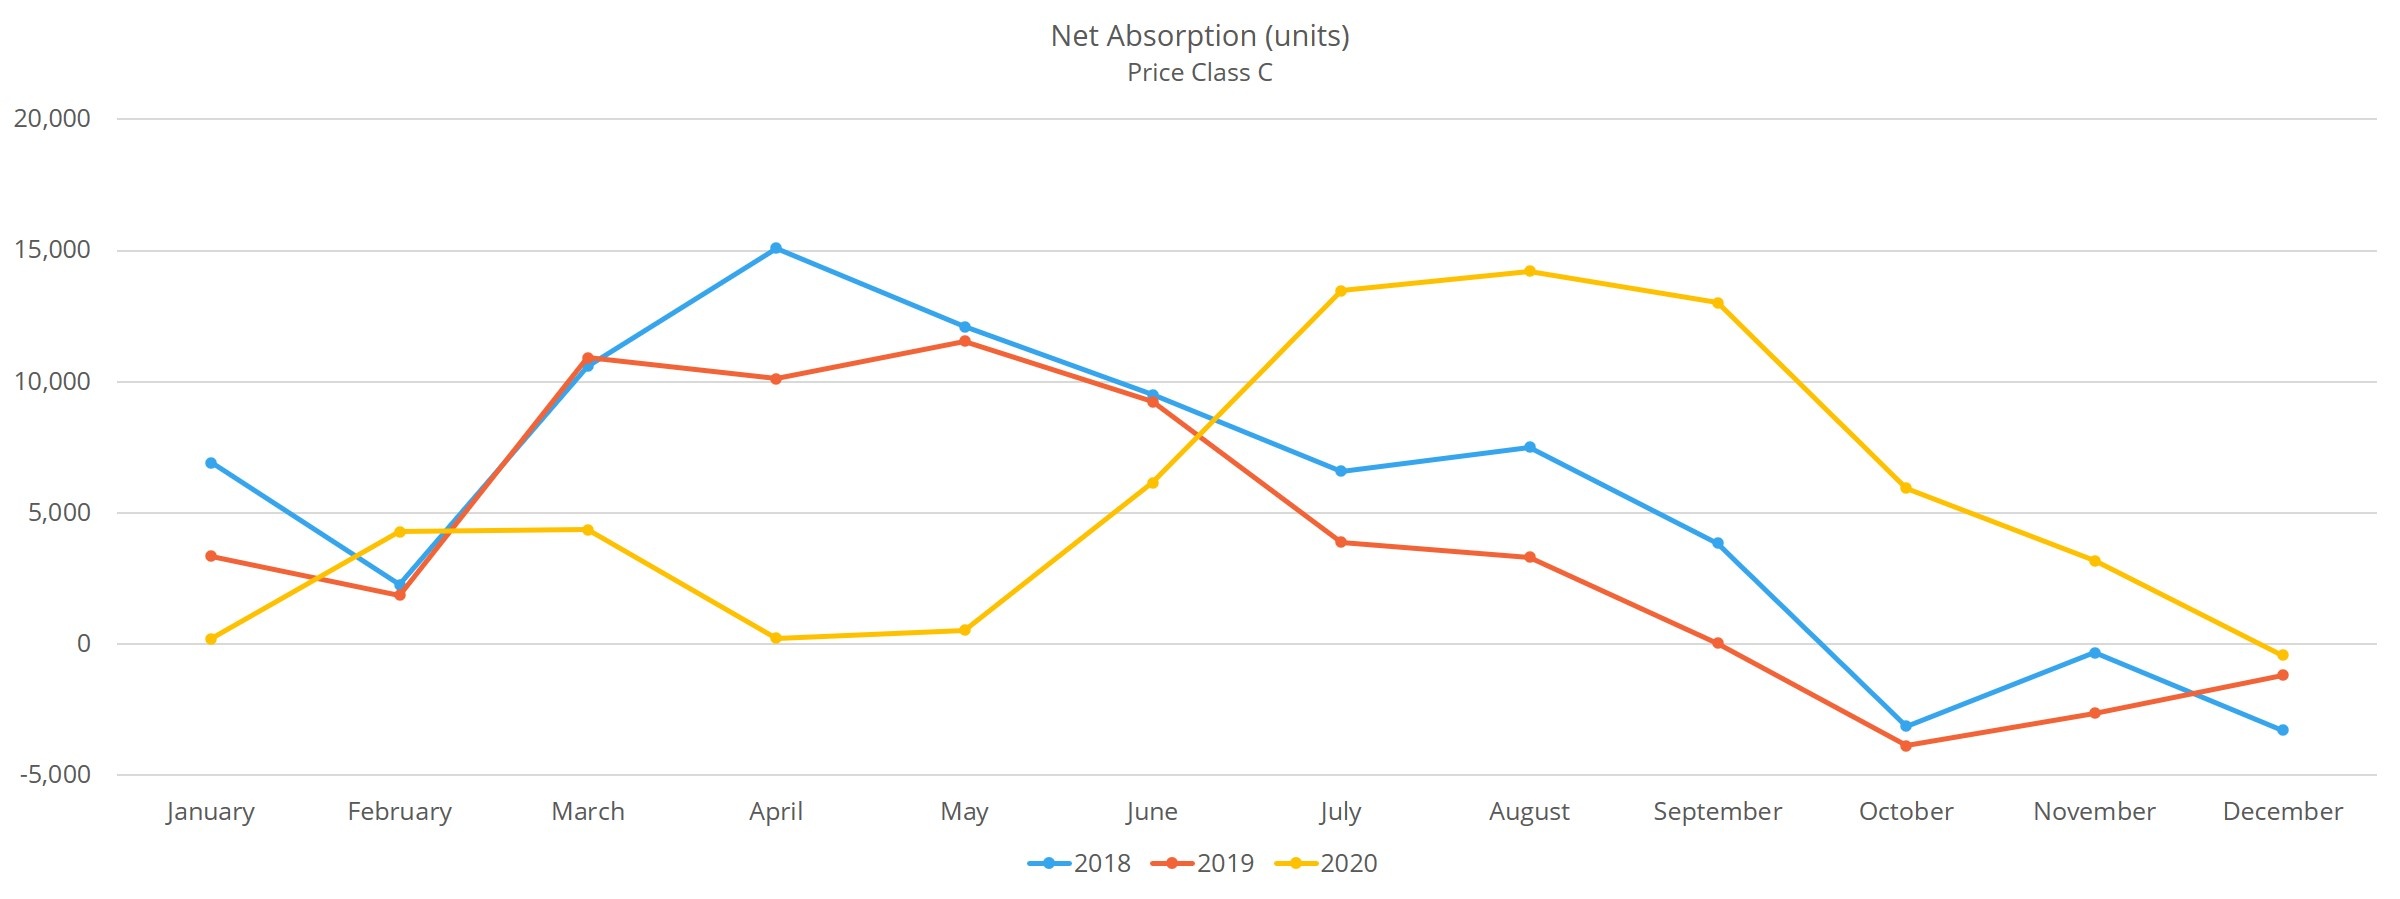
In the Class C subset, it took less time for demand to bounce back after bottoming out in the spring. In July, net absorption was roughly triple that of July 2019 at more than 13,000 units. Monthly absorption remained comfortably above 2019 values through the end of the year until December when there was a virtual tie. From July through December net absorption of more than 49,000 units was a profound difference from a net loss of 450 rented units during the same portion of 2019. With 5,000 absorbed units, these properties have continued to do relatively well in 2021, though not to quite the same extent as in the top two price classes. Still, an 11% increase from the first two months of 2020 is nothing to sneeze at.
The picture for Class D properties has been much the same. Monthly demand first surpassed 2019 figures in July, and that continued through December. In that span, these properties experienced a net gain of 16,000 rented units after losing nearly 10,000 rented units in the same portion of 2019. Class D properties did suffer a net loss of rented units in January of 2021 but rebounded nicely in February for a net increase over the two months of around 300 rented units. Though not an eye-popping total, a net gain of 300 rented units was far superior to the net loss of 3,500 rented units to start 2020.
Market View
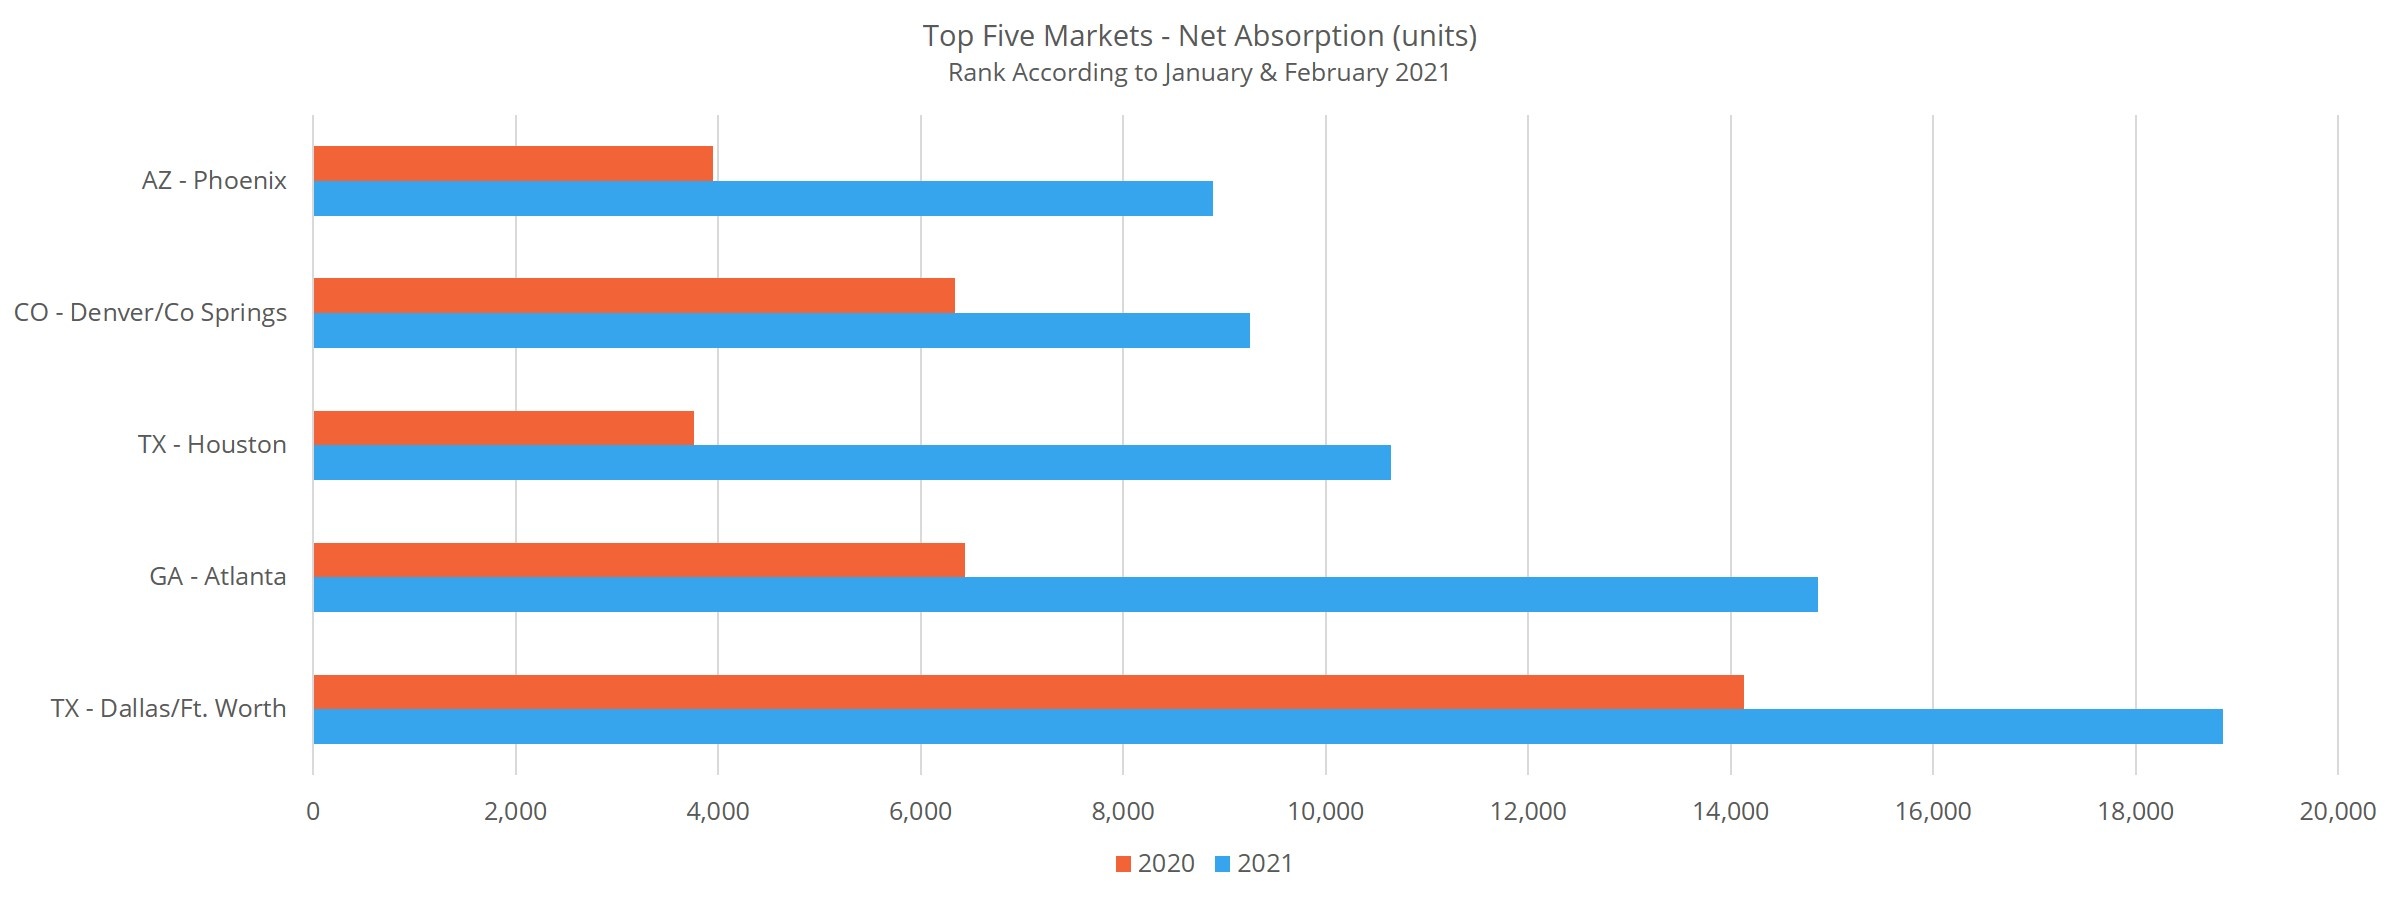
On a more granular level, apartment demand differences were apparent from the perspective of market size and region. For the sake of space those won’t be detailed here but will be the topic of upcoming posts on the ALN blog. There are also some specific markets have shown especially strong demand between June 2020 and February 2021 relative to their performance in the same period a year ago.
In Phoenix, almost 9,000 net units were absorbed from June through February, an increase of 125% compared to that same period a year ago. In the San Bernardino – Riverside area, net absorption of around 5,500 units was six times the volume from the previous year. With a net gain of 8,100 rented units since the start of June 2020, absorption in the Tampa market rose by 125%. In Atlanta, almost 15,000 absorbed units marked a surge on demand of 130%.
On the other side of the coin, there were markets which continued to struggle even as demand rebounded elsewhere. In Seattle, net absorption went from about 9,500 units to only about 150 units. In the New York City area, net absorption of nearly 13,000 units from June 2019 through February 2020 turned to a net loss of almost 7,000 rented units this time around. In Minneapolis – St. Paul, only 45 units were newly rented over the eight months after gaining almost 3,500 rented units in the previous period. The California Bay Area shed 3,100 rented units after absorbing approximately 2,200 units a year ago.
Takeaways
After a challenging 2020, it is encouraging to see the rebound in apartment demand that has occurred in recent months. After bottoming out in the second quarter of last year, net absorption has roared back at the national level and has maintained positive momentum through the first two months of 2021.
The recovery in demand has not been even across markets or property types. These will be important distinctions to focus on in the near future. Though all four price classes have performed reasonably well relative to their results from recent years, the most pronounced over-performance has been in the lower two price classes.
The expensive coastal markets such as San Francisco – Oakland, Seattle, Boston, New York, and Washington DC continue to struggle while markets across the south and Mountain West have recovered nicely. As the COVID-19 vaccine rollout continues and more areas of the country move toward something resembling normalcy, the positive trend that has already been sustained for more than half a year should continue as we move forward through 2021, barring any major setbacks like the one we experienced this time last year.
To learn more about the data behind this article and what ALN Apartment Data has to offer, visit https://alndata.com.


Sign up to receive our stories in your inbox.
Data is changing the speed of business. Investors, Corporations, and Governments are buying new, differentiated data to gain visibility make better decisions. Don't fall behind. Let us help.


Sign up to receive our stories in your inbox.
Data is changing the speed of business. Investors, Corporations, and Governments are buying new, differentiated data to gain visibility make better decisions. Don't fall behind. Let us help.