Overall Single-Family Rent Growth
U.S. single-family rent growth quickened in March 2021, increasing 4.3% year over year, showing solid improvement from the low of 1.4% reported for June 2020, and up from the 3% rate recorded for March 2020, according to the CoreLogic Single-Family Rent Index (SFRI). The index measures rent changes among single-family rental homes, including condominiums, using a repeat-rent analysis to measure the same rental properties over time.
Single-Family Rent Growth by Price Tier
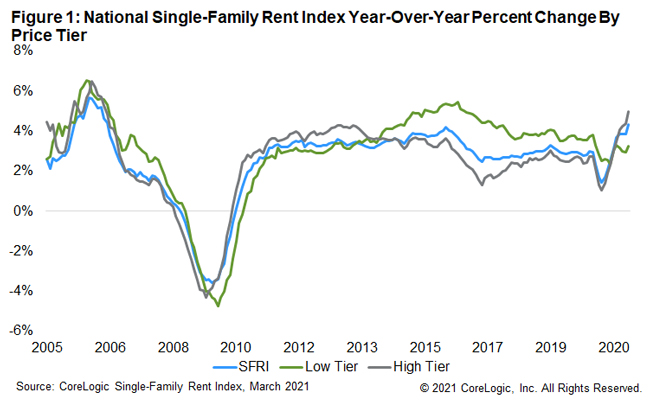
An uneven U.S. job recovery, sometimes called a “K-shaped” recovery, is reflected in the rent price growth of the low- and high-price rent tiers. The low-price tier is defined as properties with rent prices less than 75% of the regional median, and the high-price tier is defined as properties with rent prices greater than 125% of a region’s median rent (Figure 1).
Unlike the high-price tier, rent growth in the low-price tier remains below pre-pandemic levels as the recession has disproportionately affected lower-wage workers. Rent prices for the low-end tier, increased 3.2% year over year in March 2021, down from 3.8% in March 2020. Meanwhile, higher-priced rentals increased 5% in March 2021, up from a gain of 2.8% in March 2020. This was the fastest increase in higher-price rents since August 2006.

Single-Family Rent Growth by Property Type
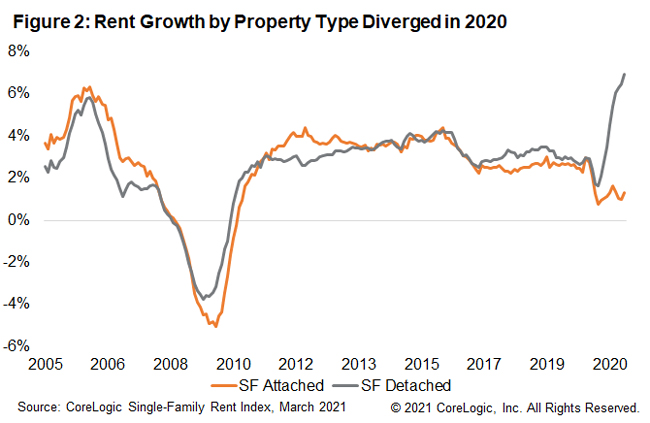
Differences in rent growth by property type emerged after the pandemic as renters sought out standalone properties in lower density areas (Figure 2). The detached property type tier is defined as properties with a free-standing residential building, and the attached property type tier is defined as a single-family dwelling that is attached to other single-family dwellings, which includes duplexes, triplexes, quadplexes, townhouses, row-houses, condos and co-ops.
Rent prices for detached properties increased 6.9% year-over-year in March 2021, up from 2.9% in March 2020. This was the record high in rent growth for detached properties.[1] Simultaneously, attached properties were struggling, with just a 1.3% year-over-year increase in March 2021, down from 2.7% in March 2020.

Metro-Level Results
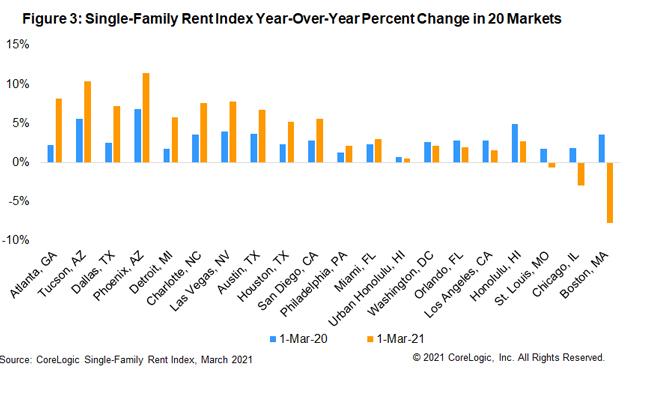
Figure 3 shows the year-over-year change in the rental index for 20 large metropolitan areas in March 2021. Among the 20 metro areas shown, Phoenix stood out with the highest year-over-year rent growth in March as it has for most of the last three years, with an increase of 11.4%, followed by Tucson, Arizona (+10.4%) and Atlanta, Georgia (+8.1%). Three metro areas experienced annual declines in rent prices: Boston (-7.7%), Chicago (-2.9%) and St. Louis (-0.6%).

While 8 of the 20 metros shown in Figure 3 had lower rent growth than a year ago, Boston had the largest deceleration in rent growth, showing annual rent growth of 11.3 percentage points lower than in March 2020. The slowdown in Boston rent growth might be attributed to college students choosing not to return to Boston, but instead opting to continue virtual learning elsewhere.
Chicago had the second-largest slowdown in rent growth, coming in 4.8 percentage points lower than a year earlier. For Chicago, there were large differences in rents of attached versus detached properties. While rent prices of detached rentals in Chicago increased by 5%, attached rentals experienced a decrease of 4.7%.
Single-family rents grew quickly in March as occupancy rates for single-family rentals were near a generational high. Rent growth was strongest for detached properties and for higher-priced rentals, both of which are popular with higher income workers and those are working from home.
To learn more about the data behind this article and what CoreLogic has to offer, visit https://www.corelogic.com/.


Sign up to receive our stories in your inbox.
Data is changing the speed of business. Investors, Corporations, and Governments are buying new, differentiated data to gain visibility make better decisions. Don't fall behind. Let us help.


Sign up to receive our stories in your inbox.
Data is changing the speed of business. Investors, Corporations, and Governments are buying new, differentiated data to gain visibility make better decisions. Don't fall behind. Let us help.


