Months into 2021, housing supply remains at historically low levels while the impact from the pandemic and low mortgage interest rates linger. This has meant that some potential sellers are still holding on to their properties in fear of the virus while homebuyers are flooding the market, trying to capture the benefits of low mortgage interest rates. Together, these have shrunk the already small supply of available homes.
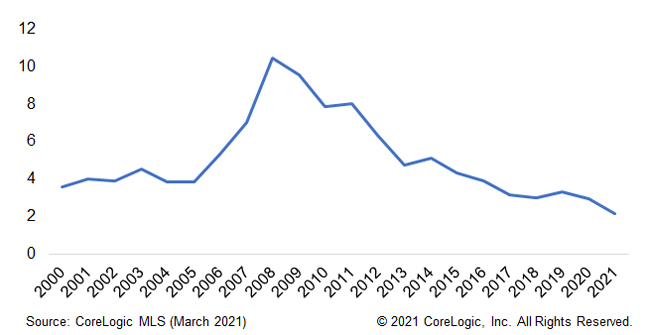
Nationally, the number of homes for sale equated to a 2.2-month supply[1] in March 2021, falling from a supply of 3 months in March 2020, the lowest months’ supply since 2000 (Figure 1).
With demand strong and supply tight, many homes didn’t spend long on the market in in the first three months of 2021. Figure 2 shows that over the past two years, the share of homes selling within 30 days of the initial list date has been at the highest level since 2000. In March 2021, the share selling within 30 days was 26.4%, higher than the pre-pandemic peak of 23.6% in May 2019 and more than four times of the level during the January 2011 trough.
Figure 2: Homes Sold Fast
Sold in 30 days
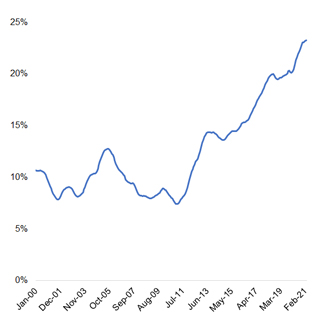
Figure 3: For-Sale Inventory Low
Inventory on Market >180 days
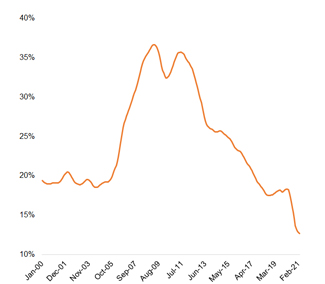
Figure 3 shows the share of the for-sale inventory that was on the market for more than 180 days, an indicator of the homes that are hard to sell. In March 2021, that share was 11.3%, which was about half of the share in March 2020, and a quarter of the January 2009 peak of 41.4%.
Figure 4: Supply is Down in Most Large Metros US and CBSA Months of Supply
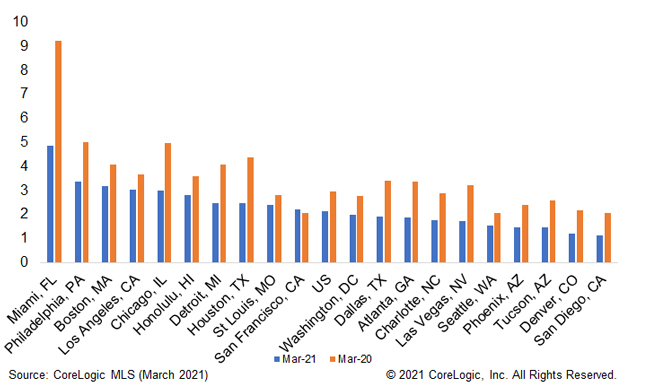
Figure 4 shows the months of supply in the U.S. (based on data for 68 metropolitan areas) and selected metropolitan areas in March 2021 and March 2020. Nationwide, the inventory decreased 22.5% year-over-year in March, with the supply at 2.2 months in March 2021 compared with 3 months in March 2020.
Out of 20 metropolitan areas, 19 showed declines in months’ supply in March 2021 compared with a year earlier. Miami had the largest drop in supply, decreasing 4.3 months, from 9.2 in March 2021 to 4.9 in March 2020. San Francisco was the only metro that showed an increase in supply compared to a year ago. It’s also one of the five metros that showed declined in home price year-over-year change in March.
With the increase in COVID-19 vaccine availability and strong home price growth, potential home sellers might be more willing to put their homes on the market for a good price in the coming months, which would help release supply and reduce the shortage in for-sale homes.
To learn more about the data behind this article and what CoreLogic has to offer, visit https://www.corelogic.com/.


Sign up to receive our stories in your inbox.
Data is changing the speed of business. Investors, Corporations, and Governments are buying new, differentiated data to gain visibility make better decisions. Don't fall behind. Let us help.


Sign up to receive our stories in your inbox.
Data is changing the speed of business. Investors, Corporations, and Governments are buying new, differentiated data to gain visibility make better decisions. Don't fall behind. Let us help.