
Investor activity in real estate markets during the COVID-19 pandemic has mirrored the market as a whole.
Investor Purchases
The blue line in Figure 1 shows the year-over-year change in investors’ purchases nationally.
Figure 1
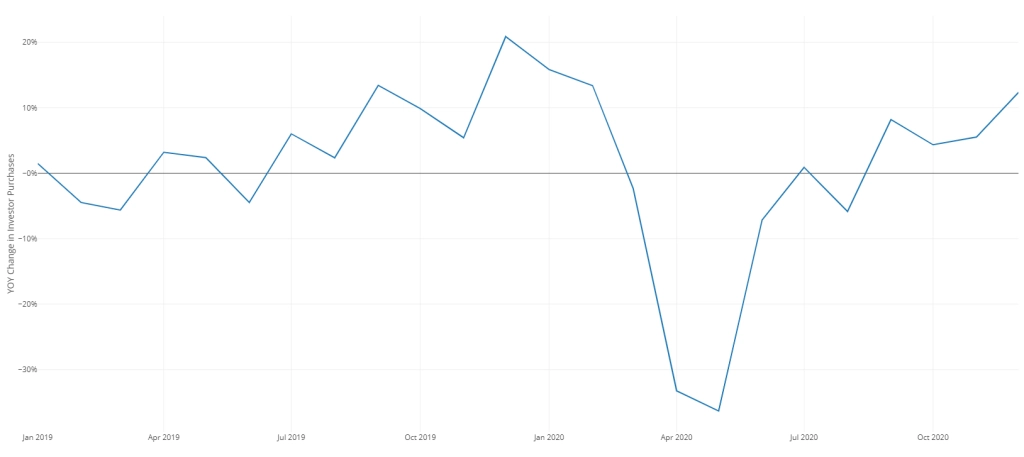
The blue line showed a consistent growth path through 2019 before falling sharply in March and April of 2020. Investor purchases reached their lowest point in May 2020 with a year-over-year decline of 36%. Since then, they’ve still only recovered with a year-over-year increase of 12% in December of last year.
Given the all-encompassing nature of the COVID-19 recession, this should not be surprising.
Investor Activity
Even though investor purchases are up, their market share is down. The orange line in Figure 2 shows the year-over-year change in the share of home purchases that investors made.
Figure 2
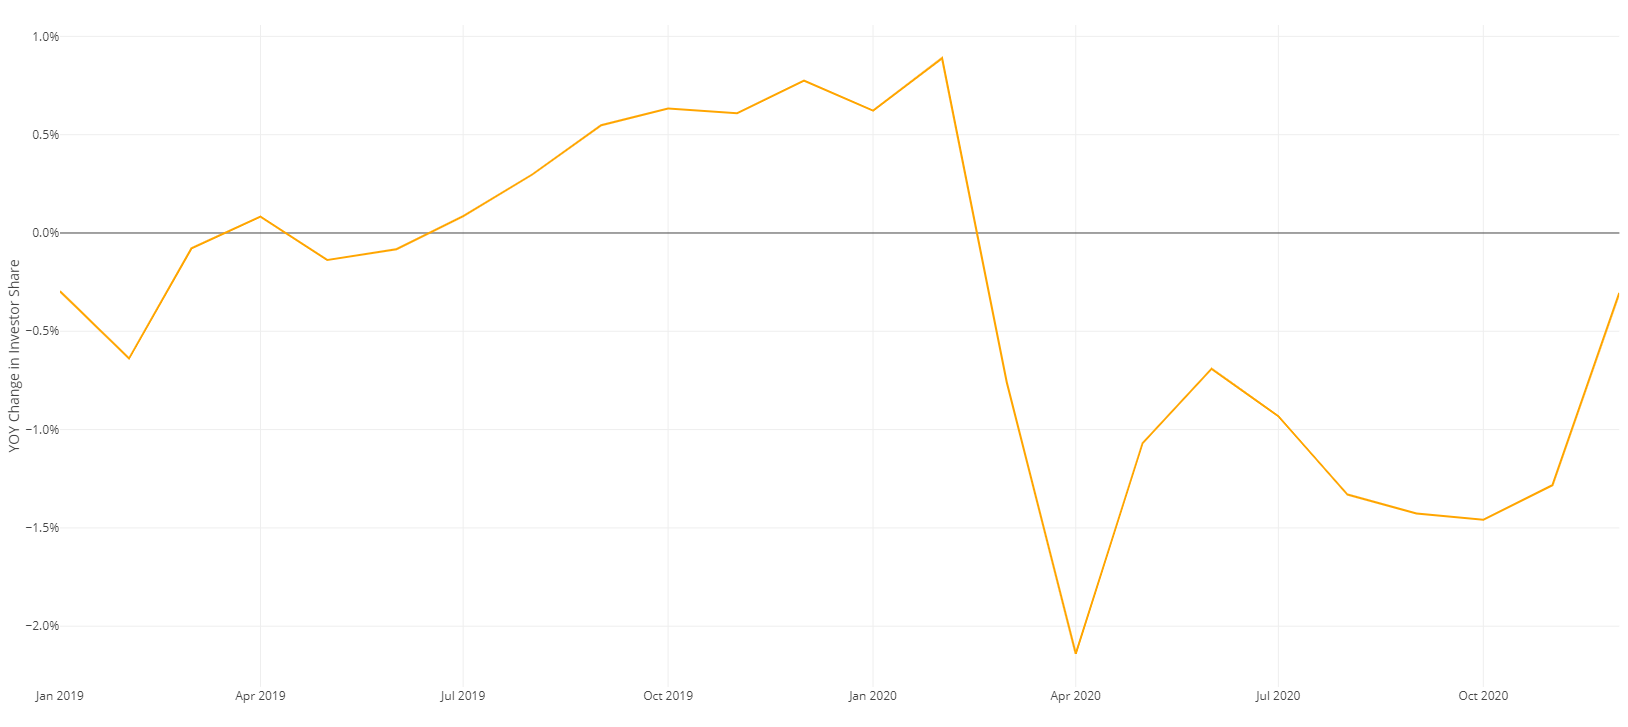
The year-over-year change in the share of purchases made by investors was negative throughout the second half of 2020. This means that the recent home price boom has primarily been driven by homeowner purchases.
Investors’ market share didn’t return to its previous level of 16% until December.
Like the blue line, the orange line shows a consistent growth path through 2019 before falling sharply and suddenly in March and April of 2020. This is the same as what we know about overall home sales during this period. The orange, however, shouldn’t necessarily track this closely; that it fell so sharply indicates that a disproportionate amount of the decline in housing market activity is due to declines in investor purchases.
Comparison and Recovery
The two lines begin to diverge in the recovery. Growth in investor purchases became positive again in the third quarter, while the change in the investor remained negative throughout the year. So, the increase in non-investor sales purchases has been disproportionately more responsible for the recent housing market boom.
All in all, the blue line in Figure 1 shows that investors have hardly missed out on the housing boom in the back half of 2020. Instead, they have just not been as active as individual buyers, who appear to have muscled investors out of the market by a small margin.
Figure 3: State-By-State
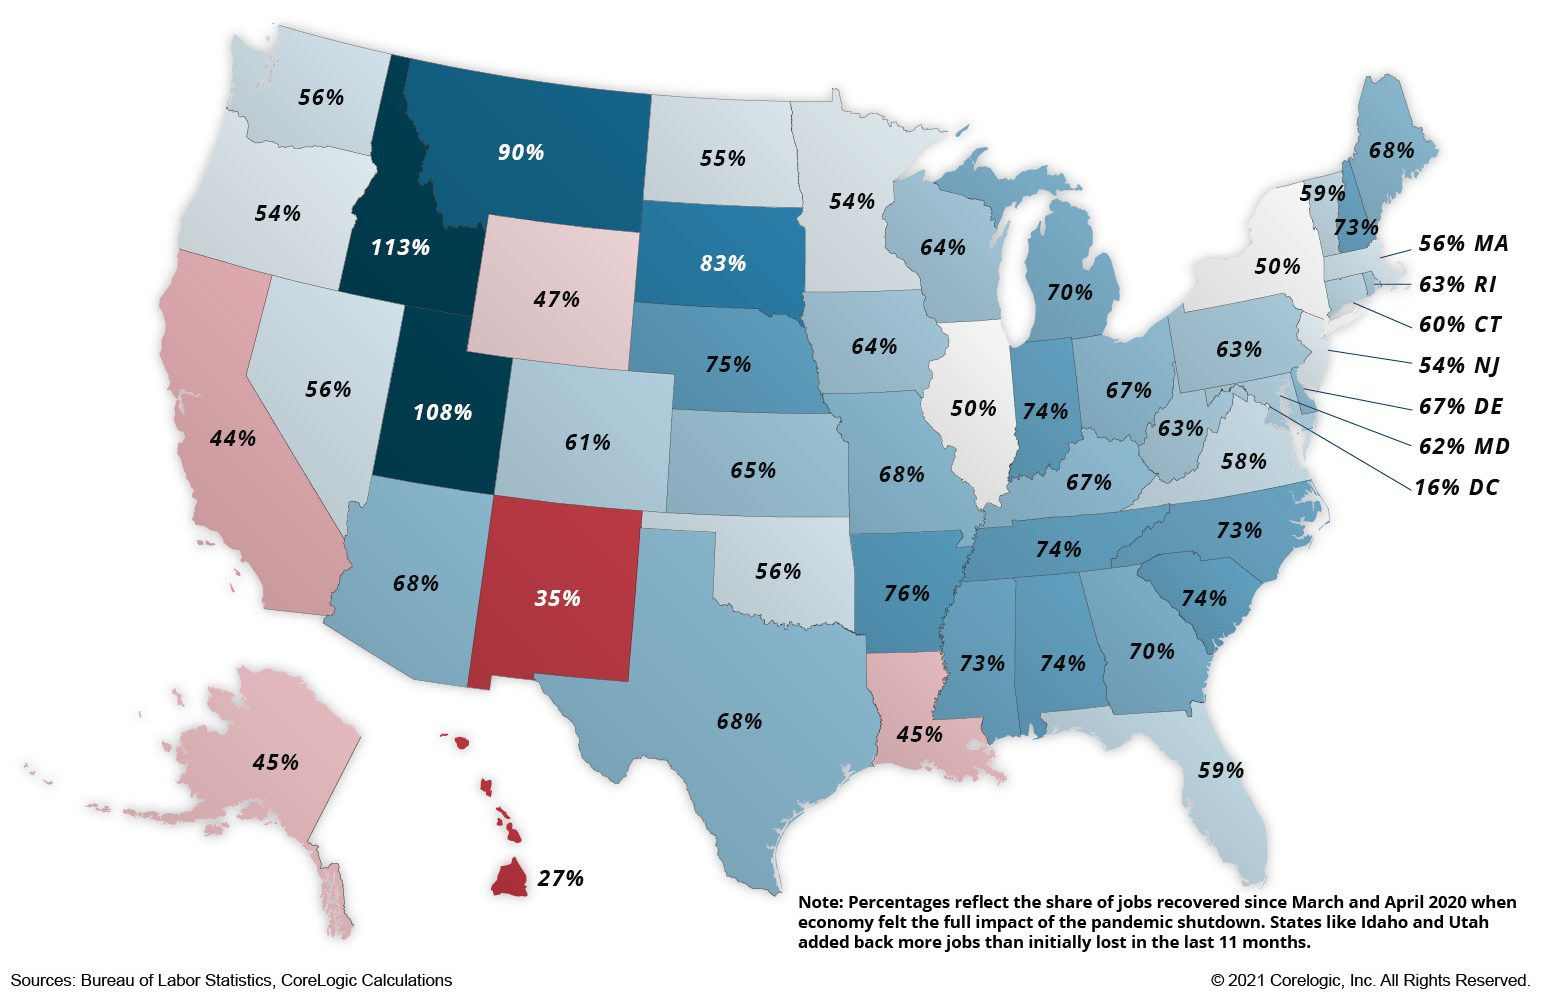
Figure 3 shows the year-over-year growth in investor sales by state for 2020. The Mountain-West had the most investor activity over the past year, as did the smaller New England states. The more Southern states in the Midwest were a strong cluster. The Northeast and the West Coast by far had the weakest activity.
There are many possible reasons for the variation amongst states. Investors have an attraction to markets that hit the sweet spot of high growth in both prices and sales that unambiguously indicates significant demand increases. Their strong presence in the Mountain-West , probably the hottest region for housing in the country, shows this. The lower Midwest also offers strong growth at bargain prices. Conversely, the Northeast and the West Coast make investors very nervous due to their markedly higher prices than the rest of the country.
Tenants’ Rights
Typical investor drivers can’t explain why the upper low-growth places like the New England states, and Iowa, have strong growth. None of these places have been historically hot spots for investment, nor have they shown exceptional economic strength during the recovery. These states highlight a particular layer of risk that investors had to consider in 2020: tenants’ rights.
The recession has left many unable to pay their rent after becoming unemployed. Typically, an investor would often evict a tenant by not paying their rent and finding a replacement. However, during the pandemic, many states banned evictions. Such measures are a natural deterrent to investor activity since it raises the possibility that you could get stuck with a renter who doesn’t pay and who you can’t replace.
Figure 4
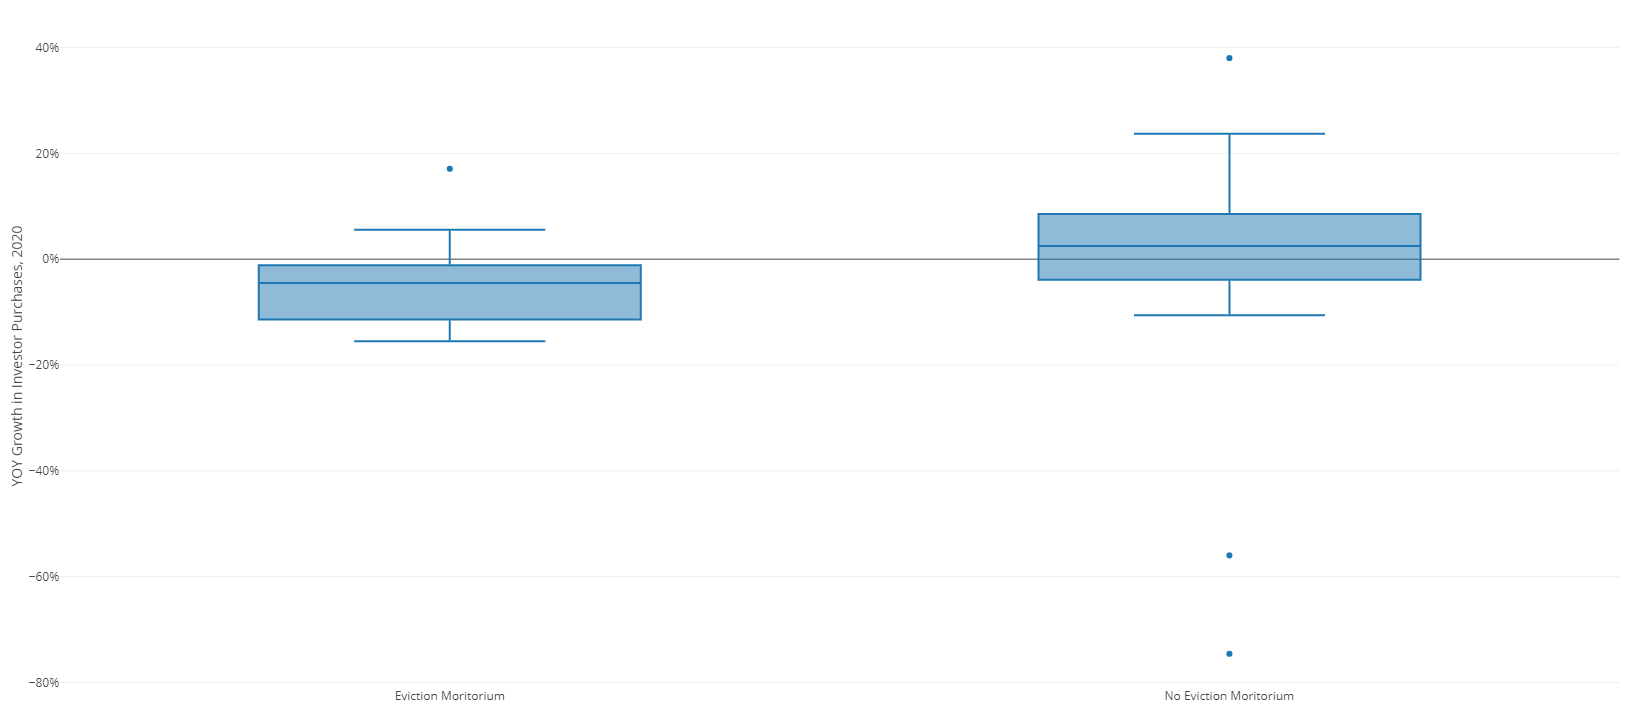
Figure 4, a box and whisker plot, shows some evidence for the idea that tenants’ rights could explain the investment patterns during 2020. The left box shows the distribution of growth in investor activity was much better in states that no eviction moratorium of any sort than places that had one at some point in 2020. Comparing the line at the center of each box we can see that the average state without an eviction moratorium saw a 2% increase in investor activity. In contrast, the median state with an eviction ban saw a 5% decline.
Of course, tenant rights are not the be-all-end-all in investor decision-making. Local economic and housing market fundamentals are still higher on the totem pole. A state could have the legal environment more skewed towards landlords than any other state, but no investor will not want to put their money there if there are no signs of appreciation or growth.
Such states as South Dakota and Mississippi had weaker tenant rights in 2020, but both experienced enormous declines in investor activity. Kansas was one of the higher states with a 5% growth in investor activity, and evictions are still limited there at the time of writing. Tenant rights mattered for investing in 2020, but they were a second-order consideration.
As COVID-19 related provisions are pulled back, expect to see investment activity pick up even more and for the geographic pattern of growth across the country to look very different than last year.
To learn more about the data behind this article and what CoreLogic has to offer, visit https://www.corelogic.com/.


Sign up to receive our stories in your inbox.
Data is changing the speed of business. Investors, Corporations, and Governments are buying new, differentiated data to gain visibility make better decisions. Don't fall behind. Let us help.


Sign up to receive our stories in your inbox.
Data is changing the speed of business. Investors, Corporations, and Governments are buying new, differentiated data to gain visibility make better decisions. Don't fall behind. Let us help.