Borrower Equity Update: Third Quarter 2021
National Home Equity Trends
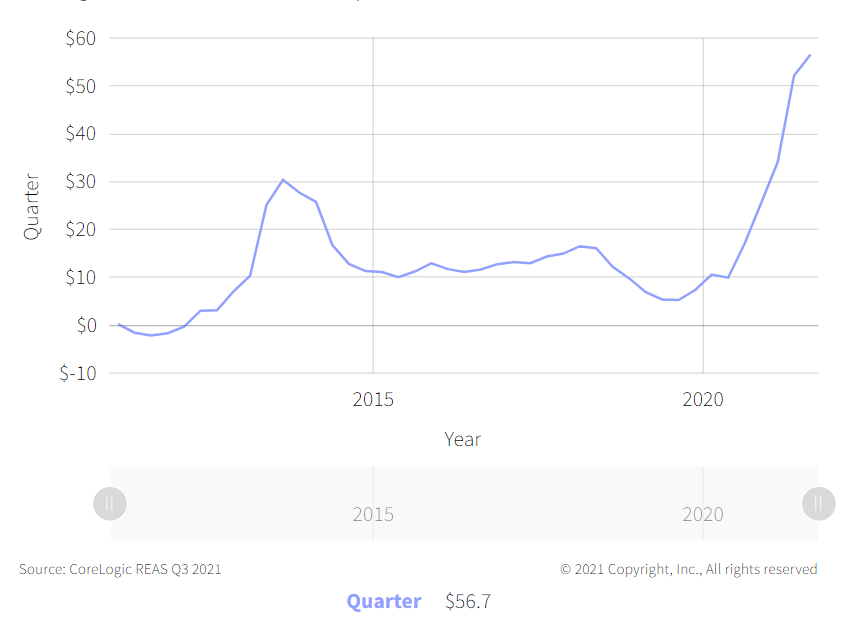
Soaring home prices over the past year boosted home equity wealth to new highs through Q3 2021. The amount of equity in mortgaged real estate increased by $3.2 trillion in Q3 2021, an annual increase of 31.1%, according to the latest CoreLogic Equity Report . The average annual gain in equity was $56,700 per borrower, which was the largest average equity gain in at more than 11 years, and more than three times the gain from a year earlier.
Figure 1: Annual Home Equity Gains Accelerated in 2021

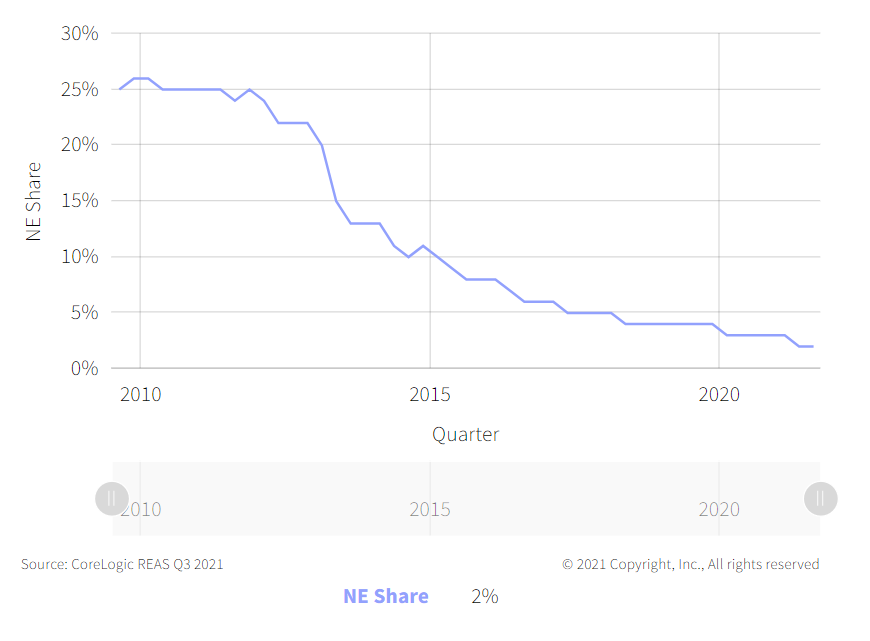
The nationwide negative equity share for Q3 2021 was 2.1% of all homes with a mortgage, the lowest share of homes with negative equity since CoreLogic started tracking this number in the third quarter of 2009. The number of properties in negative equity decreased by 70,000 to 1.2 million from Q3 2020 to Q3 2021.
Figure 2: Negative Equity Share Falls to Record Low
Share of U.S. Mortgages with Negative Equity

While the coronavirus pandemic created economic uncertainty for many, the continued acceleration in home prices over the last year has meant existing homeowners saw a notable increase in home equity. The accumulation of equity has become critically important to homeowners deciding on their post-forbearance options. In contrast to the financial crisis, when roughly 25% of borrowers were underwater, most borrowers today who are behind on mortgage payments can tap into their equity and sell their home rather than lose it through foreclosure.
State and Metro Level Home Equity
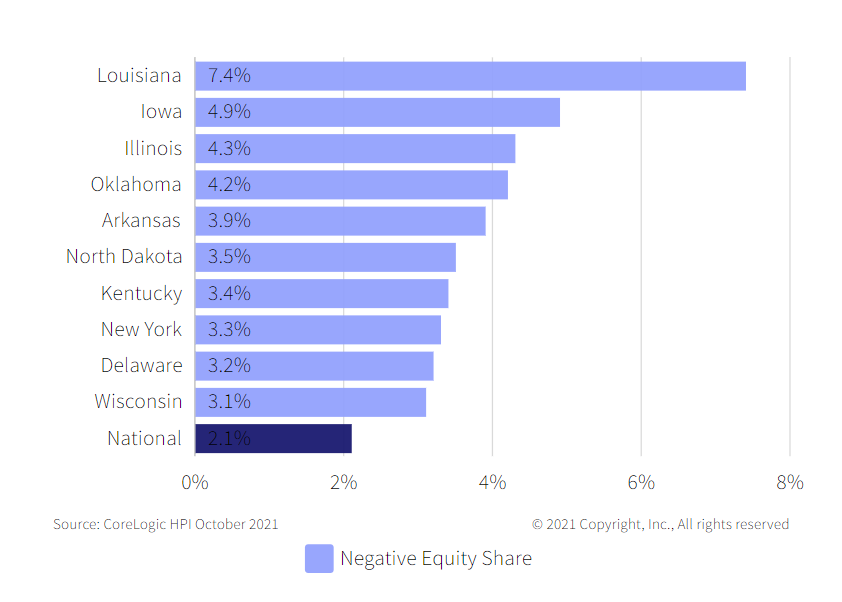
Figure 3 shows the ten states with the largest negative equity shares in Q3 2021. Louisiana stands apart with 7.4% of mortgages with negative equity – more than three times the national average. Iowa (4.9%) and Illinois (4.3%) rounded out the top three states with the highest negative equity shares. States with high negative equity shares have experienced low home price appreciation compared with the national average. In addition, places with high negative equity shares are at higher risk for foreclosure and distressed sales.
Figure 3: Ten States With the Largest Negative Equity Shares
Q3 2021

Home price growth is the principal driver of home equity creation and the CoreLogic Home Price Index reported home prices up 17.7% for the 12 months ending September, spurring the record gains in home equity wealth.
To learn more about the data behind this article and what CoreLogic has to offer, visit https://www.corelogic.com/.


Sign up to receive our stories in your inbox.
Data is changing the speed of business. Investors, Corporations, and Governments are buying new, differentiated data to gain visibility make better decisions. Don't fall behind. Let us help.


Sign up to receive our stories in your inbox.
Data is changing the speed of business. Investors, Corporations, and Governments are buying new, differentiated data to gain visibility make better decisions. Don't fall behind. Let us help.


