Source: https://www.corelogic.com/intelligence/ibuyer-activity-in-2021-doubled-from-pre-coronavirus-levels/
iBuyers concentrate in five states with fastest population growth in recent years
In addition to elevated demand for owner-occupied and second homes since the onset of the pandemic, there has also been an increase in investor home purchases across the U.S. housing markets. As the recent CoreLogic analysis showed, investor purchases accounted for about a quarter (26%) of all home purchases in the third quarter of 2021, up from 16% seen in 2019.
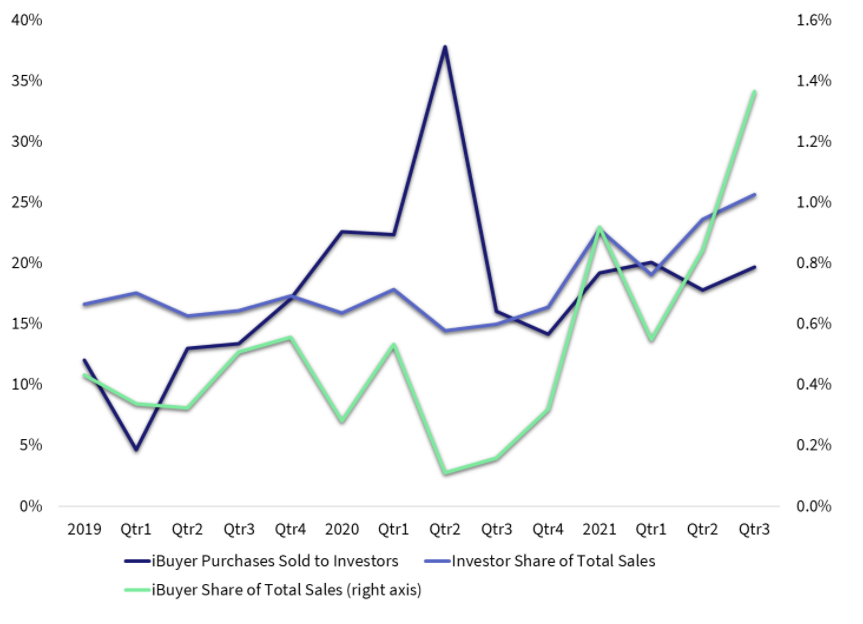
Among investors, there has also been an increase in iBuyer home purchases in 2021. An iBuyer, or “instant buyer,” is a real estate company that uses technology to buy and resell homes quickly. When selling a home to an iBuyer, the seller gets a cash offer for the home “as is” and avoids the uncertainty of knowing when and if their home will sell and if repairs are needed. While iBuyers have been around since about 2015, in 2021 their purchase activity doubled compared to 2019 levels and currently account for about 1% of total home purchases (Figure 1). Another trend that evolved over the past couple of years is that iBuyers have increasingly resold the homes in bulk to other (mostly big) investors. The share of iBuyer purchases resold to investors increased from 5% at the beginning of 2019 to 22% by the end of that year. Nevertheless, at the onset of the pandemic, resales to big investors surged to 38% as iBuyers looked to reduce their risks with market uncertainty and widespread lock downs. The resale share has since fallen back to 20% but could be partially contributing to overall increase in total investor share.
Figure 1: Investor and iBuyer activity was impacted by the pandemic
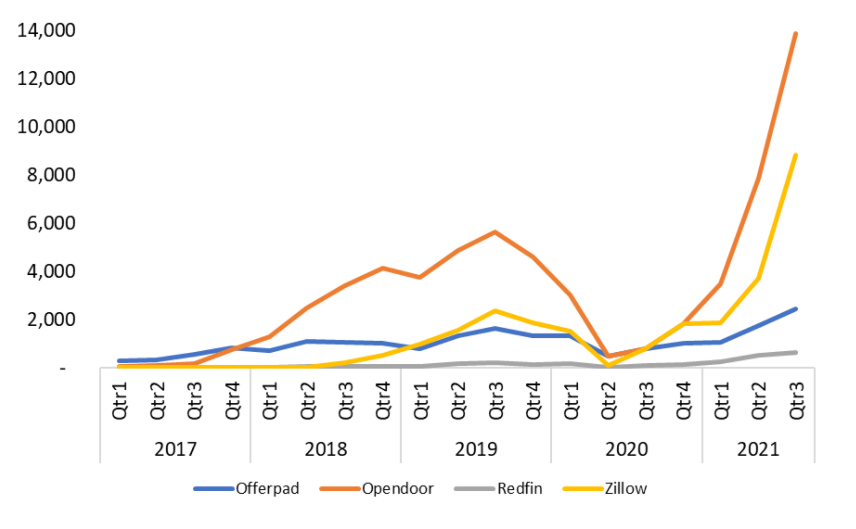
To delve further into the iBuyer activity, Figure 2 illustrates iBuyers home purchase trends since 2017. The figure includes the top four iBuyers, Opendoor, Zillow, Offerpad and Redfin – which account for over 95% of iBuyer purchases since 2017. While these iBuyers ramped up their activity in 2021, Zillow stands out with the largest increase in purchases compared to 2019 levels, up 222% in the first three quarters of 2021. Opendoor accounts for the largest share of overall purchases since 2017, totaling about 56%. Zillow ranks second with a total share of about 24% and Offerpad is third with 18% of purchases. Redfin has a smaller share at 2%.
Geographically, iBuyers have generally concentrated in areas that have seen the largest population gains in recent years. The top five states that comprised 75% of overall iBuyer purchases since 2017 include Texas (20%), Arizona (20%), Florida (12%), Georgia (13%) and North Carolina (10%). While these five states generally ranked in the top five since 2017, the ramp up of activity in 2021 in California brought the state to fourth place, replacing North Carolina.
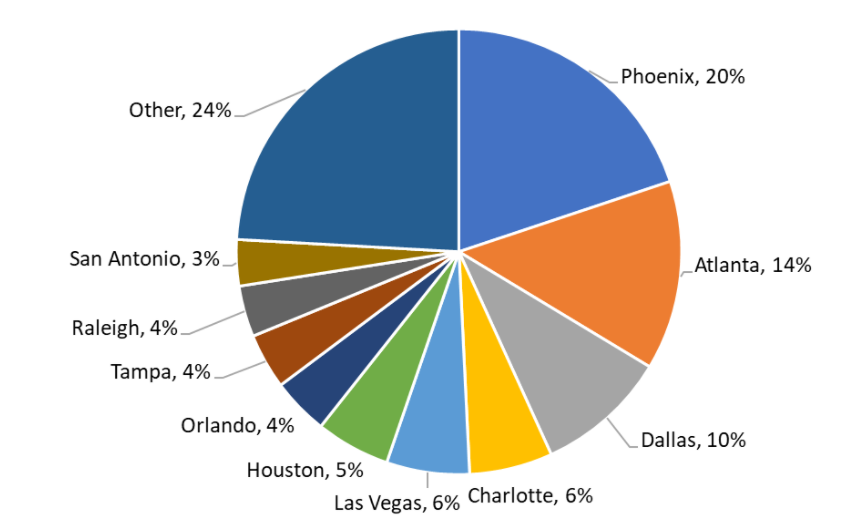
Like the concentration of iBuyer activity in the five states, 76% of purchases were located in 10 metro areas in those states. Figure 3 charts the distribution of purchases across the 10 metros. Phoenix, Arizona, which ranks with the highest share of iBuyer activity (20%), is where the majority of Arizona’s iBuyer purchases took place. Given the concentration of iBuyers in Phoenix, iBuyers accounted for relatively higher shares of total home purchases, about 6% of Phoenix’s purchases in the first three quarters of 2021. In Georgia, most iBuyer activity is concentrated in Atlanta, which accounts for 14% of overall iBuyer purchases. As a result, 5% of overall home purchases in Atlanta in 2021 are iBuyers.
In Texas, which accounted for 20% of purchases, iBuyers have tapped into multiple markets, including the three that rank with the highest concentration of iBuyers: Dallas (10%), Houston (5%) and San Antonio (3%). Florida is another state where more than one market ranks among the top 10 markets, including Orlando (4%) and Tampa (4%).
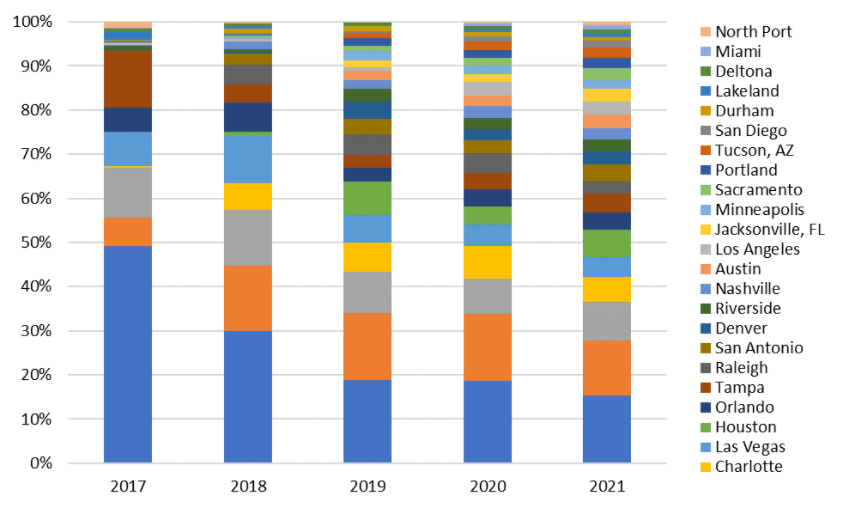
While the 10 markets illustrated in Figure 3 comprise the large majority of overall iBuyer purchases, in 2021 iBuyers have spread to more markets, although generally in the same five states. Figure 4 tracks distribution of iBuyer activity across metropolitan areas and over time. In 2017, almost half of purchases were in Phoenix. In fact, more than 90% of all activity occurred in only 6 markets. By 2021, only 15% of purchases were in Phoenix and a larger share was spread across several new markets, including other markets in Florida, California and Arizona.
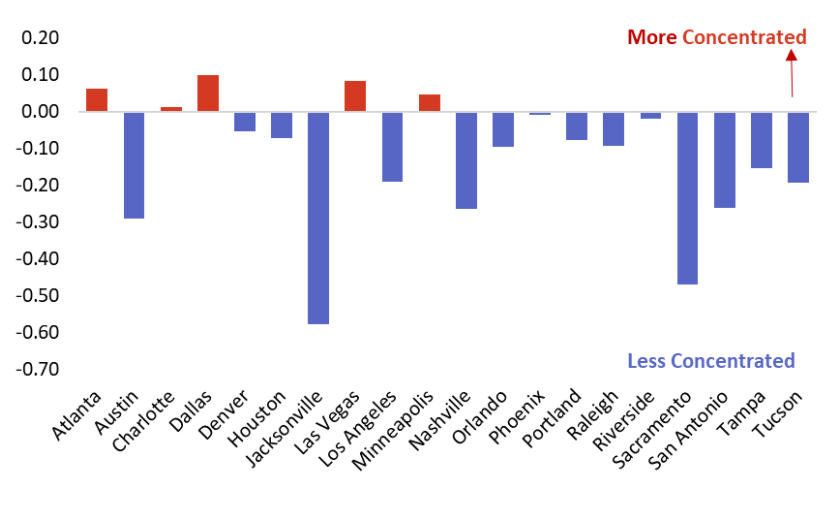
In addition, while the iBuyers were generally present in the same markets, some markets saw larger concentration of a single iBuyers while others saw more even distribution among the top four iBuyers. Overall, though, prior to pandemic, markets were generally more concentrated with some, like Jacksonville, FL and Sacramento, CA mostly seeing purchases by Opendoor only. In the wake of the pandemic, market concentration has fallen some suggesting that more frequently there were multiple iBuyers active in the local housing market.
Figure 5 illustrates the change in market concentration before the pandemic (January thru December 2019) and over the last year (October 2020 thru October 2021). A negative number in the chart suggests a market has become less concentrated between the two periods while a positive number suggests more concentration in iBuyer activity. Again, while market concentration has largely declined in most markets, Jacksonville and Sacramento stand out with largest declines as other iBuyers, Zillow in particular, had also entered those markets. In contrast, Dallas, Las Vegas and Atlanta experienced increases in iBuyer concentration which was largely driven by an increase in Opendoor’s share of total iBuyer purchases.
The analysis of iBuyer activity suggests that while their activity reached a record level in 2021, iBuyers remain a relatively small share of total transactions, about 1% nationally. In some markets, such as Phoenix and Atlanta, iBuyers have been a larger presence in the market, comprising 5% to 6% of overall home purchases and potentially having some impact on local prices and inventory. The impact may be compounded given that 1-in-5 of iBuyer purchases are resold to other investors.
Despite their geographical diversification in 2021, iBuyers seemed to be concentrated on locations with rapid population growth. Thinking ahead, some of population projections for the decade ahead suggest that many of fast-growing regions, such as Texas, South East, South West and Mountain West will remain a magnet for future population growth and potentially places of interest for real estate investors.
To learn more about the data behind this article and what CoreLogic has to offer, visit https://www.corelogic.com/.


Sign up to receive our stories in your inbox.
Data is changing the speed of business. Investors, Corporations, and Governments are buying new, differentiated data to gain visibility make better decisions. Don't fall behind. Let us help.


Sign up to receive our stories in your inbox.
Data is changing the speed of business. Investors, Corporations, and Governments are buying new, differentiated data to gain visibility make better decisions. Don't fall behind. Let us help.