
In anticipation of Airbnb’s IPO, we reviewed statements made in the company’s S-1 and compared them with our spend data of millions of de-identified US consumers. We’ve also added an appendix with a backtest of our data against the company reported GBV. Please reference for detail on biases and alignment with our data.
Key Takeaways
COVID Disruption, Then Rebound
“In early 2020, as COVID-19 disrupted travel across the world, Airbnb’s business declined significantly. But within two months, our business model started to rebound even with limited international travel, demonstrating its resilience…Domestic travel quickly rebounded…as millions of guests took trips closer to home. Stays of longer than a few days started increasing as work-from-home became work-from-any-home on Airbnb.”
Airbnb S-1
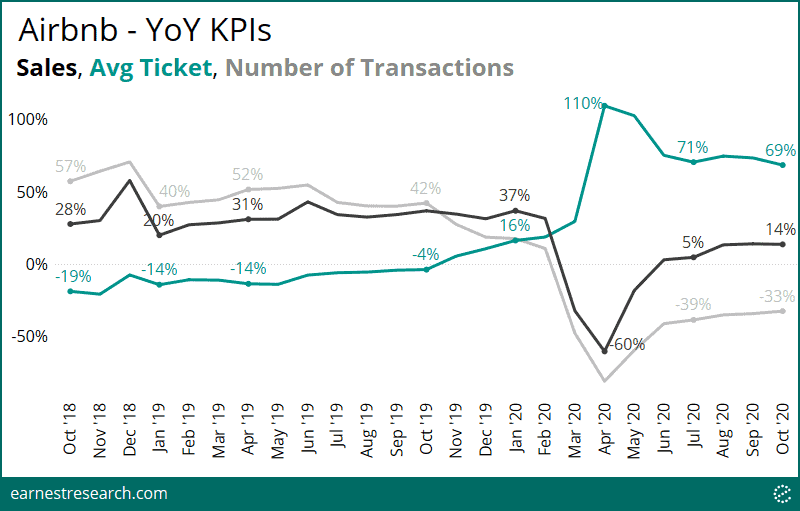
Spend on the gig economy hotel disruptor platform did indeed “decline significantly” during the initial outbreak of COVID in April and May 2020, falling ~60% YoY relative to the ~20 to 40% growth profile in the 18 months prior. There was a partial but still material rebound* in June and July, where growth improved to low single digits, which then further improved to mid-teens growth from August through October.
Additionally, while spend data cannot track the duration of an Airbnb visit, there was a material jump in average ticket growth (100%+), a reflection of the stated extended booking behavior, as longer stays come with higher price points. Importantly, ticket growth has remained elevated at ~70% growth over the last several months.
Market Share
“We believe our competitors include: Online travel agencies (“OTAs”) [and] hotel chains…”
We looked at Airbnb’s market share gains from the perspective of both the OTA and hotel markets, and further analyzed them pre- vs. post-COVID.
Before COVID, Airbnb’s market share gains amounted to over 20 points in the five years prior to COVID, surpassing both OTA competitor Expedia and hotel chains Marriott and Hilton, commanding ~30% of the hotel market and ~40% of the OTA market.
COVID only accelerated these gains further. While both markets were hit hard from April onwards, relative to traditional travel and hotel chains, the pandemic shined a positive light on Airbnb’s extended-stay and quarantine-friendly business model. This resulted in a further ~10 to 20 point share grab in the spring months, with only a recent trend towards normalization as traditional hotel chains revived a little in the recent months. We note that Expedia’s HomeAway platform also gained share through the spring with its equivalent extended-stay/quarantine-friendly model.
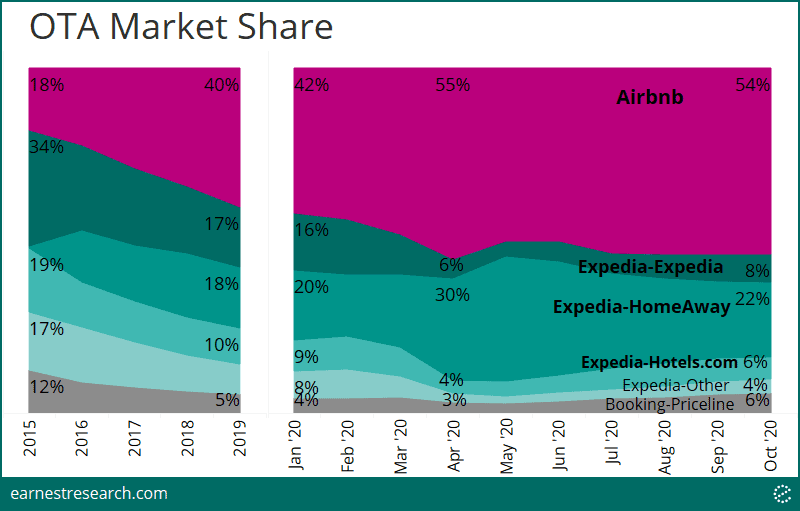
Expedia’s other platforms include Travelocity, Hotwire.com, Orbitz, Classic Vacation, and Egencia.
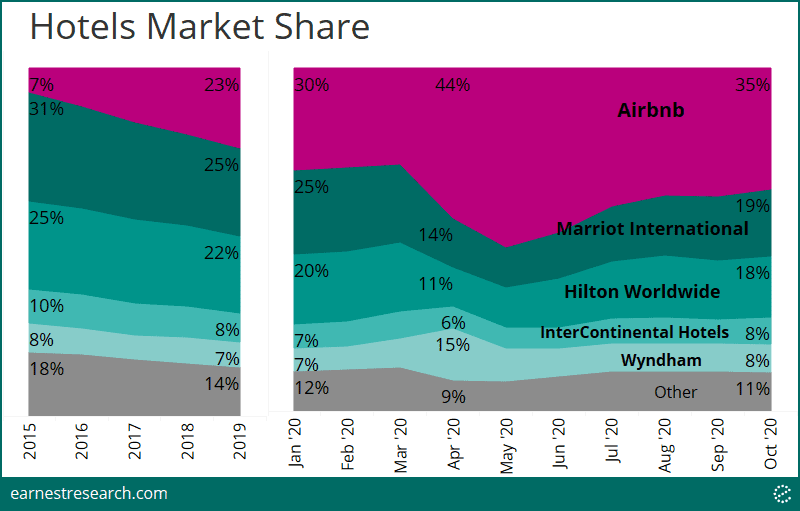
Other hotels include Best Western, Choice, Four Seasons, Hyatt, and La Quinta.
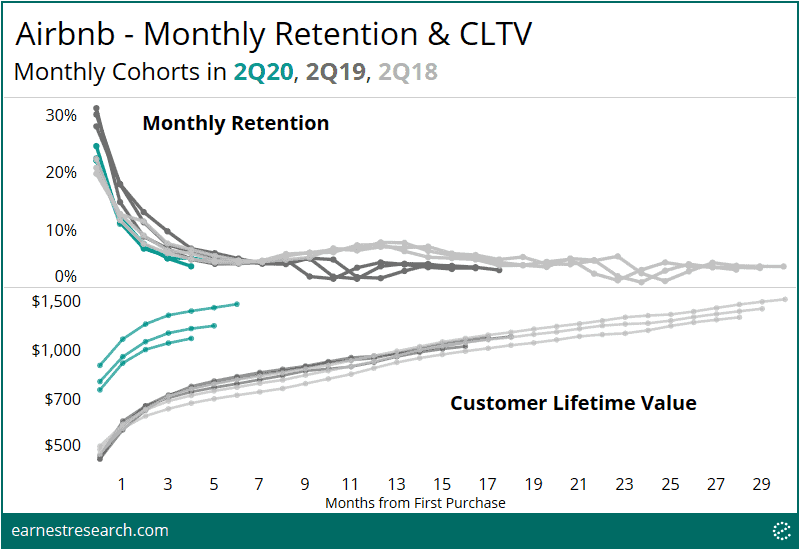
Guest Retention
“We believe the guest revenue retention of our community is higher than the customer retention of OTA distribution platforms in the United States, based on available third-party credit card data…Guest revenue retention will deteriorate across all cohorts in 2020 due to the decline in travel from COVID-19.”
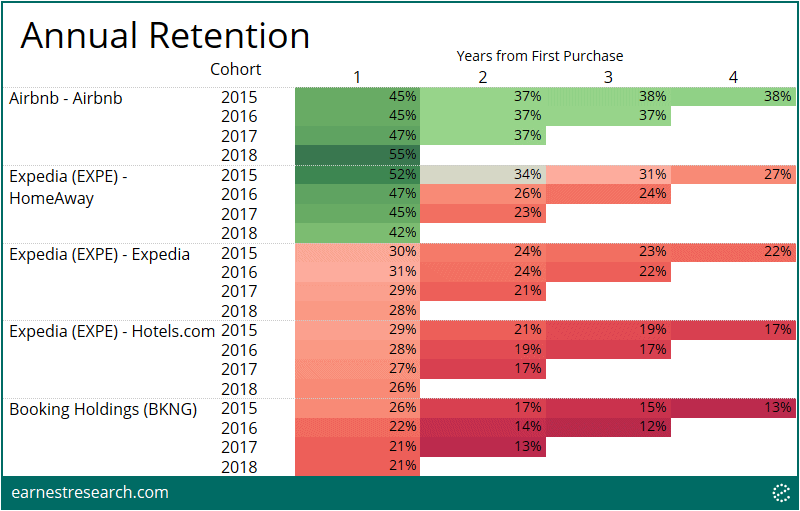
Earnest data shows Airbnb guests with higher retention rates relative to its peers, although, before 2018, retention was on par with—even slightly lower than—Expedia’s HomeAway platform. Roughly ~45% of the 15’, 16’ and 17’ Airbnb cohorts came back to the platform in the 12 months following their first booking; a rate that improved to ~55% for the 18’ cohort. Long term retention rates at Airbnb appear to stabilize at ~38%, substantially higher than its peers.
Further, all cohorts have indeed exhibited deteriorated retention throughout 2Q20. Importantly, however, the lifetime value of the 2Q20 cohort has been significantly higher, a product of increased ticket sizes due to longer stays as referenced above.
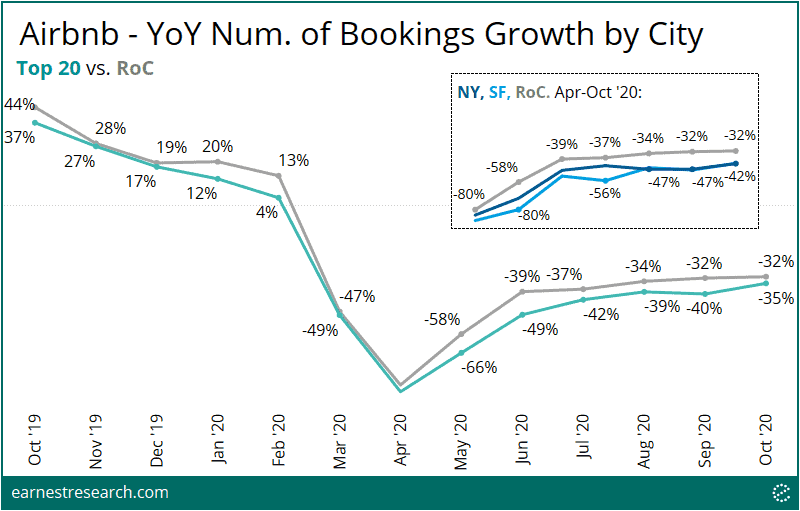
Top 20 Cities
“Travel outside of our top 20 cities (based on 2019 GBV) has been more resilient than those booked in our top 20 cities.”
While Earnest data is US only (vs. Airbnb’s global reach), the number of bookings made by consumers in the panel’s top twenty US cities declined ~5 to 10 points more than the rest of the country (RoC) throughout the pandemic months. We note that this appears to be mostly driven by NYC and SF, where consumers booking Airbnb trips fell ~10 to 20 points more than the rest of the country, and is still declining over ~40% relative to RoC’s ~30% declines in October.
Notes
*Based on the backtest (see appendix below), Earnest data overstated the actual rebound. Please reference the appendix note for detail on the relationship between the data and reported GBV.
Appendix: Airbnb Backtest
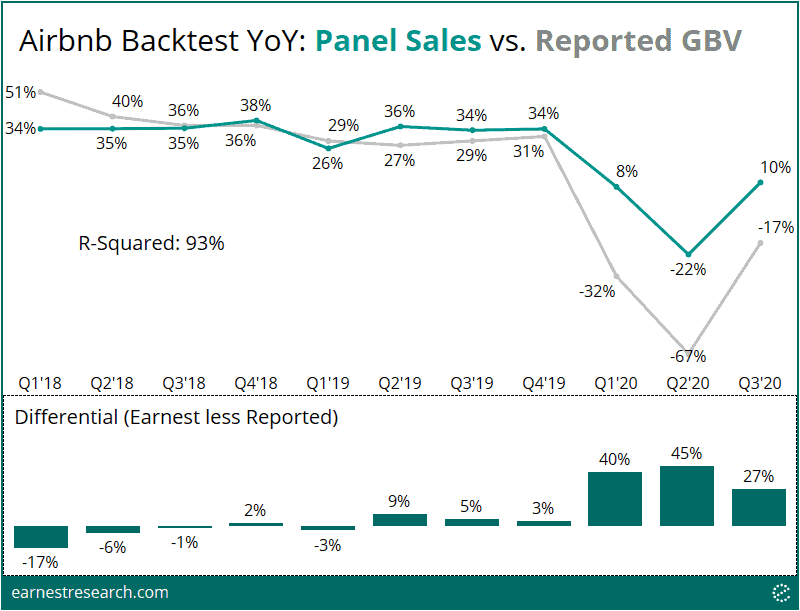
*Earnest panel sales are not entirely comparable to Airbnb GBV or revenue numbers. While the company recognizes GBV net of cancellations and alterations, Earnest data doesn’t account for these allowances (we note that cancellations were over 100% of gross bookings in April and May according to company filings, which is at least partially the reason for the higher differential). Additionally, the company recognizes the entire booking amount in GBV whether the guest pays the entire amount upfront or elects to use the Pay Less Upfront program, while Earnest data only sees the actual dollar amount paid. Like GBV, however, Earnest transactions are realized at the time of booking as well and can also act as a leading indicator of revenue. For revenue, Airbnb acts as a facilitator of the transaction between the host and guest, and thus only recognizes service fees, while Earnest sees the entire transaction amount. Additionally, revenue is recognized upon check-in, unlike Earnest data which is realized at the time of booking. Lastly, while Earnest tracks US data, Airbnb is global, with North America accounting for 42% of GBV in 2019 and 54% in the first nine months of 2020 (although, we note that Airbnb determines the geography based on the location of the host’s listing, and not by the location of where the booking occurred; it’s possible that the geographic breakdown of where bookings occur is much higher in the US).
To learn more about the data behind this article and what Earnest Research has to offer, visit https://www.earnestresearch.com/.


Sign up to receive our stories in your inbox.
Data is changing the speed of business. Investors, Corporations, and Governments are buying new, differentiated data to gain visibility make better decisions. Don't fall behind. Let us help.


Sign up to receive our stories in your inbox.
Data is changing the speed of business. Investors, Corporations, and Governments are buying new, differentiated data to gain visibility make better decisions. Don't fall behind. Let us help.