According to ATTOM Data Solutions’ newly released Q1 2021 Special Report, spotlighting county-level housing markets around the U.S. that are more or less vulnerable to the impact of the virus pandemic, states along the East Coast, as well as Illinois, were most at risk in Q1 2021 – with clusters in the New York City, Chicago and southern Florida areas – while the West continued to face less risk. ATTOM’s most recent Coronavirus housing impact analysis revealed that first-quarter trends generally continued those found in 2020, but with smaller concentrations around several major metro areas. The reported noted the number of counties among the top 50 most at-risk was down in the New York, NY; Philadelphia, PA and Washington, D.C. metro areas.
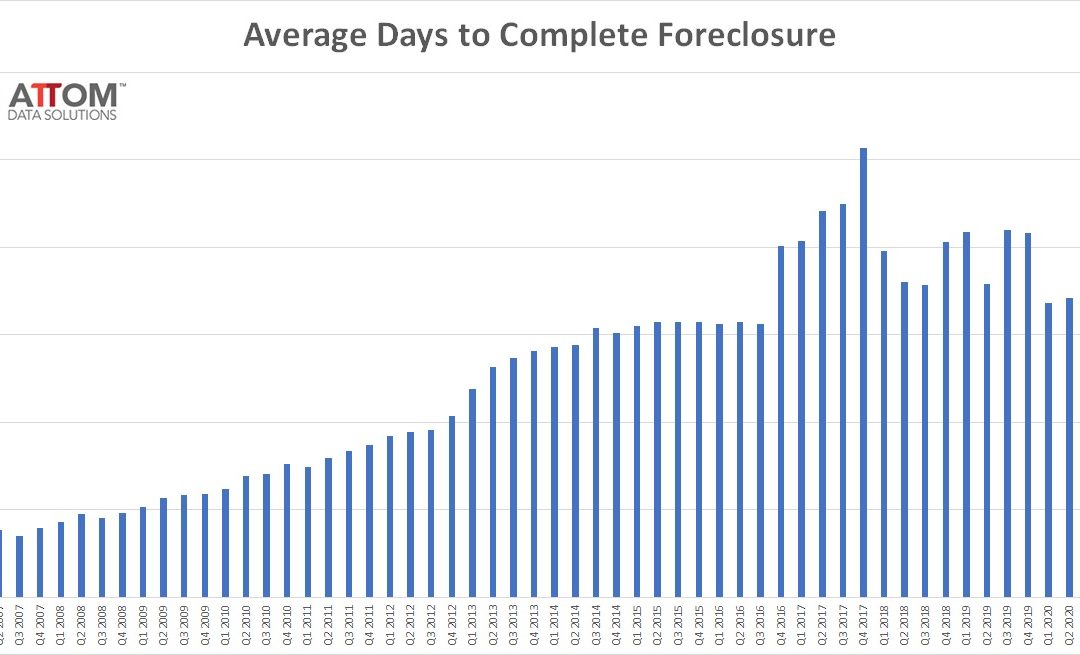
ATTOM Data Solutions, licensor of the nation’s most comprehensive foreclosure data and parent company to RealtyTrac (www.realtytrac.com), today released its Q1 2021 U.S. Foreclosure Market Report, which shows there were a total of 33,699 U.S. properties with foreclosure filings — default notices, scheduled auctions or bank repossessions — during the first quarter of 2021, up 9 percent from the previous quarter but down 78 percent from a year ago. The report also shows a total of 11,880 U.S. properties with foreclosure filings in March 2021, up 5 percent from the previous month but down 75 percent from March 2020 — the second consecutive month with month-over-month increases in U.S. foreclosure activity.
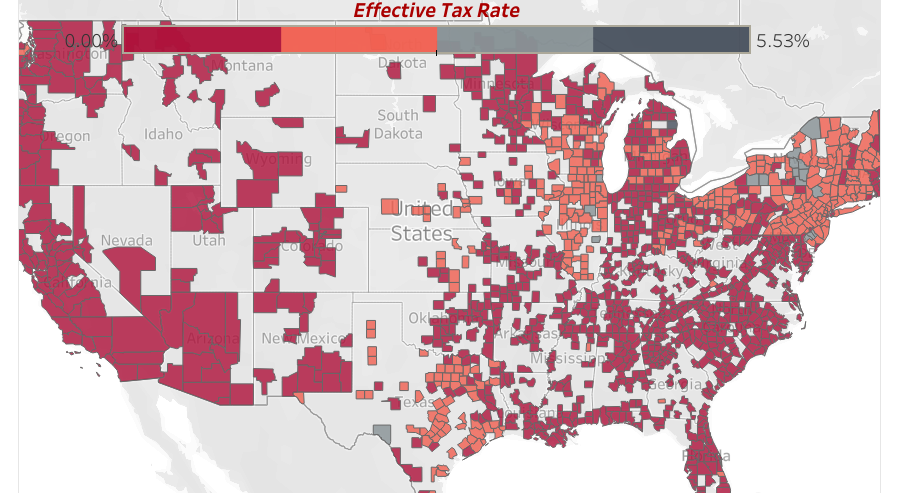
ATTOM Data Solutions, curator of the nation’s premier property database, today released its 2020 property tax analysis for almost 87 million U.S. single family homes, which shows that $323 billion in property taxes were levied on single-family homes in 2020, up 5.4 percent from $306.4 billion in 2019. The average tax on single-family homes in the U.S. in 2020 was $3,719 — resulting in an effective tax rate of 1.1 percent. The average property tax of $3,719 for a single-family home in 2020 was up 4.4 percent from $3,561 in 2019 while the effective property tax rate of 1.1 percent in 2020 was down slightly from 1.14 percent in 2019.
ATTOM Data Solutions’ new Q1 2021 U.S. Home Affordability Report shows that median home prices of single-family homes and condos in Q1 2021 were more affordable than historical averages in 52 percent of the counties analyzed. That figure was down from 63 percent in Q1 2020 and 95 percent in Q1 2016. The latest home affordability analysis conducted by ATTOM, reported that with workplace pay rising and home mortgage rates continuing to hit historic lows, major expenses on a median-priced home nationwide still consumed just 23.7 percent of the average wage across the country in Q1 2021. That figure was up from 22 percent in Q1 2020 and 19.7 percent in Q1 2016. However, the report noted that figure remained well within the 28 percent standard lenders prefer for how much homeowners should spend on those major expenses.
ATTOM Data Solutions, curator of the nation’s premier property database, today released its Q1 2021 Single Family Rental Market report, which ranks the best U.S. markets for buying single-family rental properties in 2021. The report analyzed single family rental returns in 495 U.S. counties, each with a population of at least 100,000 and sufficient rental and home price data. The average annual gross rental yield (annualized gross rent income divided by median purchase price of single-family homes) among the 495 counties is 7.7 percent for 2021, down from an average of 8.4 percent in 2020. Within that group of counties, the yield declined from 2020 to 2021 in 87 percent of counties. However, it’s not all bad news for rental property investors.
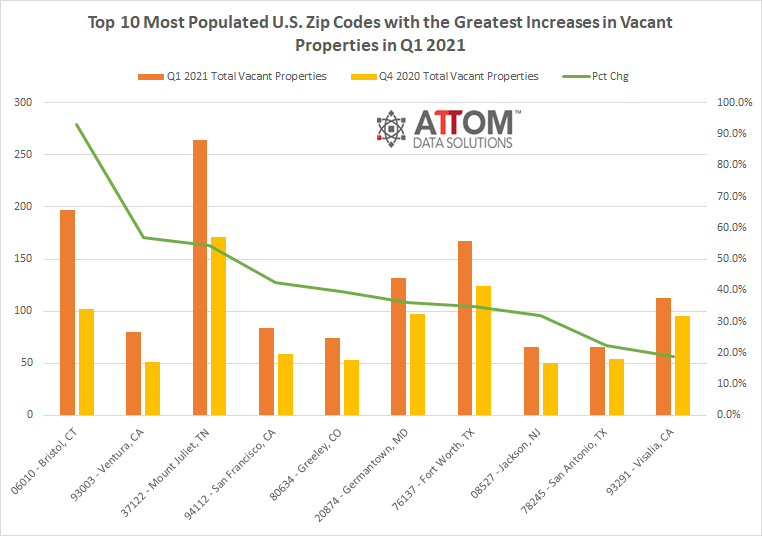
According to ATTOM Data Solutions’ new Q1 2021 Vacant Property and Zombie Foreclosure Report, there are just over 1.4 million U.S. residential properties sitting vacant in Q1 2021, representing only 1.5 percent of all homes. The report noted the number of pre-foreclosure homes sitting empty or “zombie foreclosures” is just 6,677. That figure is down 12.3 percent from 7,612 in Q4 2020 and 23.1 percent from 8,678 in Q1 2020.
In this report, ATTOM looked at 3,588 zones around the United States with sufficient sales data to analyze, meaning they had at least five home sales in the fourth quarter of 2020. The report found that median home prices increased from the fourth quarter of 2019 to the fourth quarter of 2020 in 77 percent of Opportunity Zones with sufficient data and rose by more than 10 percent in nearly two-thirds of them. Those percentages were roughly the same as in areas of the U.S. outside of Opportunity Zones.
ATTOM Data Solutions’ new Q4 2020 U.S. Home Equity and Underwater Report shows there were 17.8 million residential properties in the U.S. considered equity-rich in the fourth quarter of 2020. According to the report, the combined estimated amount of loans secured by those properties was 50 percent or less of their estimated market value. ATTOM’s latest home equity and underwater analysis reported that the count of equity-rich properties in Q4 2020 represented 30.2 percent, or about one in three, of the 59 million mortgaged homes in the U.S. That figure was up from 28.3 percent in Q3 2020, 27.5 percent in Q2 2020 and 26.7 percent in Q4 2019.
ATTOM Data Solutions, curator of the nation’s premier property database, today released its fourth-quarter 2020 U.S. Home Equity & Underwater Report, which shows that 17.8 million residential properties in the United States were considered equity-rich, meaning that the combined estimated amount of loans secured by those properties was 50 percent or less of their estimated market value.
ATTOM Data Solutions, curator of the nation’s premier property database, today released its Year-End 2020 U.S. Home Sales Report, which shows that home sellers nationwide in 2020 realized a home-price gain of $68,843 on the typical sale, up from $53,700 in 2019 and $48,500 two years ago. Profits rose in more than 90 percent of housing markets with enough data to analyze and the latest figure, based on median purchase and resale prices, marked the highest level in the United States since at least 2005.
According to ATTOM Data Solutions’ newly released Q4 2020 Special Coronavirus Report spotlighting county-level housing markets around the U.S. that are more or less vulnerable to the impact of the virus pandemic, pockets of the Northeast and other parts of the East Coast remained most at risk in Q4 2020, while the West continued to be less vulnerable.
ATTOM Data Solutions, curator of the nation’s premier property database, today released its fourth-quarter 2020 Special Coronavirus Report spotlighting county-level housing markets around the United States that are more or less vulnerable to the impact of the virus pandemic. The report shows that pockets of the Northeast and other parts of the East Coast remained most at risk in the fourth quarter – with clusters in the New York City and Philadelphia, PA areas – while the West continued to be less vulnerable.
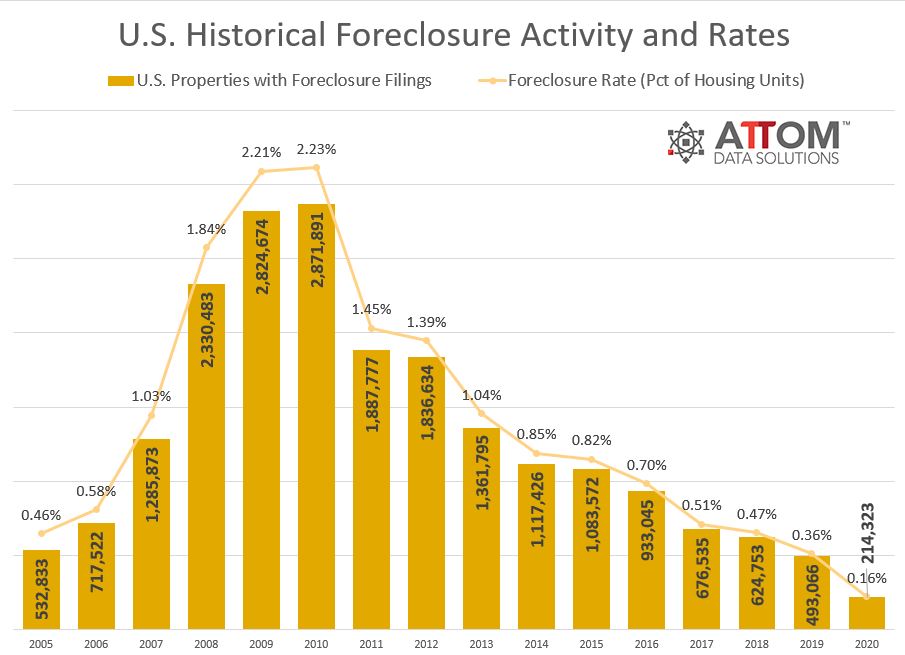
Foreclosure filings— default notices, scheduled auctions and bank repossessions — were reported on 214,323 U.S. properties in 2020, down 57 percent from 2019 and down 93 percent from a peak of nearly 2.9 million in 2010, to the lowest level since tracking began in 2005.
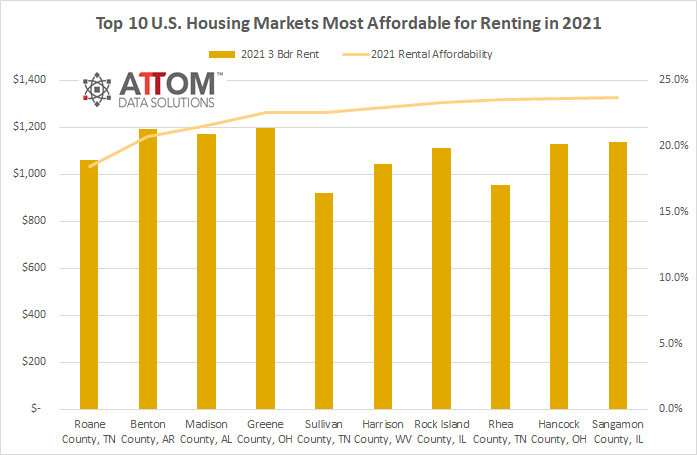
According to ATTOM Data Solutions’ newly released 2021 Rental Affordability Report, owning a median-priced three-bedroom home is more affordable than renting a three-bedroom property in 63 percent of the U.S. counties analyzed. The annual report noted this trend is occurring despite median home prices increasing more than average rents over the past year in 83 percent of those counties and rising more than wages in almost two-thirds of the nation.
Average Wage Below Level Needed To Afford Typical Home in the U.S.; Affordability Worsened in Fourth Quarter in 55 Percent of Housing Markets; Median Home Prices Up At Least 10 Percent in Most of Nation
ATTOM Data Solutions, curator of the nation’s premier property database, today released its annual 2020 Grocery Store Wars analysis, which shows how living near a Trader Joe’s, a Whole Foods or an ALDI might affect a home’s value – as a homebuyer based on home price appreciation and home equity, or as an investor looking for the best home flipping returns and home seller ROI.
The key takeaways from ATTOM Data Solutions’ newly released November 2020 U.S. Foreclosure Market Report revealed that foreclosure filings were down 14 percent from October 2020, Florida posted the highest foreclosure rate and greatest number of REOs, and while foreclosure starts were down across the nation, a few states did see monthly increases in November 2020.
10,042 U.S. Properties Received a Foreclosure Filing in November 2020, Down 14 Percent from Last Month; Florida tops out with the highest foreclosure rate, leading the nation in REO filings; Foreclosure Starts Uptick Monthly in Missouri, Indiana and Georgia
Buying a foreclosed home in the United States isn’t always as sweet a deal as it looks on paper. It could sit in a distressed neighborhood or come with a long list of costly repairs, not to mention old liens that the bank didn’t pay off before putting it up for sale.
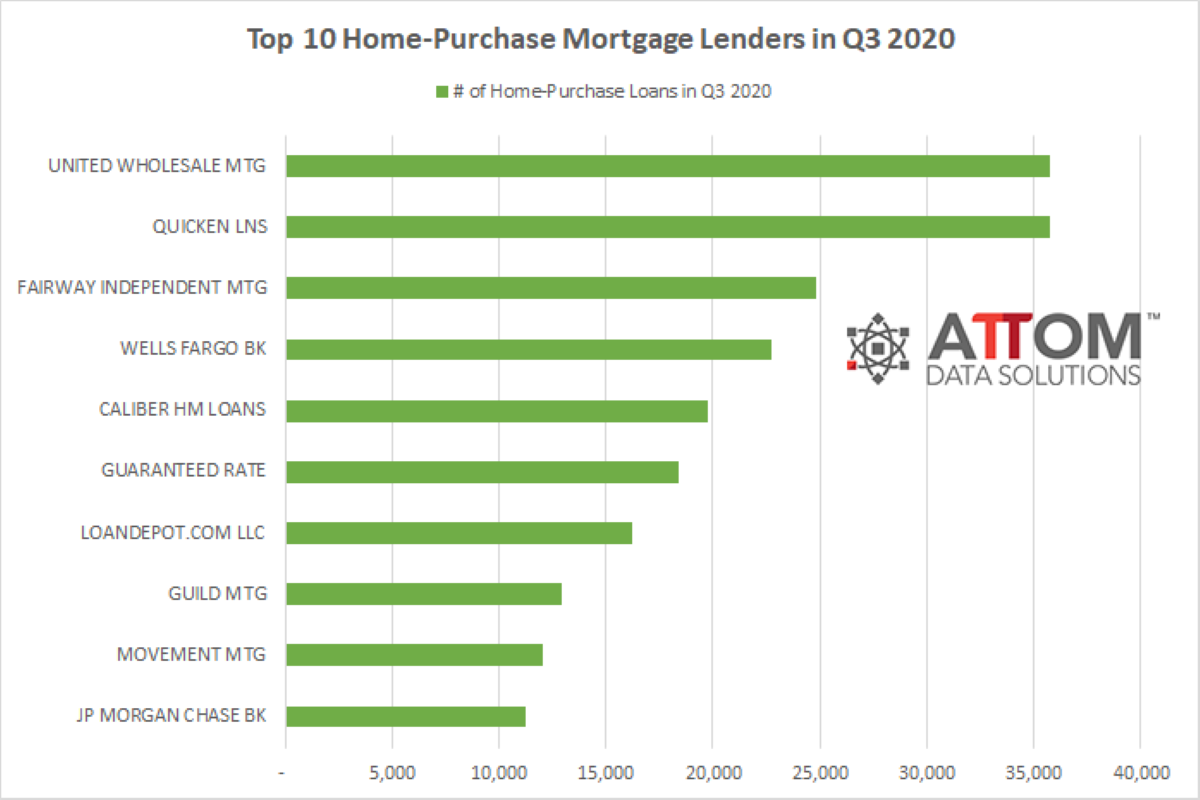
ATTOM Data Solutions’ newly released Q3 2020 U.S. Residential Property Mortgage Origination Report shows that 3.25 million mortgages secured by residential property were originated in Q3 2020 in the U.S. The report noted that figure was up 17 percent from Q2 2020 and 45 percent from Q3 2019, to the highest level in 13 years.


