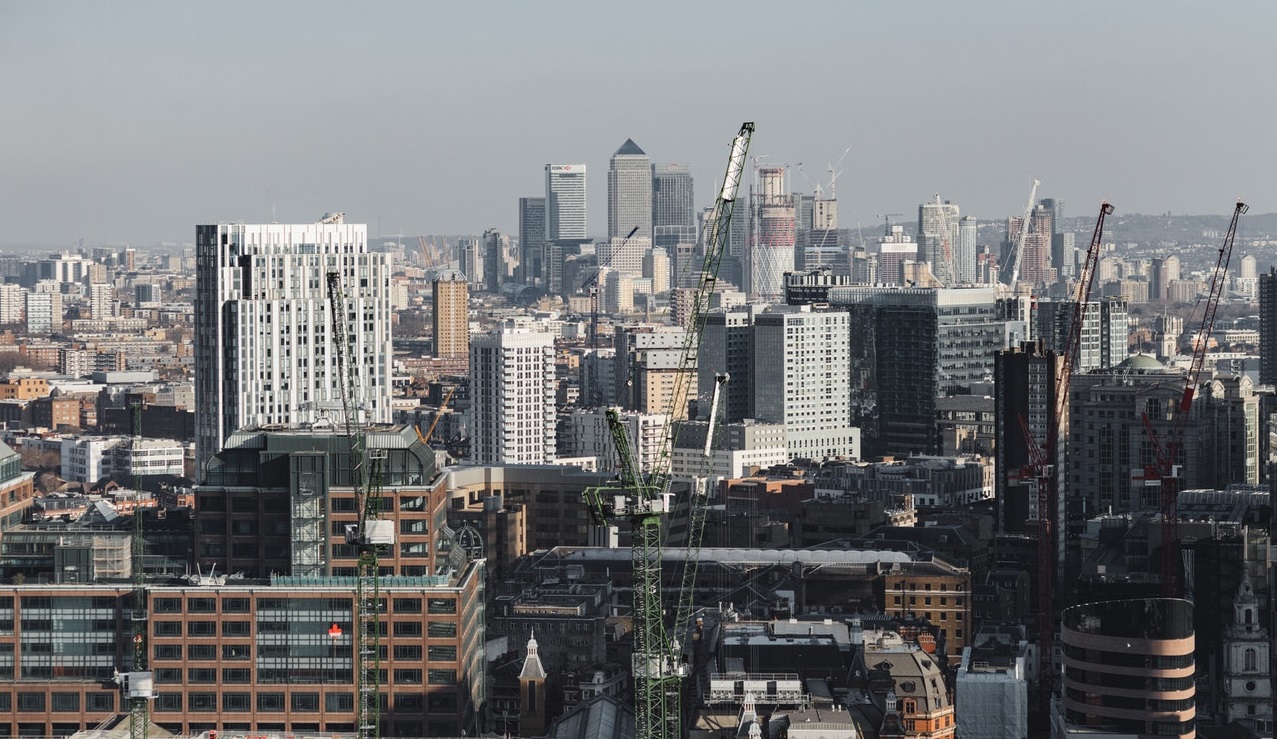
Investment in commercial property outside London has set a new record for the first nine months of the year, powered by investor demand for industrial assets. U.K. regional property sales volume reached £27.7 billion ($37.6 billion) in the year through September, a 22% increase on the average January-to-September period in the five years prior to Covid. Compared to 2020, transaction volume is up nearly 60% year to date.
The infamous dot plot from the Federal Reserve meeting last week suggests an expectation of a 2022 liftoff for U.S. interest rates. But who knows, forecasting interest rates is not like forecasting commercial property market trends: a lot can happen quickly. Still, seeing that chart, market professionals are asking if cap rates will go up if that expectation comes to pass in 2022. My question is, why should cap rates start responding to interest rates now all of a sudden?
The composition of lenders in the U.S. commercial mortgage market has largely returned to its form before the Covid-19 crisis struck, the latest US Capital Trends report shows. CMBS originators, who had been particularly hard hit in the second quarter of 2020, captured an 18% share of the commercial mortgage market in the past quarter, which put them behind only regional/local banks as the largest source of financing. The rebound reflects an easing of the uncertainty in the lending market, which had limited CMBS originators to just a 1% share of lending a year ago.
A year and a half into the Covid-19 pandemic and loss rates for U.S. commercial real estate loans are not looking that bad. With the exception of the hotel and CBD office sectors, loss rates so far are well below the pace set through this stage of the Global Financial Crisis. The macroeconomic factors driving loan performance were simply different in this downturn. Investor tolerance for risk has followed a unique path during the Covid-19 downturn, one that varies from that seen during the GFC.
Manufactured housing represents a small share of the U.S. commercial real estate market, at approximately 1% of total deal volume, but activity in this alternative sector is gaining momentum. Sales of individual properties reached the highest levels yet in the second quarter. Acquisitions in the four quarters through Q2 2021 totaled $4.1 billion, up 48% compared with the prior four quarters and 30% above the average seen since 2017.
U.S. commercial real estate sales climbed in July and the rate of price growth accelerated as most but not all property sectors advanced past the pandemic recovery phase. Deal volume for the month rose 74% from a year ago and was above the average pace set across each July since 2005. The apartment sector was the lead destination for capital in July, constituting 35% of total commercial real estate investment, the latest edition of _US Capital Trends_ shows.
Australia’s industrial sector is going through an extended purple patch, so it comes as little surprise that yields are trending down across all price brackets. Still, the more significant industrial deals have seen yields compress more so than the smaller end of the market, as investors appear willing to splash out to secure a premium offering. Yields on transactions in excess of A$100 million are now trading at an average of 4.8%, down from 6.3% just two years ago.
Global commercial property price growth accelerated in the second quarter of 2021, the third successive quarter of increasing gains. The headline price index rose 4.8% from a year prior and 1.5% from the previous quarter, the latest _RCA CPPI Global Cities_ report shows. Seoul posted the largest price increases into midyear. Prices rose 22% year-over-year, bolstered as domestic investors who had been thwarted by global travel restrictions employed their spending power at home.
Industrial investment in Asia Pacific broke a high-water mark at the end of 2020, but investors aren’t done yet. Prior to 2021, quarterly volume had surpassed the $10 billion level only twice – in the first quarter of 2018 with the privatization of GLP, and in the fourth quarter of 2020, when over $12 billion of industrial deals were completed. The exchange of the Milestone Industrial Portfolio for A$3.8 billion ($2.8 billion) in June, Australia’s biggest ever industrial deal, helped push overall APAC industrial investment on level footing with the office sector.
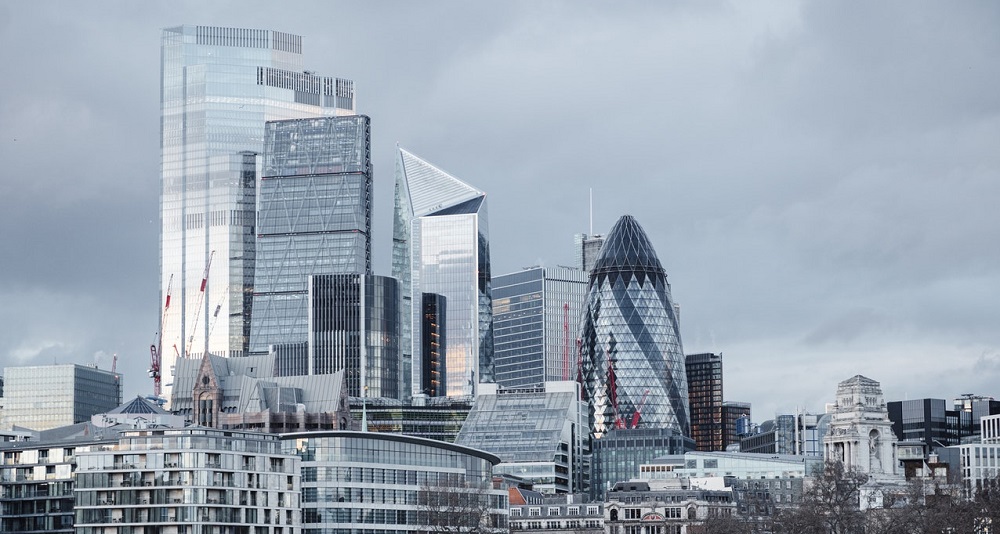
Europe’s commercial property market moved back into the black in Q2 2021 after four quarters of declines in deal activity caused by the pandemic, the latest _Europe Capital Trends_ report shows. Commercial property sales increased 20% compared to a year ago, led by the U.K. where sales jumped 77%. Industrial sector deals and a couple of large London office transactions boosted the U.K. deal volume total. London was the most active commercial property market for the first six months of the year, reclaiming the top spot from Paris, which fell to third position.
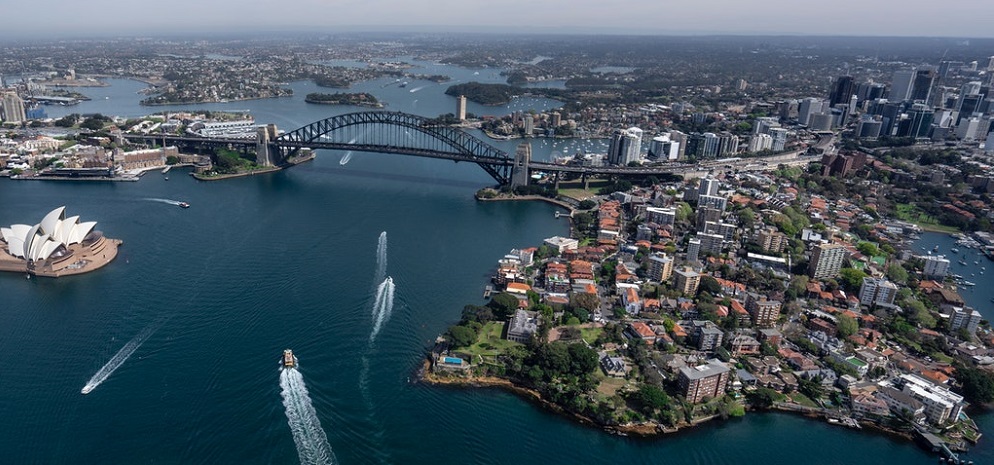
Australian commercial real estate sales rose in the second quarter, fueled by increased deal appetite among domestic investors and a multibillion-dollar logistics deal, the latest _Australia Capital Trends_ report shows. Sales of income-producing properties priced A$1 million and greater totaled A$13.4 billion (US$9.9 billion) in Q2 2021, a 15% improvement on deal levels of a year ago. The biggest boost for the quarter was Blackstone’s sale of the 45-property Milestone Industrial Portfolio. The transaction was the largest portfolio deal on record in Australia.
As the opening ceremony of the Tokyo Olympics draws near, we examine commercial property transaction volumes across Asia Pacific to see which country is on track for the gold medal in 2021. Japan had an unbroken record of 13 consecutive annual number one rankings from 2007, when Real Capital Analytics started comprehensively collecting data across the region. However, Japan comes into the delayed Tokyo Games on the back of a second-place finish, with China standing at the top of the podium in 2020.
The jet boost that the pandemic provided to online retailers has accelerated investor demand for the warehouse properties crucial to the supply chain. In the U.S., just shy of one-quarter of all investment transactions were for industrial assets in 2020 — a record for the market. In Europe a record was also set, with 16% of all 2020 transaction volume involving industrial property, Real Capital Analytics data shows. Warehouse properties let to Amazon — the business that has perhaps most changed the way consumers in Europe and North America shop — are in strong demand.
Everyone seems to love the U.S. industrial sector these days, but when did so many investors come to that conclusion and how long can it continue? The rise of e-commerce has been a driving force behind changing investor perceptions on the sector, but there are two misleading signals in the trends for e-commerce. The industrial sector was long viewed as sleepy and slow-moving, and few investors saw exciting opportunities within such a low volatility sector. Industrial deal volume represented only 15% of investment in the big four sectors
For the past two quarters, Boston has ranked as the most liquid commercial property market in the U.S., bumping Manhattan into second place, according to the RCA Capital Liquidity Scores. In the chart below we illustrate how Boston has usurped Manhattan, showing the six inputs which are weighted to calculate the overall scores. –For Boston, the component of unique, active buyers has slipped only slightly in the past four quarters, while for Manhattan this input has been falling since the end of 2019, dropping at an accelerated pace over the past two quarters.
The headline rate of U.S. property price growth quickened in May, powered by accelerating increases in apartment prices and gains across all major property types, the latest _RCA CPPI: US_ summary report shows. The US National All-Property Index grew 0.8% from April and 8.9% from a year ago. Apartment sector prices were the fastest growing in May at 10.1% year-over-year, overtaking industrial at 9.5%. Office price growth came in at 2.9% and the retail sector turned in a 2.3% annual gain.
U.S. commercial real estate transaction volume jumped in May compared to a year prior when the pandemic put the brakes on activity, the latest _US Capital Trends_ report shows. Apartment sector activity was more than double that seen a year ago and deal volume surpassed that of the office and industrial sectors combined. For the first five months of 2021, the apartment sector is the only major property type to eclipse deal levels in the same months of 2020 and the average of the years leading up to the pandemic.
Canadian investors have been one of the most resilient sources of capital throughout the pandemic era so far. Since the beginning of 2020 they have largely maintained their capital outlay, though there has been a marked shift in where that capital has headed. Up until 2019, the U.S. had been garnering an increasing share of Canada’s overseas spending. However, since 2020, Canadian investors have diverted their attention outside North America, with around half of outbound allocations leaving the continent.
Investors intent on not letting a crisis go to waste will need to see beyond the distressed investing playbook that was formulated during the Global Financial Crisis (GFC). A different kind of crisis warrants a different distressed investment strategy and those investors strictly playing by past rules are likely to miss out. Distressed investing in the GFC era was about firms stepping in to help rebalance the capital stack. There were cash-flowing assets that simply had too high of a debt burden relative to income
As we approach the midpoint of the year, it’s worth examining how commercial real estate markets are faring in comparison with the year of Covid’s eruption and prior years. RCA’s tracking of global commercial real estate sales shows all three global zones — the Americas, Asia Pacific, and Europe, the Middle East and Africa (EMEA) — remain deeply impacted. Volumes observed now across all zones globally are lower than both 2020 and the average of 2017-19 activity, but the severity of the drop varies across the world.


