Source: https://insights.consumer-edge.com/2020/12/stitching-together-the-pieces-of-the-stitch-fix-story/
The recent work-from-home trends have made daytime pajamas the norm and led to declining sales (and in some cases bankruptcy) for many business casual clothing brands. One company that seems to be bucking the trend is Stitch Fix, which recently reported surprisingly strong sales trends. In this week’s Insight Flash, we dig deeper into how Stitch Fix’s business model of styling fees followed by item purchases may be driving that success, and how the company could see further gains from data-driven product enhancements.
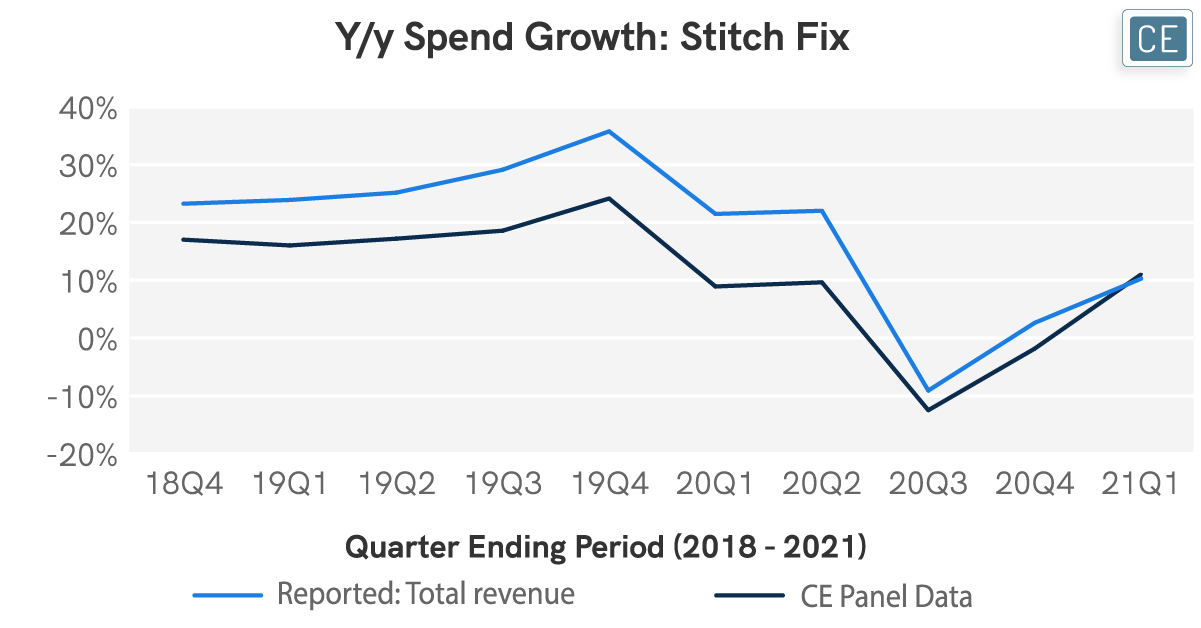
Stitch Fix Sales vs. CE Data
For Stitch Fix, success isn’t simply a function of how many customers are paying its monthly $20 styling fee to receive a box of product. It’s also contingent on how many of those customers convert to buying items from those boxes (the $20 styling fee is applied against the item price). Using our newly launched Ticket Buckets dashboard, we can separate out what percentage of Stitch Fix transactions are within the price range of a styling fee vs. how many are likely item purchases. From the end of 2019 through the beginning of 2020, inferred styling fees went down as a percentage of total transactions, with more inferred product purchases in the $25-100 range. Those trends held through June, when smaller ticket inferred product purchases of $25-100 decreased in share to make way for higher-ticket $100-200 purchases.
Stitch Fix Ticket Buckets
![]()
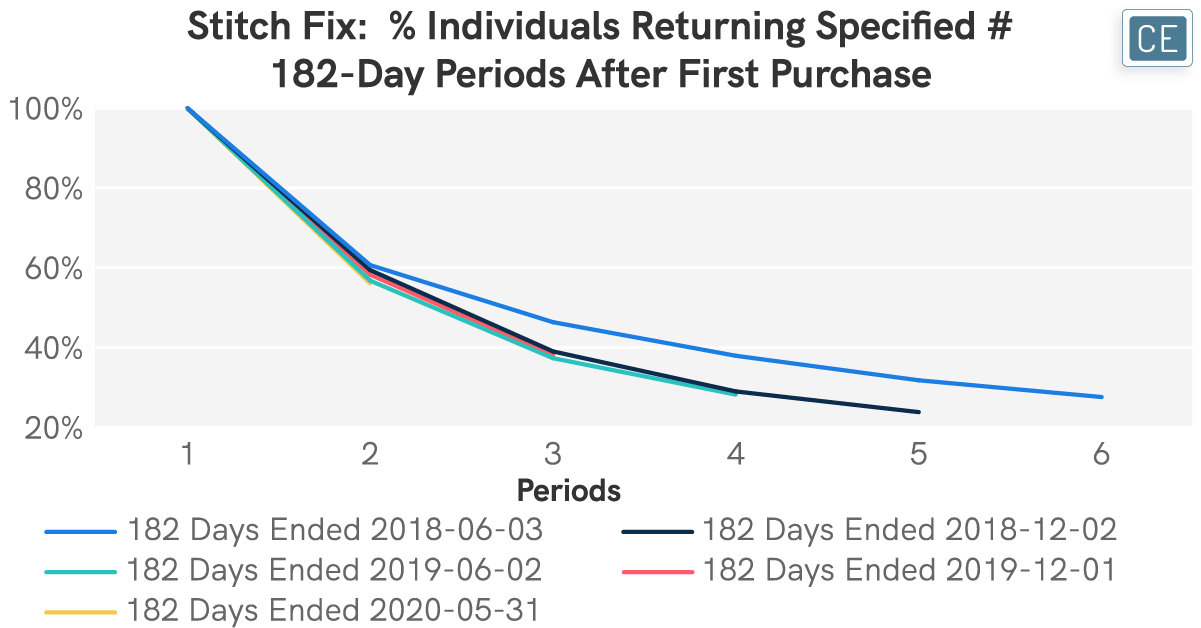
The business model seems to be working. In addition to showing increased item purchases recently, Stitch Fix has done a consistent job of holding onto its customers. The monthly styling fee means that subscribers to the service are making at least one transaction every month. Our Customer Loyalty dashboard shows that no matter which six-month period you look at for first sign-up, those repeat purchases are remarkably consistent – 56-61% of subscribers are still purchasing six months later, 37-46% twelve months later, and 28-38% eighteen months later. Stitch Fix seems to have hit the magic formula for keeping people coming back for the monthly styling fee while also getting them to pay more recently through increased and higher ticket item purchases.
Customer Loyalty
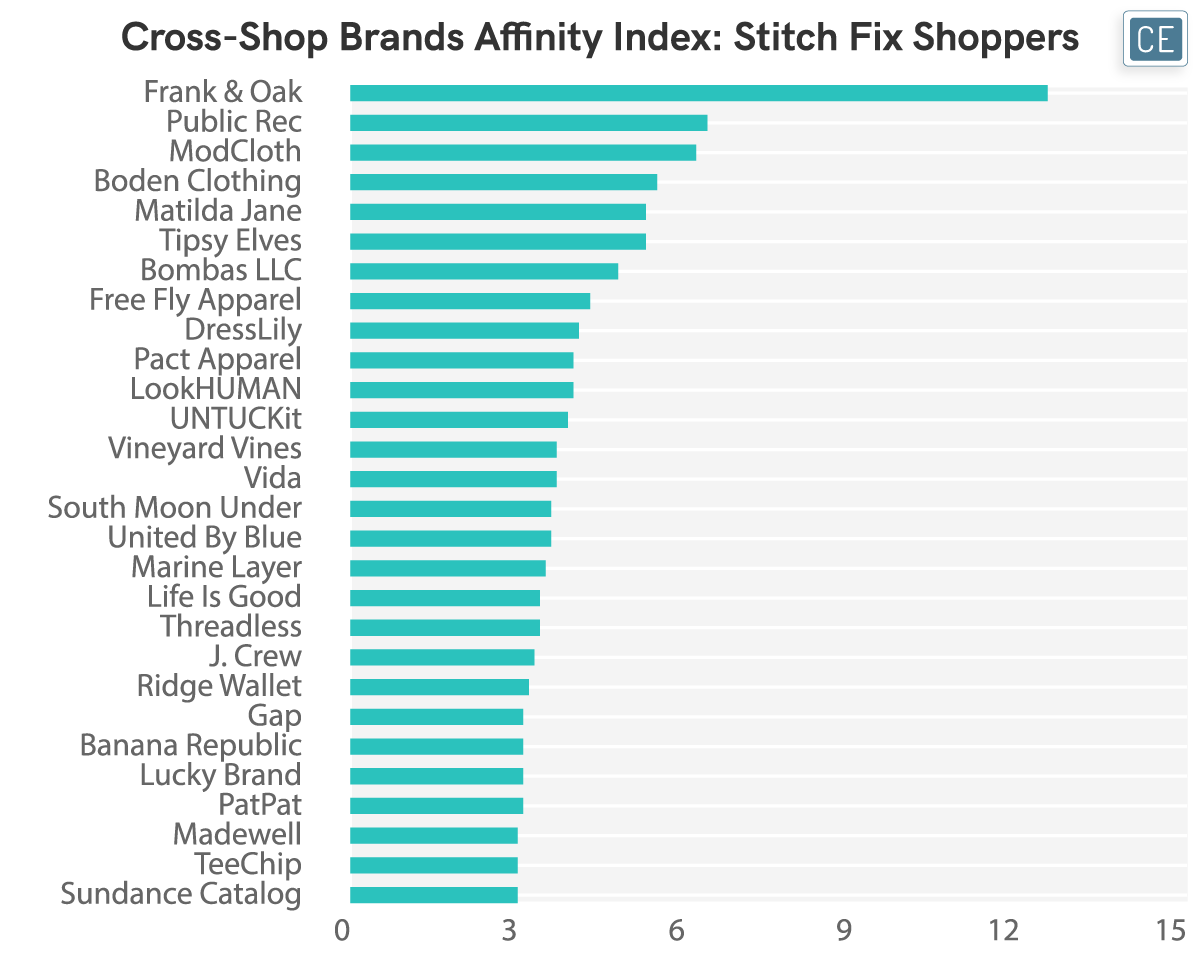
But is there more room for growth? One interesting use of our brand new Cohort Cross-Shop dashboard is the ability for companies to look at where else their customers shop in order to unearth ideas for potential high-payoff product expansions. For instance, knowing that Frank & Oak shoppers are 12.5x as likely as the average shopper to purchase at Stitch Fix, Stitch Fix designers may try to create more pieces with a similar aesthetic. Or, seeing that Bombas customers are 4.8x as likely as the average shopper to purchase at Stitch Fix, they may decide to add more socks to their boxes.
Cross-shop
While most corporations have the ability to see their own product mix, often the mix at competitors can be opaque. Our ticket bucket dashboard allows users to get some insight into what kinds of products competitors are selling, especially when pricing tiers are stratified. Customer loyalty can further enhance this view by allowing companies to see how many of a competitor’s customers are coming back and showing longer term loyalty. Finally, cross-shop can be not only a barometer of competitive threat, but also an idea generation platform for new products that a company’s own shoppers have shown an affinity for.
To learn more about the data behind this article and what Consumer Edge Research has to offer, visit www.consumer-edge.com.


Sign up to receive our stories in your inbox.
Data is changing the speed of business. Investors, Corporations, and Governments are buying new, differentiated data to gain visibility make better decisions. Don't fall behind. Let us help.


Sign up to receive our stories in your inbox.
Data is changing the speed of business. Investors, Corporations, and Governments are buying new, differentiated data to gain visibility make better decisions. Don't fall behind. Let us help.