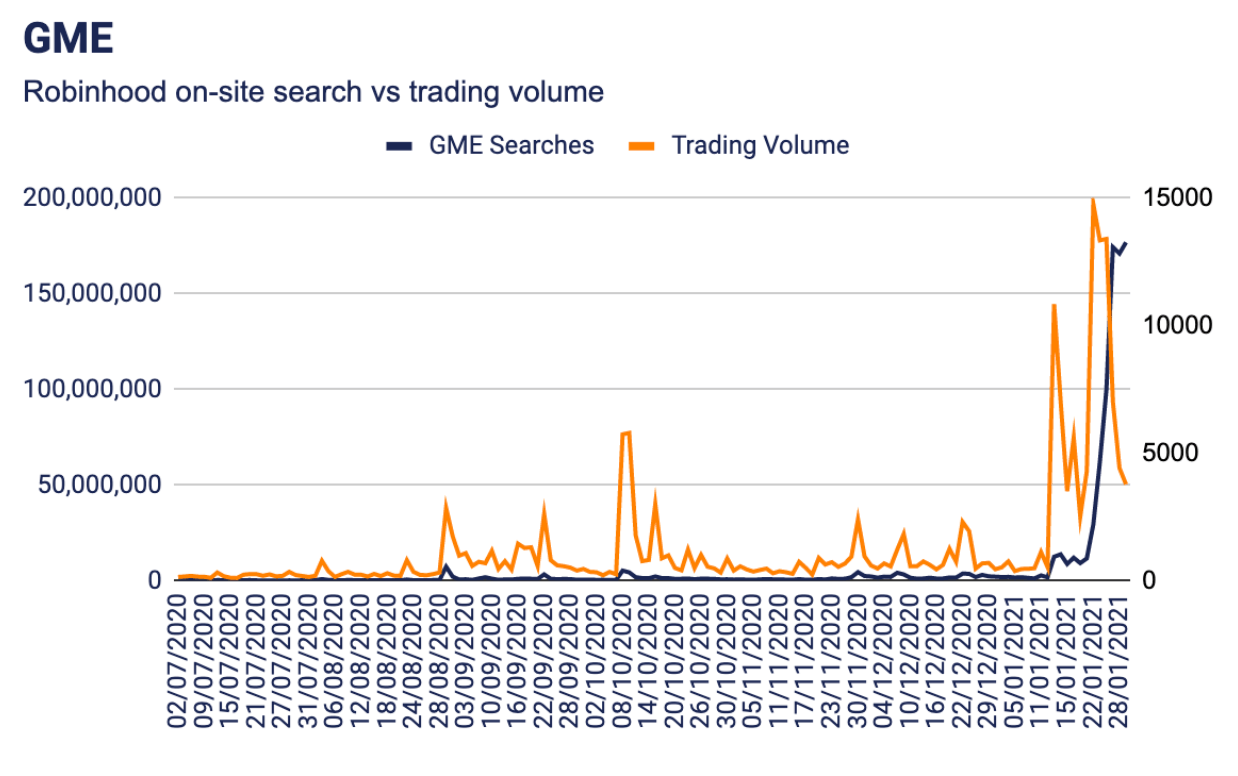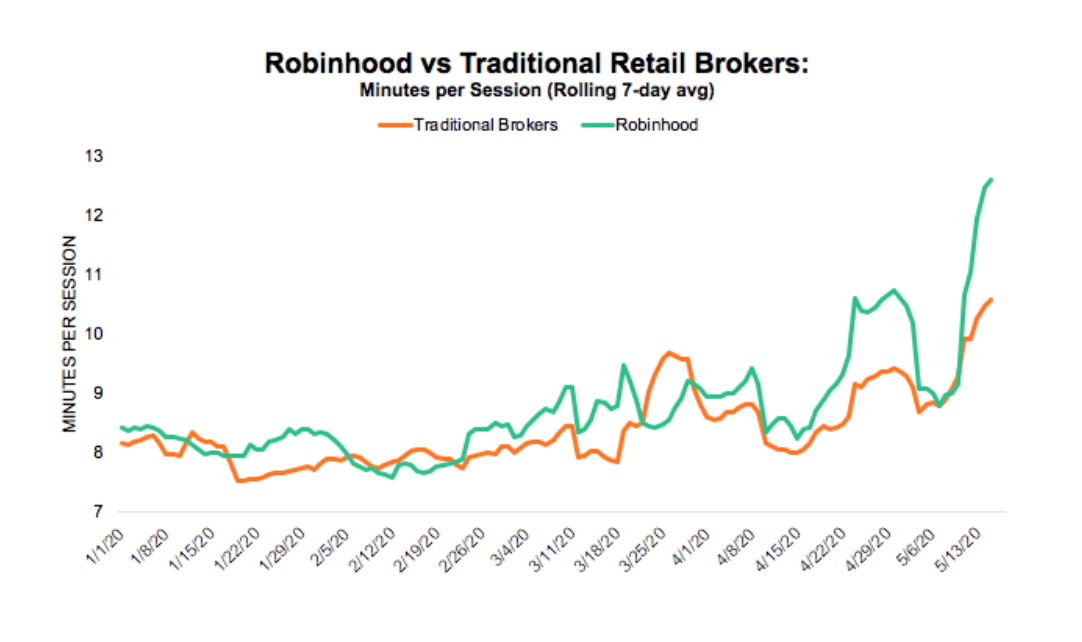
When they said all press is good press, they can use the recent Robinhood scandal as a case study. Looking at the digital traffic alone over the last 7 days, it’s clear that Robinhood is on fire.
The online brokerage – and potential unicorn IPO – is at the epicenter of the surreal GameStop (GME) trading saga. It sparked outrage after banning, and then restricting, trades in so called meme stocks like GameStop, Nokia (NOK) and BlackBerry (BB). That’s with GME still up 380% year-to-date.
“[Last] week demonstrated that unsustainable excess in one small part of the market has the potential to tip a row of dominoes and create broader turmoil,” Goldman Sachs’ David Kostin commented.
Now the U.S. Securities and Exchange Commission has agreed to review the restrictions imposed by trading platforms. Meanwhile, Robinhood has raised an eye-watering $3.4B in order to stabilize its operations.
Using SimilarWeb’s powerful alternative data, we took a deep-dive into Robinhood’s key digital data points over the last few weeks and months. We also compared these trends to those of traditional U.S. retail brokerages: Fidelity, Charles Schwab, TD Ameritrade, Etrade, and Interactive Brokers.
As you will see, the impact of recent events is startling.
Pro Tip: SimilarWeb data is updated daily with only a 48–72 hour processing lag so users can immediately identify emerging players and market trends.
Key takeaways for Robinhood:


To learn more about the data behind this article and what Similarweb has to offer, visit https://www.similarweb.com/.


Sign up to receive our stories in your inbox.
Data is changing the speed of business. Investors, Corporations, and Governments are buying new, differentiated data to gain visibility make better decisions. Don't fall behind. Let us help.


Sign up to receive our stories in your inbox.
Data is changing the speed of business. Investors, Corporations, and Governments are buying new, differentiated data to gain visibility make better decisions. Don't fall behind. Let us help.


