As 2022 wound down, we at PlaceIQ took one last look at our Reemergence Dataset: the year-over-year index we built to power our Social Distance Tracker. The Reemergence Dataset compared a panel of foot traffic against 2019, our pre-pandemic benchmark. Throughout our analysis, we’ve spotted many hidden trends. From selective returns of consumer demand to changing dining preferences. From the quirks with the return to campuses to shopping while distancing. Before we filed the Reemergence Dataset into cold storage, we had a lingering question regarding the recovery of urban and suburban areas.
In 2022, Black Friday spending increases across retail far surpassed visitation increases. When analyzing this major shopping holiday with data from PlaceIQ, we can see larger basket sizes, higher in-store conversion rates, and pent–up demand for savings drove these spikes. Black Friday 2021 was very successful compared to 2020; traffic and spend rebounded greatly. This year, we didn’t see the same leaps and bounds, but it was another successful weekend for retailers. Covid is no longer holding us back, but inflation and macroeconomic factors keep things grounded from a year-over-year perspective.
****
With a post-pandemic prime shopping period behind us, we wanted to investigate consumer spending habits, considering the context of reemergence and macroeconomic factors. With the knowledge that people pulled back on shopping through mid-August, we looked at transaction metrics for major back-to-school retailers leading up to the first day of school. Back-to-school signifies not only children returning to school but also a return to consumers’ typical routines and needs. Warehouse Clubs and Big Box stores saw the highest bump from this change – about 16% in late August.
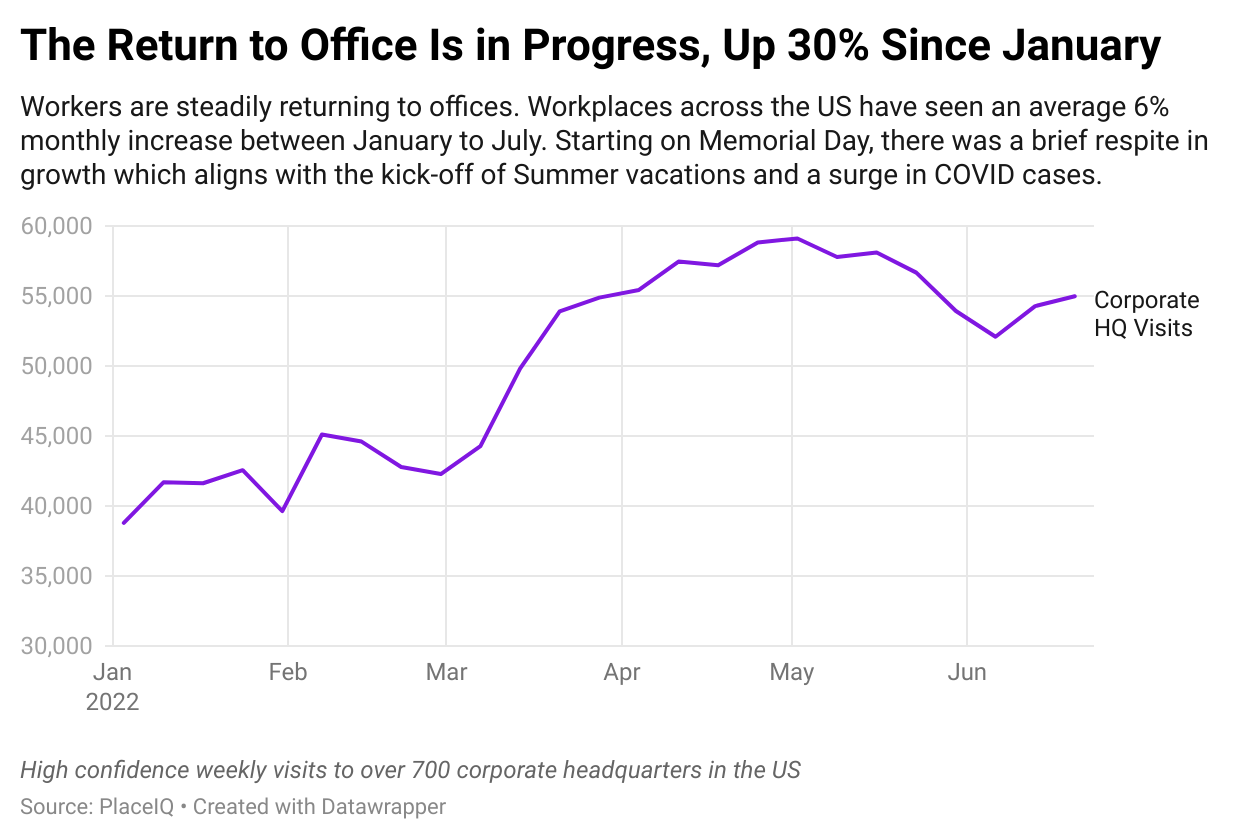
While the debate between remote, on-site, and hybrid work continues to bubble, visitation to offices is steadily tracking upwards. There’s been a lot of discussion these past few months about the return to the office, working from home, and hybrid scenarios. We’ve read arguments for one way or the other, but the facts on the ground show that a steady, stable return to the workplace is underway. Offices are seeing 30% more traffic than they saw in January, as measured by PlaceIQ’s movement data metrics.
The pandemic isn’t over, but social distancing is no longer the main driver of consumer behavioral change in our data. Higher prices, especially at the pump, are driving down spending in nearly every vertical, despite COVID-weary consumers’ desire to get out of the home. Visits are healthy and travel and entertainment venues are steady. While COVID cases still continue to rise in many places throughout the US, cases seem less severe than in prior waves.
Where we sit – in New York and the San Francisco Bay Area – cases are coming down fast. Hope is on the horizon and it looks like the pattern we watched in South Africa and the UK will play out here: Omicron will spike COVID case counts like never before before leaving as fast as it arrived. Looking at these case patterns alongside our foot traffic data, the patterns look very, very similar to the lead up to 2021’s Second Reemergence: a period of sudden foot traffic gains shared by nearly all categories.
As we come to the end of another year of social distancing, we’re using today’s tracker to share some insights on Black Friday, how the holiday season is faring so far, and what malls can tell us about larger trends and shopper hesitancy. We’re also sharing our recommendations for marketers on how to respond to ongoing shifts and sentiment due to omicron. Comparing the changes social distancing brought to holiday shopping in 2020 vs 2021, one thing is clear: Black Friday had brands rebounding in a big way. Let’s take a look below.
We hope you all had a wonderful Thanksgiving, at home or visiting loved ones. Last week, holiday travel surged back to levels just shy of our 2019 pre-COVID benchmark. Compared to 2020 people were more likely to travel, traveled significantly further, and returned to airports en masse. Today, we’ll break down the pilgrimage for you all. But first, let’s touch on the big topic of the hour: the potential of the Omicron variant. There’s still so much we don’t know, but there’s some scenario planning we think is valuable for marketers as we stare down the idea of a new COVID wave.
Foot traffic has been relatively up and stable since the decline of our initial Delta case wave and the conclusion of the back-to-school season. From October onward, things are pretty flat. Grocery is the category we want to discuss today -- that yellow line in the middle of the pack. It nicely encapsulates the complex mix of behaviors in the market right now, as some people return to their old behaviors, others stick with their new ones, and the remainder find a happy middleground.This dynamic -- the presence of old normals, new normals, and hybrid normals _all at once_ -- is showing up in every category we track. Understanding and serving this dynamic is key to winning this holiday season and beyond.
Last week felt like a big one in California. Vaccination rates are up, cases have slowed to a trickle, and the state has now fully reopened. Across the US, our initial spike of foot traffic enthusiasm has subdued a bit. All the things we didn’t expect to pop — like grocery, big box, and dollar stores — have subsided to their usual levels. But the Vacillating category — the hotels, casual restaurants, entertainment venues, and bars — hasn’t given up its gains. And in some cases, traffic is still trending upward.
The pandemic raised new questions, new challenges, brought new opportunities, and accelerated the need for data-driven decisions across many industries. We recently teamed up with our partners at PwC to share our approach for enhancing existing demand models using multiple datasets and to show an example of how they’re built in the PwC ecosystem. We discussed from our respective points of view how demand changed, and how it can affect your planning.
The second Reemergence we saw last issue has tempered a bit. A confluence of events — rising vaccine deployment, dropping case numbers, improving weather, federal stimulus, and more — drove people out of their homes seemingly all at once. Even businesses that were already doing well, like fast food restaurants, enjoyed a spike in traffic starting February 20th.
Today we’re going to look at our Second Reemergence. Foot traffic has dramatically increased over the last few weeks as quarantine fatigue, vaccinations, declining case counts, weather, and more encouraged us to leave our homes en masse. We’re not back to normal. Like our first reemergence last Spring, traffic is distributed differently and highly regional. But even still: we haven’t seen activity like this in quite some time.
We’re in the middle of a significant COVID surge, with a 54% growth in the new case rate over the last 14 days. Nearly every state is trending the wrong way and hospitalizations are up dramatically. In response, many states have issued new restrictions and guidance. So, how have consumers adjusted?
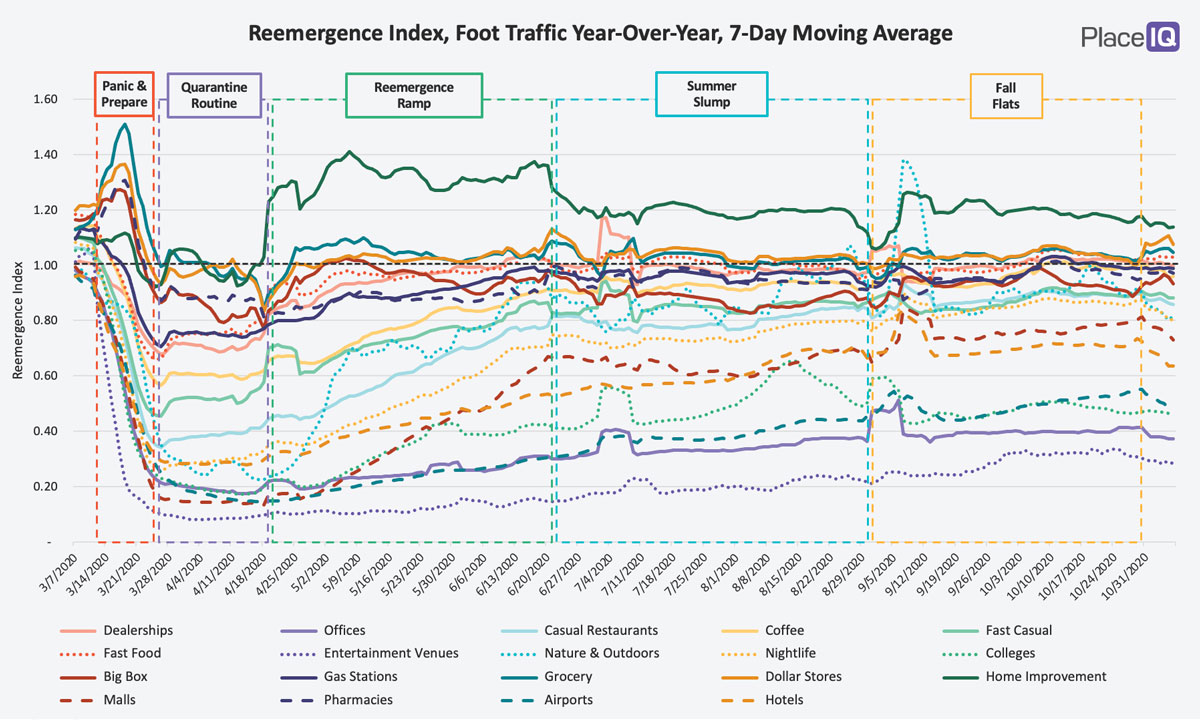
In our last issue, we named the Fall Flats, the latest phase we’ve measured in traffic reemergence. We had been hesitating to pick a name for this time period because, well, nothing was happening. Traffic had reached an equilibrium. The Summer Slump seamlessly transitioned to unchanging foot traffic in September and October.
According to the data, reemergence marches on, slowly and subtly. We’re now in a phase where national changes to foot traffic are small to nonexistent for most categories. We quantify visitation trends by comparing a 7-day average volume of foot traffic to the 7 days prior. This metric removes blips and lets us measure how much foot traffic is increasing or decreasing over the past week.
We are now into Fall, but the phase after the Summer Slump defies definition. It is a slowww crawl upwards for most categories – barely above a flatline.
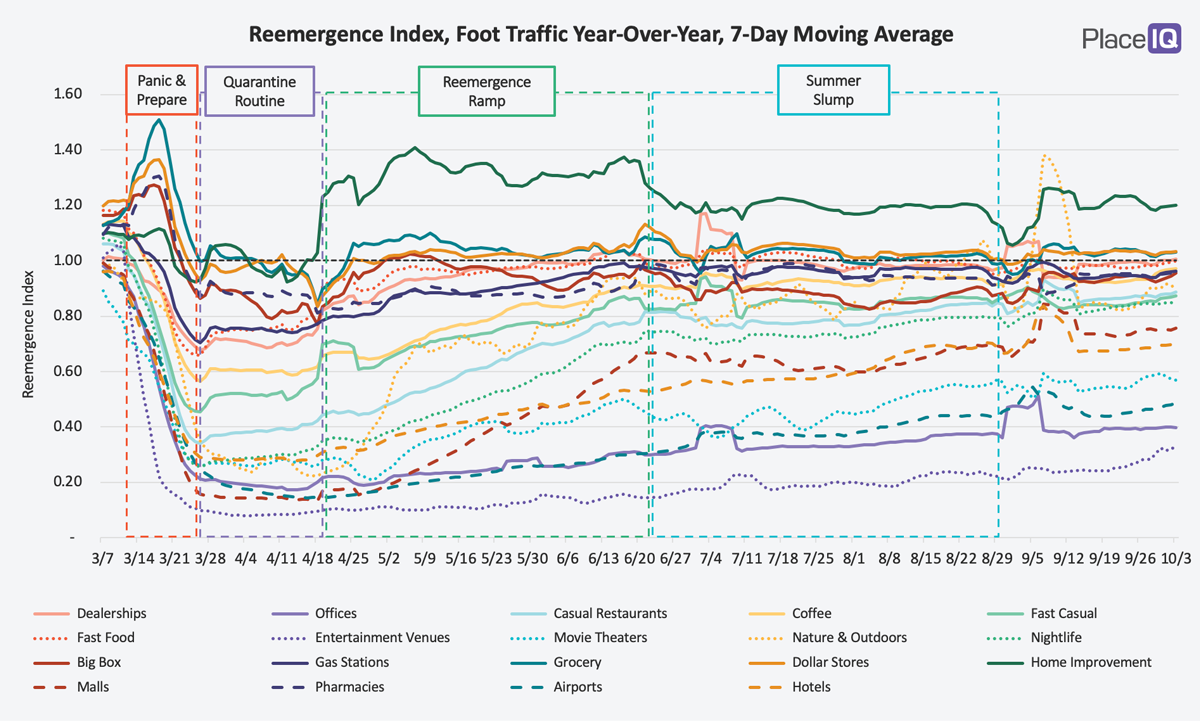
With this week, Summer is officially over. And so too our Summer Slump comes to an end, with traffic ever-so-slightly up from its August levels. Now, there’s something to note about that Labor Day spike: it’s not what it seems. Our Reemergence Index works by comparing weekday traffic year-over-year. We compare the 14th Friday in 2020 to the 14th Friday in 2019.
Coronavirus metrics across most of the US continue to head in the right direction. We’re starting to see some upticks in traffic; most categories are slightly up. Though, not quite dramatically enough to coin a new phrase to follow the Summer Slump. Let’s see what happens next week. Interestingly, we’re seeing a jump in the tourism segment. Visits to airports, hotels, and outdoor areas are up significantly vs. a year prior.
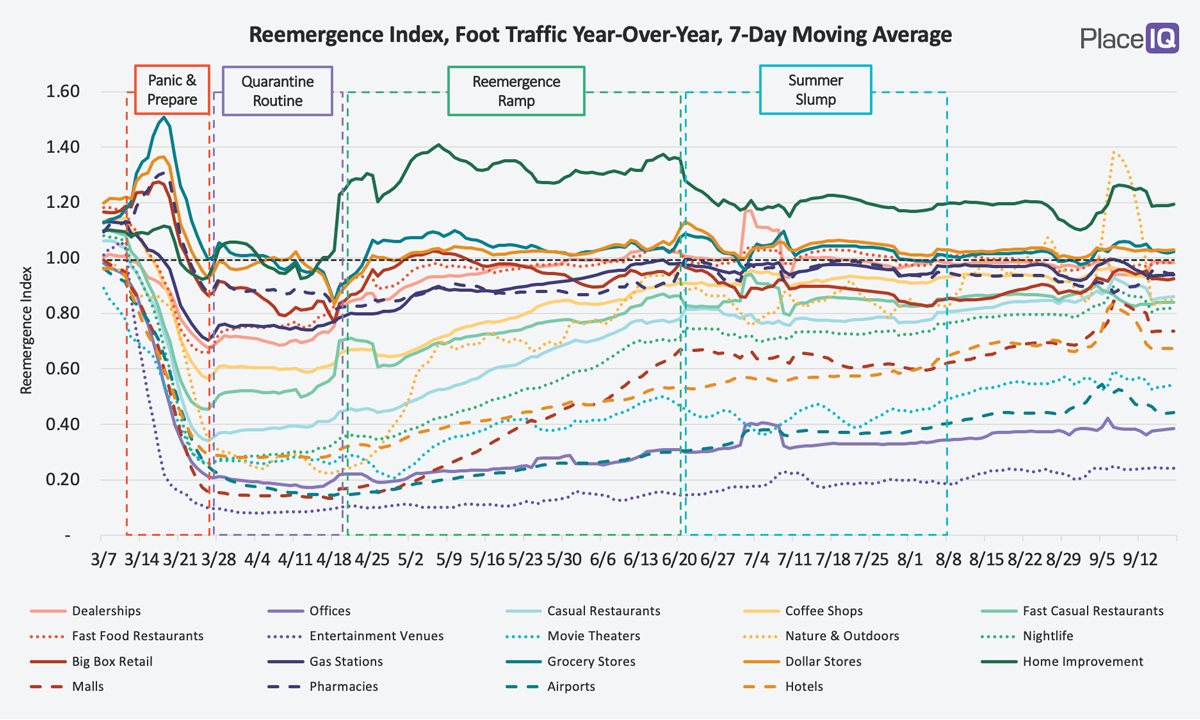
It appears as though the Summer Slump continues on. In one more week, it will match the duration of the Reemergence Ramp. Traffic is mostly flat, aside from traffic to Nature & Outdoor venues (which has been cycling a bit with recent weather patterns) – and some signs of life among the lower trafficked categories, like hotels and movie theaters.


