Cross-border commercial property investment by Chinese firms has been on the wane since China’s government implemented curbs on capital outflows in 2017, and there’s no indication that these capital controls are going to be lifted any time soon. The charts below show just how significant the impact on overseas investment has been. Between 2015 and 2017, mainland Chinese investors deployed just over $91 billion into income-producing commercial real estate globally.
Office investment across Europe has plummeted since the onset of the Covid-19 pandemic. Transaction volume fell by almost one-half in the year through March compared with the prior 12 months, and the number of traded assets fell to the lowest level since 2011. Moreover, the continent’s biggest institutions are pivoting away from the office as they embrace residential and industrial. In Europe during 2020, institutional players deployed 40% of their capital on offices – the lowest ever proportion for a calendar year.
The headline rate of U.S. property price growth accelerated in April as the industrial, apartment, retail and office indices all posted positive annual returns for the first time since the pandemic began, the latest _RCA CPPI: US_ summary report shows. The U.S. National All-Property Index grew 8.4% in April over the last year. The laggard in April was the CBD office index.
The increase in U.S. commercial real estate investment in April might suggest that the market is through the worst effects of the Covid-19 pandemic. Still, while there were high double-digit annual growth rates in commercial property sales for the month, all the problems from the pandemic are not yet in the rearview mirror. The good news is that deal activity is climbing. Commercial property sales were up 66% from a year earlier in April.
Relative to other European markets, the Danish market has boomed through the pandemic. Transaction volume increased 44% year-over-year in the 12 months through Q1 2021, and at a shade under €8.4 billion ($10.2 billion) eclipsed the market’s annual record high for transactions of 2017. Moreover, first quarter deals topped €3.5 billion, which makes the start of 2021 one of the best three-month periods for the market on record, catapulting the market to become the fourth most active in Europe at the start of the year.
Global office transaction volumes plummeted in the 12 months through March. Real Capital Analytics data shows that office investment dropped 49% in the Americas, 44% in Europe, the Middle East and Africa (EMEA) and by a more moderate 14% in the Asia Pacific region. A slowdown in transactions across all asset classes was inevitable following the lockdown restrictions employed to slow the spread of Covid-19.
There are signs of recovery underway for a majority of commercial real estate markets in the Asia Pacific region. In the chart below, we plot deal activity for Asia Pacific’s top eight real estate markets in the first quarters of 2021 and 2020, expressed as a percentage of the average of the previous five years.
Investor interest in the industrial sector has leapt with the shift in consumer activity to online shopping, a situation that has helped the RCA CPPI for U.S. industrial properties outperform all other sectors. Industrial property prices are now at record high levels and investors note difficulty in sourcing deals. In response, will the market react with too much supply?
Dallas is booming. The market cemented its position as the #1 U.S. market for commercial real estate construction during the Covid-19 era despite the challenges of the pandemic.
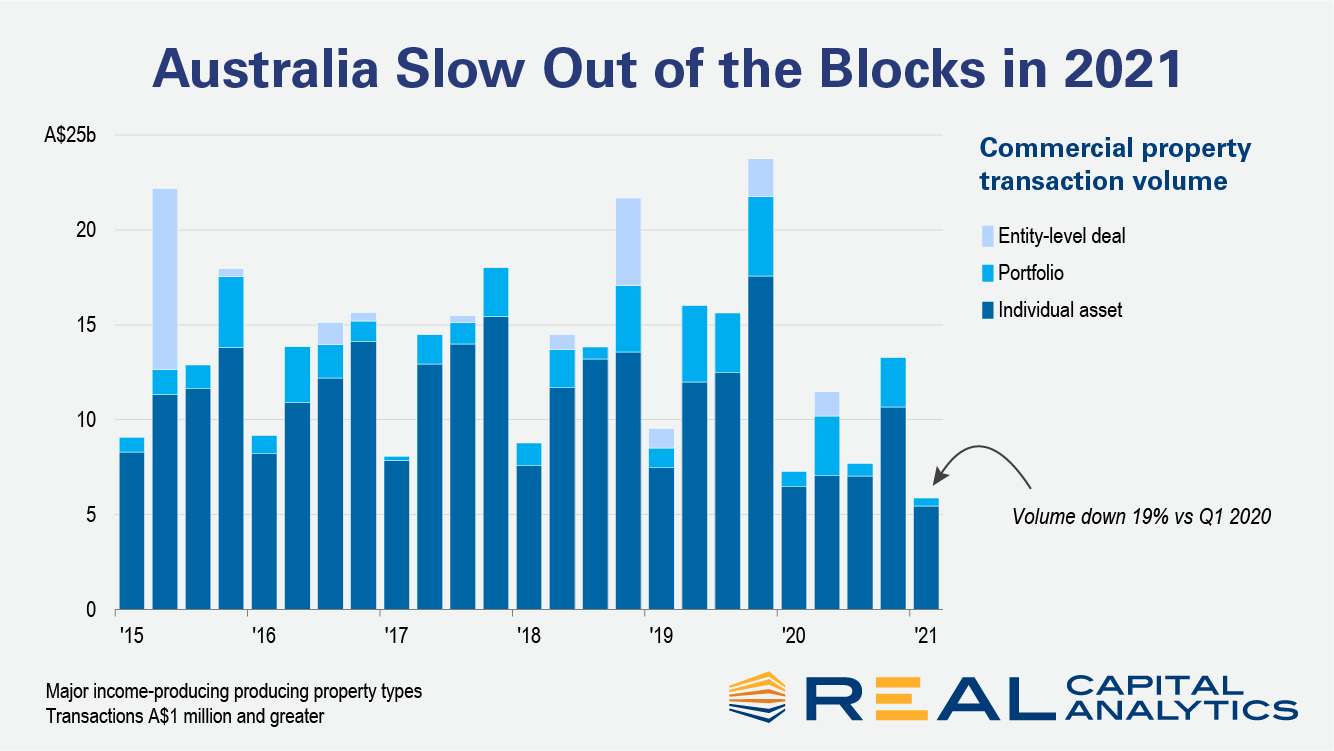
Commercial real estate activity in Australia started 2021 on a weak note, as the pandemic continued to weigh heavy on investor minds, the new edition of Australia Capital Trends shows. Deal volume in the first quarter fell 19% from a year prior.
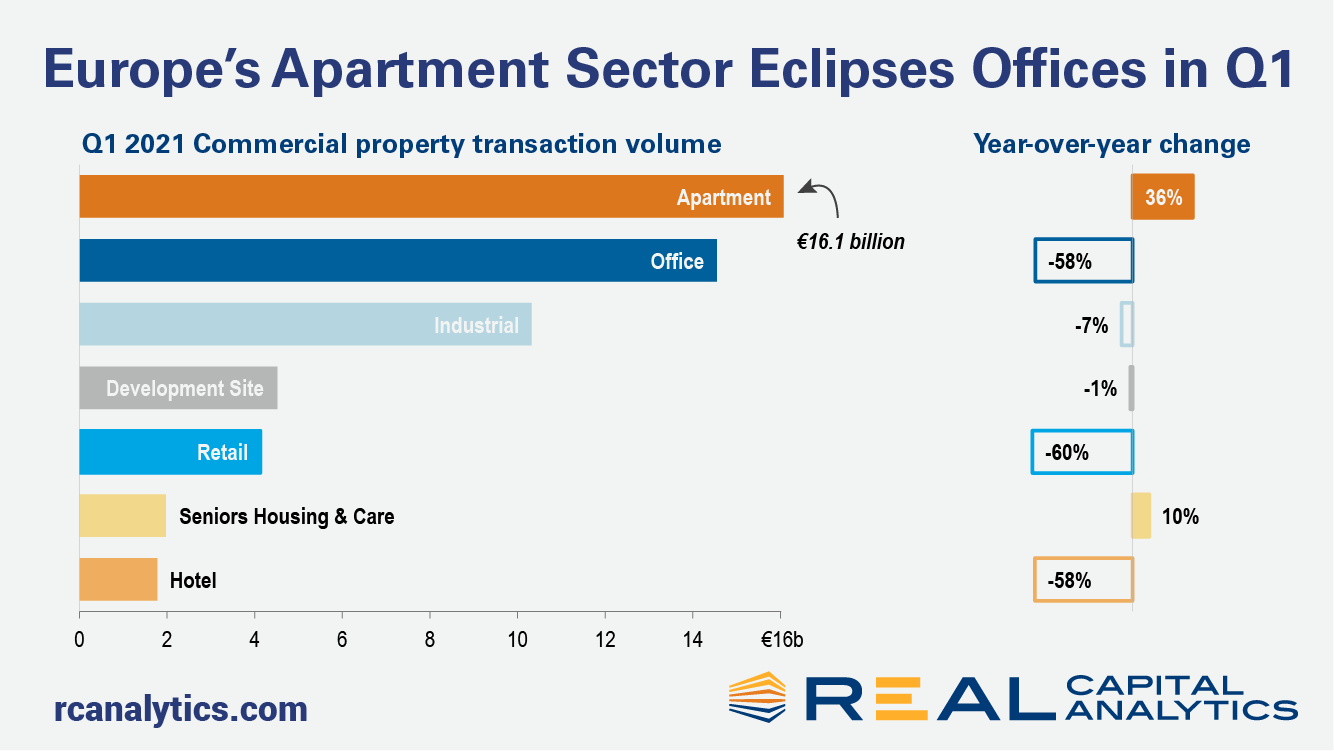
European commercial property sales sales slowed again at the start of 2021, the fourth consecutive quarter that Covid challenges have restrained the region’s largest markets, the latest edition of Europe Capital Trends shows. However, the picture for the sectors was not uniform as investors continued to plow capital into the apartment sector, which surpassed offices in quarterly deal volume. Investment volume across all property types dropped 32% in the first quarter compared to a year ago. The apartment sector bucked the trend, with activity increasing 36% year-over-year. The industrial sector slipped just 7% while acquisitions of office and retail properties tumbled by more than 50%.
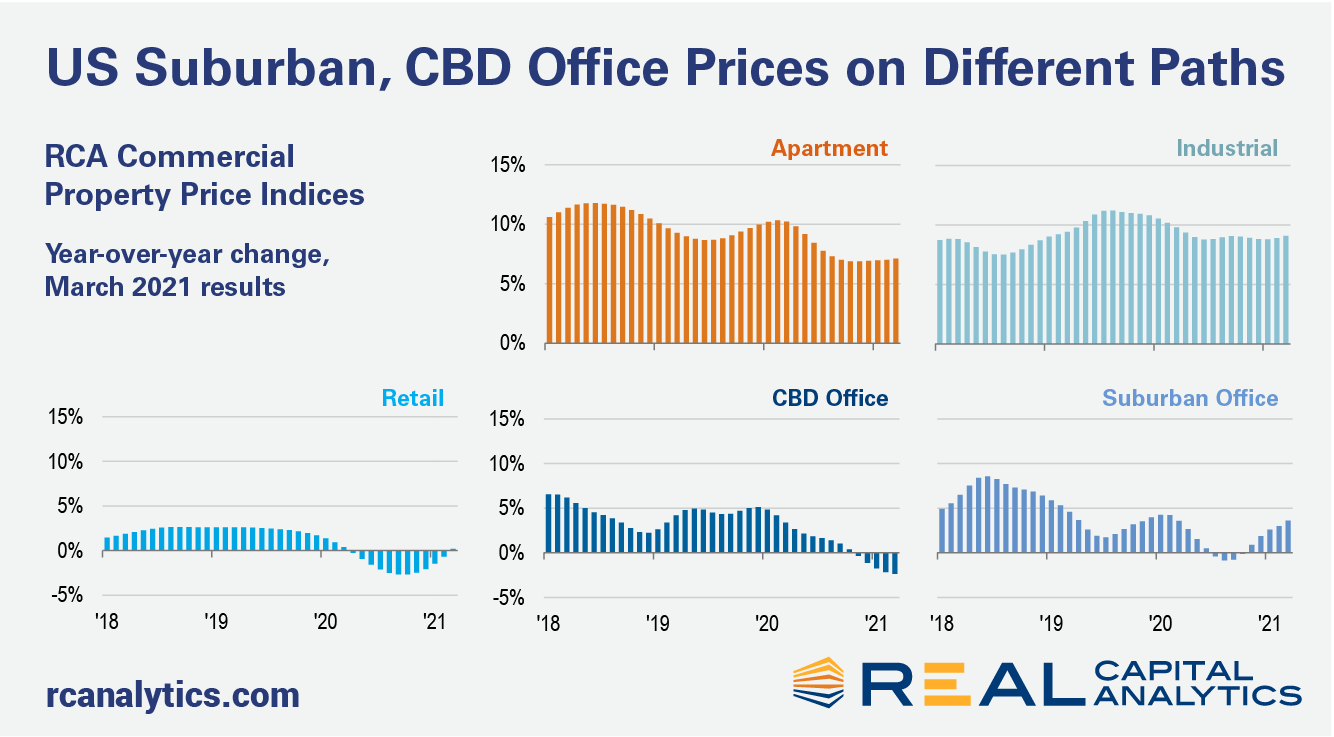
The headline annual rate of U.S. commercial property price growth posted a stronger gain in March, aided by industrial, apartment, and suburban office price increases, the latest RCA CPPI: US summary report shows. The office sector subtypes continued to move in opposite directions in March. The CBD index declined 2.4% year-over-year, while suburban office accelerated to a 3.6% annual pace of growth. The differing paces reflect the recent outperformance in suburban deal activity, as shown in the new edition of US Capital Trends, also released this week.
U.S. commercial real estate activity rose in March compared to a year ago, with deal volume increases seen for most of the major property sectors, the latest edition of US Capital Trends shows. For the first quarter in total, deal activity dropped by nearly 30% compared to Q1 2020. March deal volume increased 11% versus March 2020 when the Covid crisis first erupted and cracks started to show in U.S. deal activity.
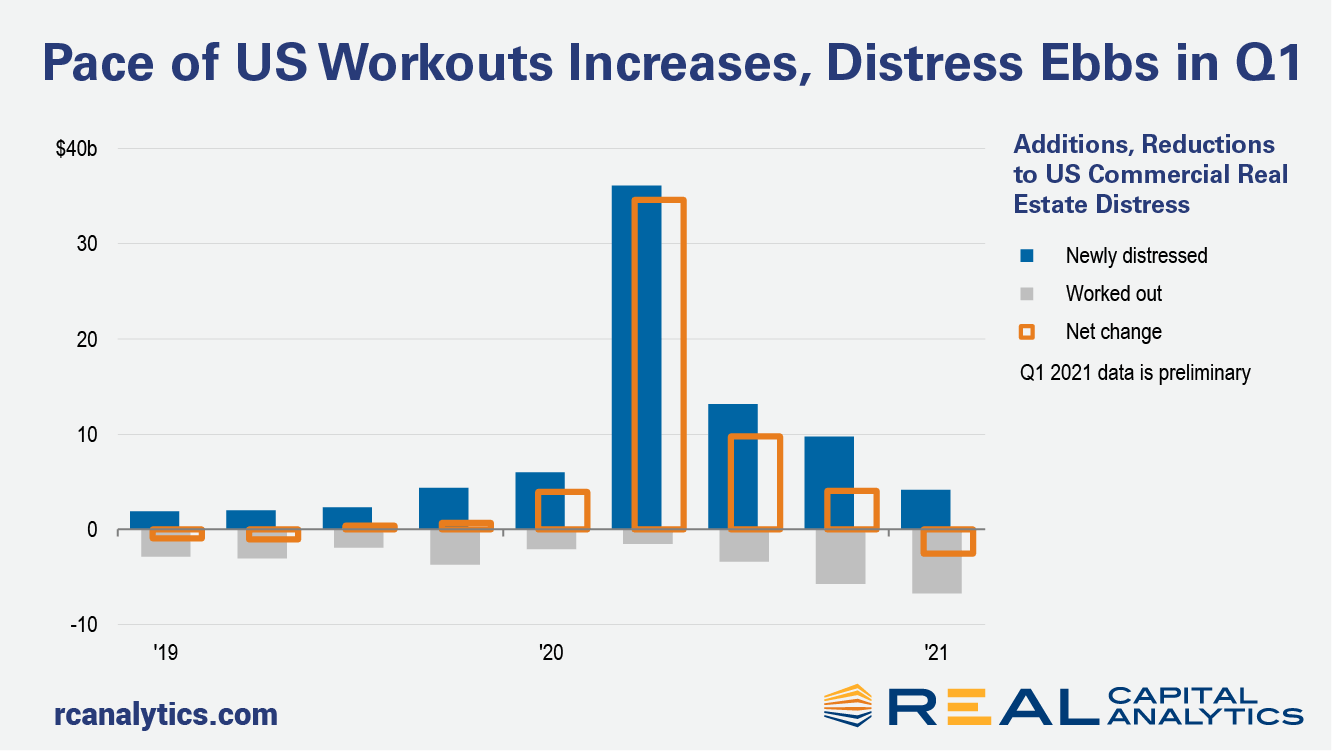
More U.S. commercial real estate distress was worked out than arose in the first quarter of 2021, preliminary Real Capital Analytics data shows. All other things being equal, this change in behavior would be an important sign of a transition in the marketplace. We are not finished with all aspects of distress, however. There is a looming supply of potentially distressed loans that still may have an impact. The pace of workouts will play an important role in the process of price discovery for commercial properties. Deal volume has contracted sharply over the last year as owners and potential buyers disagree on how assets should be priced. To the extent that there are more loan workouts, information from these negotiations will adjust buyer and seller expectations on prices that can be achieved.
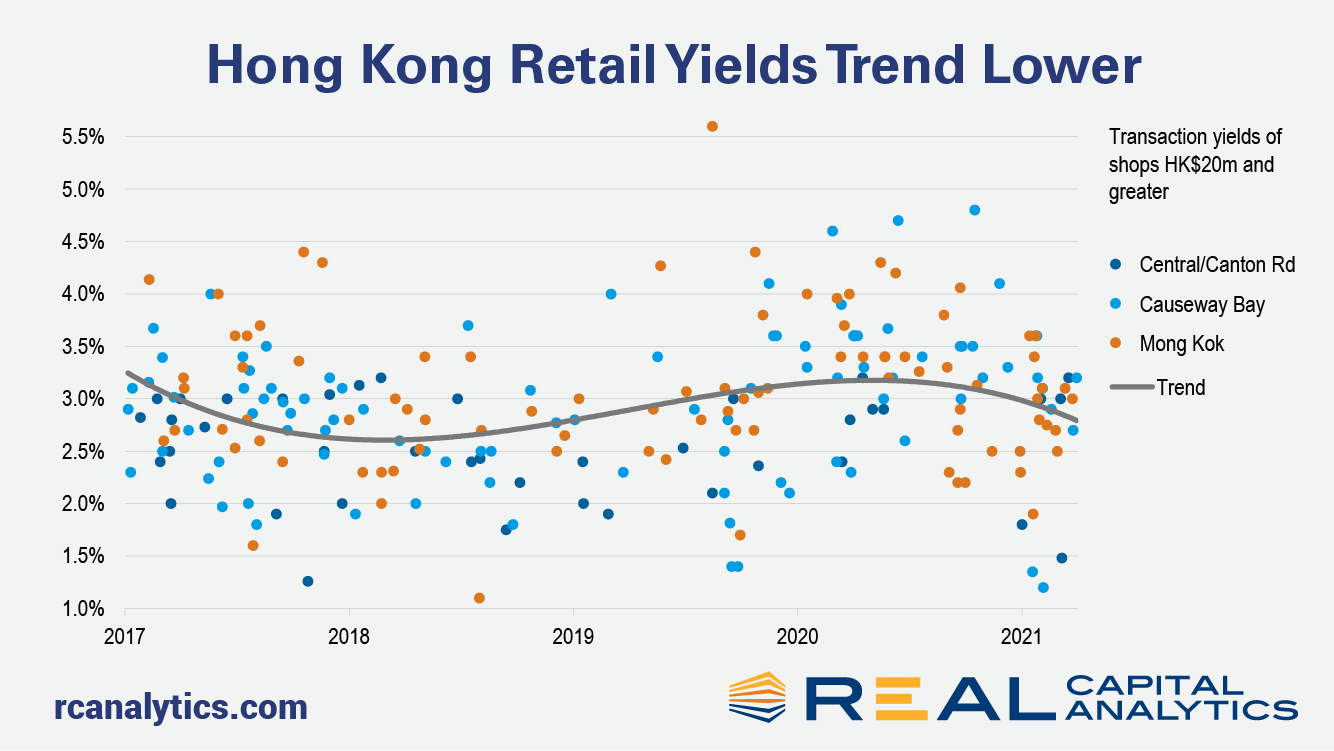
Landlords of shops in Hong Kong have had a rough ride over the past two years. The political unrest in the middle of 2019 had already exacted a heavy toll on retailers, with businesses disrupted by the clashes and overseas visitors unnerved. (This author too put his own family’s vacation plans on ice.) Then tourist numbers all but evaporated with the onset of Covid-19 less than a year later. Resultantly, prices of CBD shops plummeted, as average quarterly yields headed upwards by 100 basis points between the middle of 2018 and the second quarter of 2020. (This analysis is based on retail assets trading at a value of HK$20 million — $2.5 million — and greater.) Throughout the whole of 2020, no shop assets traded at a sub-2% yield, according to Real Capital Analytics records. The last time the yield floor for such assets was this high was in 2008.
Distress has been the watchword for capital raising in recent months as investors eye assets under pressure because of Covid-19 challenges. As yet though, troubled assets have not translated through to a spike in distressed asset sales. As shown in the chart, so far only the hotel sector has seen a notable surge in distressed sales as a percentage of the sector volume. Between March of 2020 and February of 2021, 8% of hotel sales involved a distressed asset. However, the total level of hotel transaction activity was scant during that time frame: only $10.6 billion of hotels traded, as compared to $36.6 billion in the prior 12-month period.
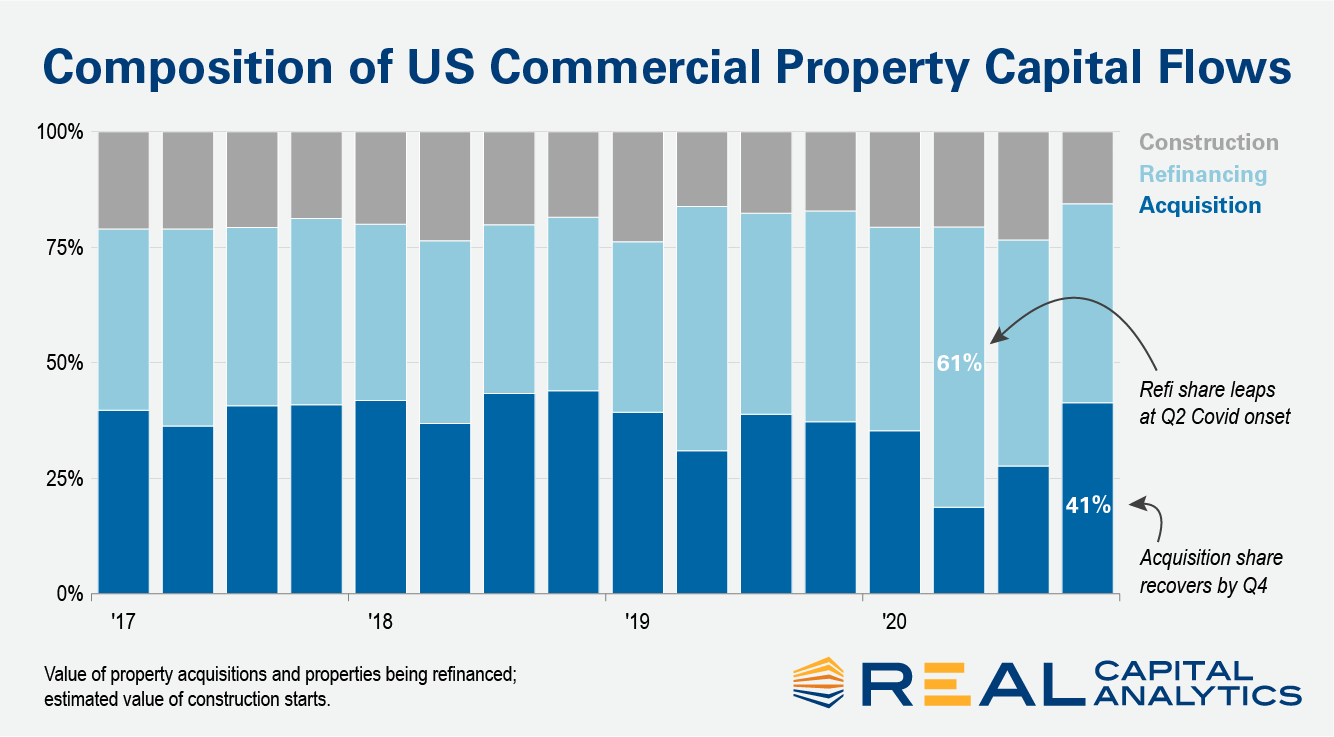
Deal volume contracted in 2020 due to economic uncertainty but did not result in a price collapse like that seen during the Global Financial Crisis (GFC). Capital flowing into other structures helped support pricing during this downturn. Into the second quarter as new acquisitions fell, financing activity picked up some of the slack in the capital stack. The value of properties refinanced represented 61% of all capital flows to commercial real estate in the quarter. This figure was well above the 19% share represented by new acquisitions.
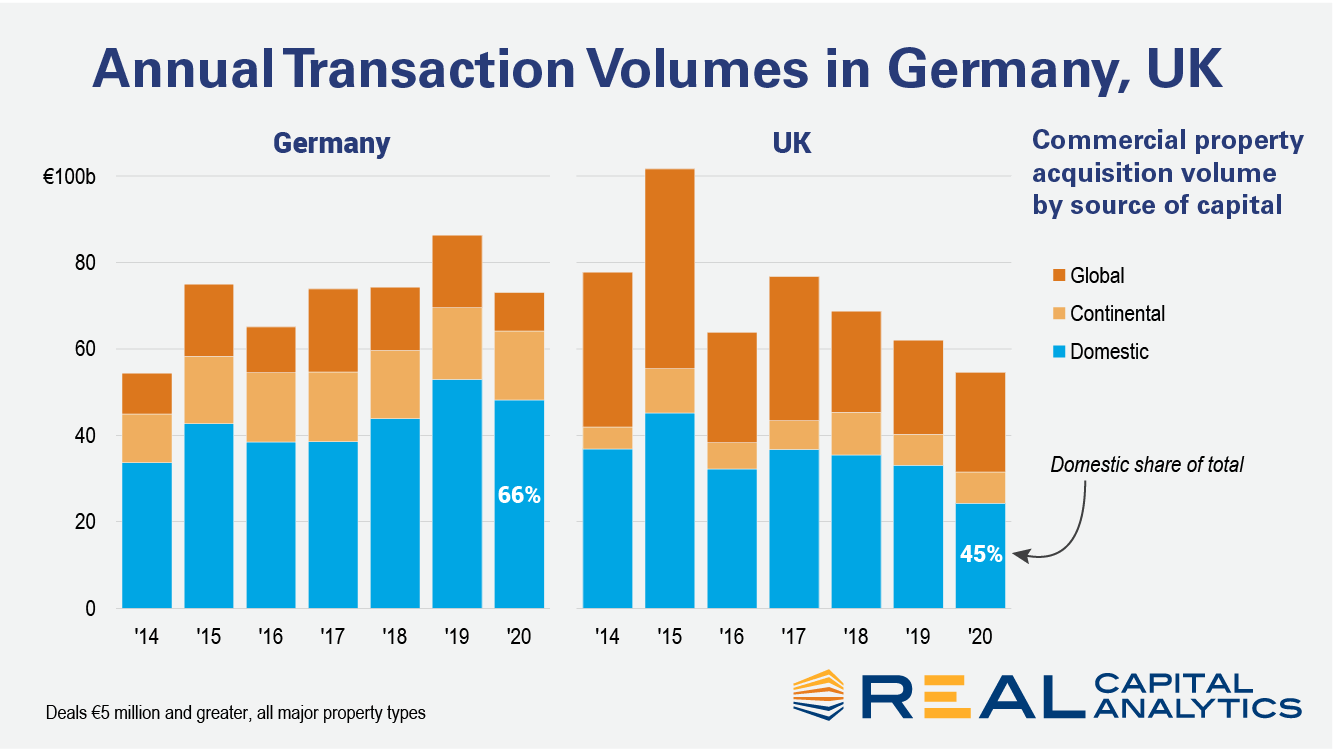
Since the end of 2015 Germany has attracted more investment capital than any other European commercial property market. Real Capital Analytics has recorded transactions totaling €372 billion ($438 billion) in the last five years, €47 billion more than in the U.K., the second most active market. One of the explanations offered for this rise to prominence is the U.K.’s June 2016 decision to leave the European Union, subsequent to which, Germany has been labelled as Europe’s new safe haven and a home for capital that might previously have gone elsewhere.
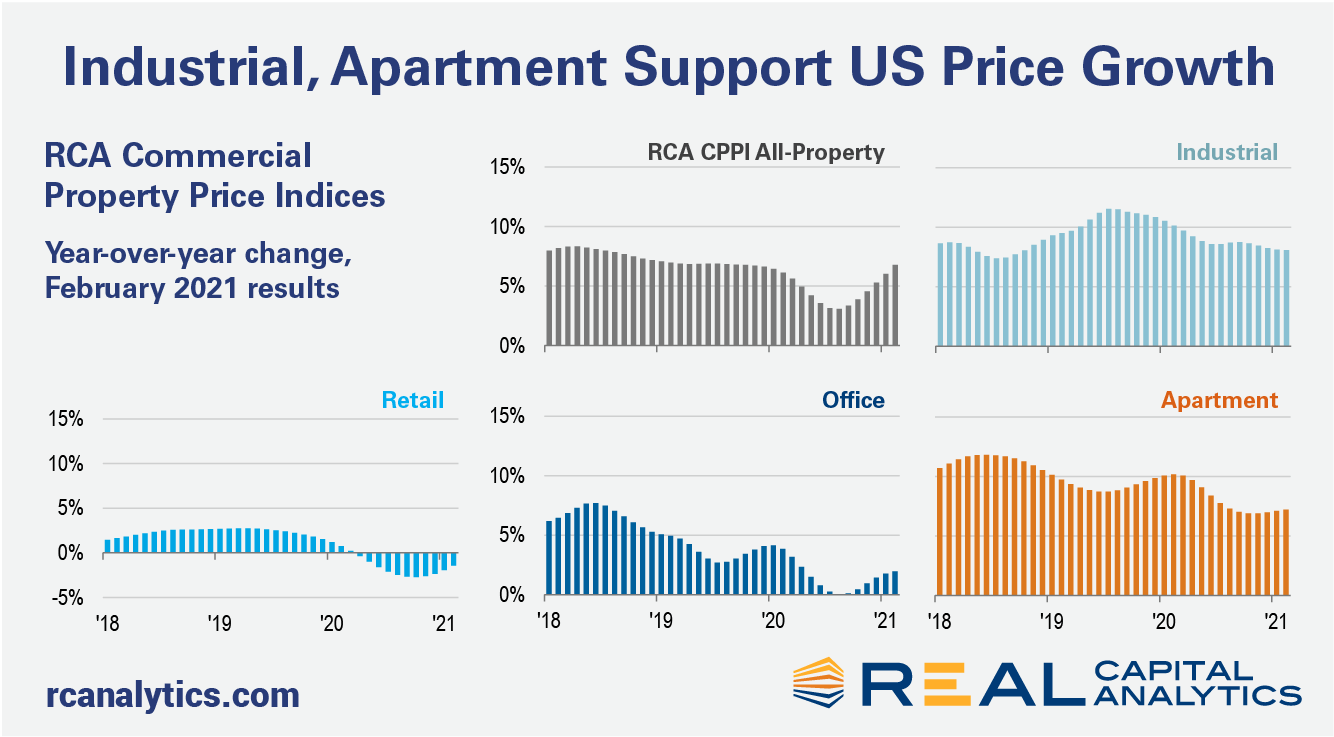
The annual pace of U.S. commercial property price growth reached 6.8% in February, a rate comparable to the months preceding the country’s initial coronavirus lockdowns, the latest RCA CPPI: US summary report shows. The US National All-Property Index rose 0.9% in February from January. The office index increased 2.0% year-over-year in February. Prices in the office market have slowly crept back from the middle of last year when the index was flat, but are still only increasing at half the rate seen a year ago. Suburban office prices kept the office index afloat last month, gaining 2.2% year-over-year.
One year into the pandemic and clearly the current market downturn is not like the last one just over a decade ago. Commercial property prices have not been the adjustment mechanism for the disruptions from the pandemic — deal volume has suffered instead. A functioning debt market with far higher levels of liquidity than in the last crisis is a big part of the difference between these recessions. Liquidity is not just a story about volume. To measure trends in liquidity in the equity portion of the capital stack, Real Capital Analytics publishes a composite scoring system looking at numerous indicators that can influence a market.


