After the lockdown last spring that forced manufacturers from all sectors to halt production, auto makers now have to face another challenge: the global chip shortage due to the high demand on consumer electronics (laptops, gaming consoles, TVs etc.). The increased need for the technology devices along with the initial lockdowns and employee furloughs overwhelmed chipmakers and now are struggling to keep up with the surge in orders.
GameStop Corp (NYSE: GME) has been the focus of the investment community for the last couple days and for a justifiable reason. A lot has been written about the technicals of the trade and the various market participants, how they affect the supply and demand and drive the stock price. But we have decided to spin it a different way and look at the fundamentals of the issuer.
Foot traffic analysis for hotels around the US showed vastly different trends over the holiday season. Compared to the first week of November, hotels in Florida saw a foot traffic uptick of 20% in the week of December 22 - 28, and up 40% in the week between Christmas and New Year, as Americans flocked to warmer climates.
What a year it’s been! Few people will be sad to see it go and certainly here at Advan we are excited for what 2021 may bring. To cap off the year, we’ve listed below what we think are 5 of the most interesting mobility trends in a year full of unexpected twists and turns. We look forward to more next year!
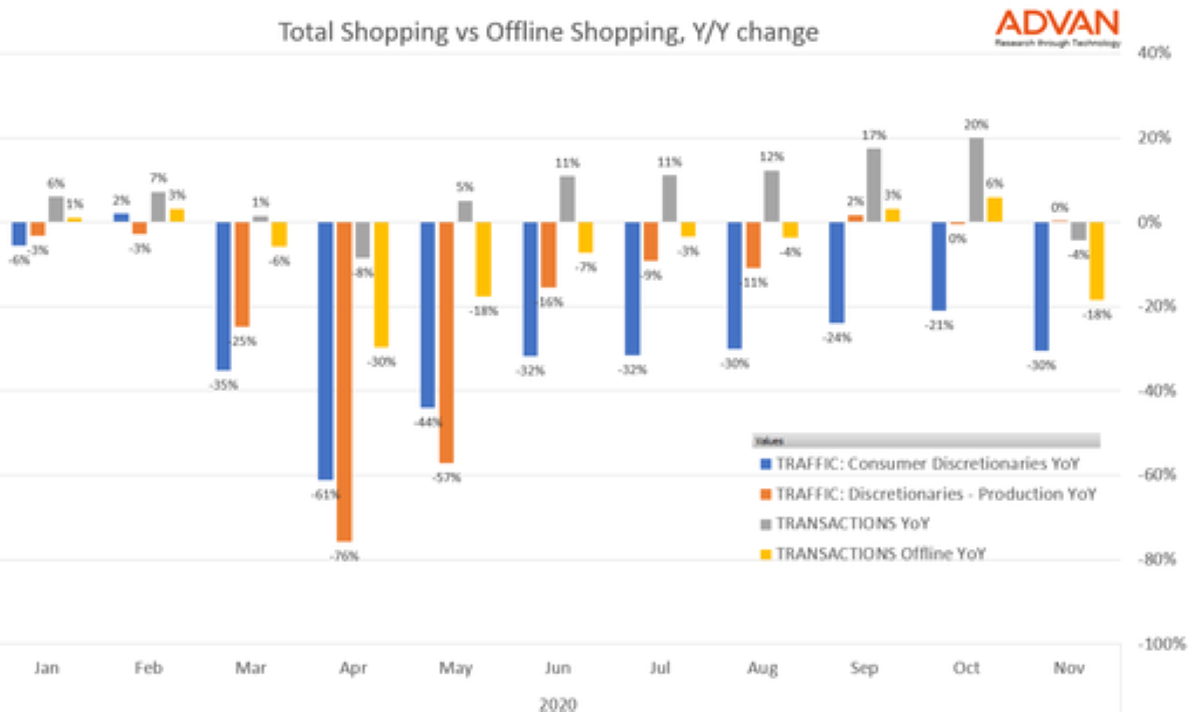
There is no question that a segment of retail has moved online this year. Offline (i.e.in-store) credit and debit card spending is down 15% year-over-year versus total spend according to transaction data from ConsumerEdge. Foot traffic at consumer discretionary store locations is also 20% lower year-over-year than foot traffic to production locations for consumer discretionary retailers.
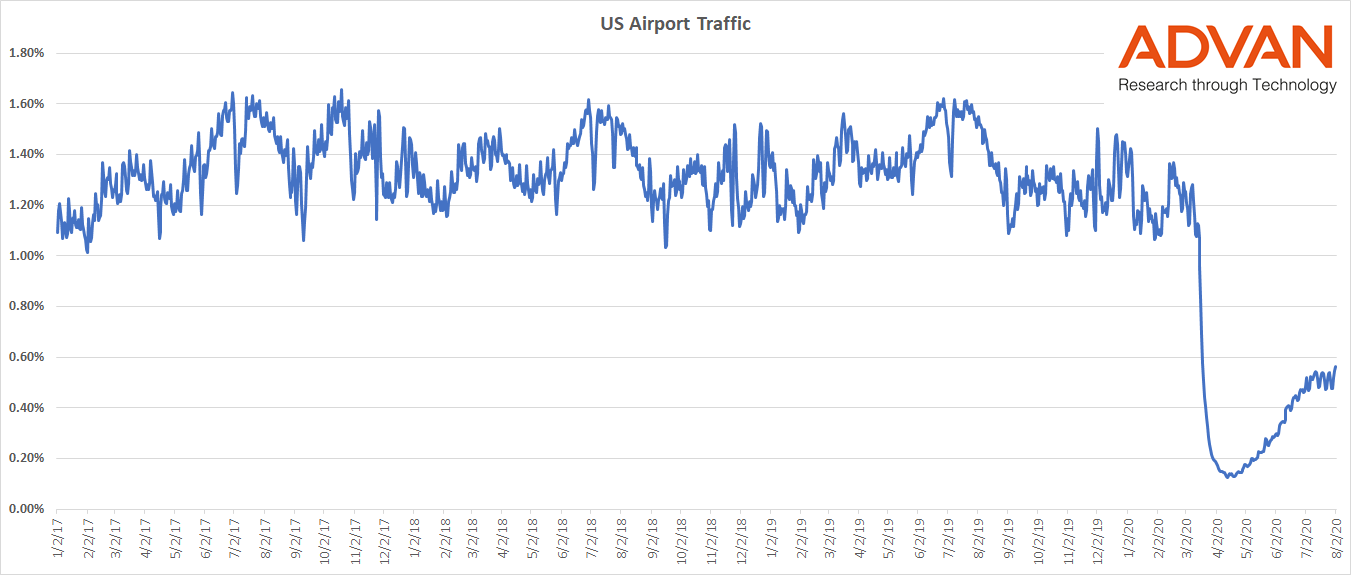
Advan analysis of footfall at US airports shows a gradual upward trend in traveller numbers, although volumes still remain significantly depressed compared to March. Comparison with TSA screened passengers shows a very high correlation over time, of over 99%.
After months of travel restrictions and lockdown, there is some hope on the horizon for hotel chains such Hilton. Foot traffic is a very accurate measure of performance for hotels, as well as for cash-heavy businesses such as casinos.
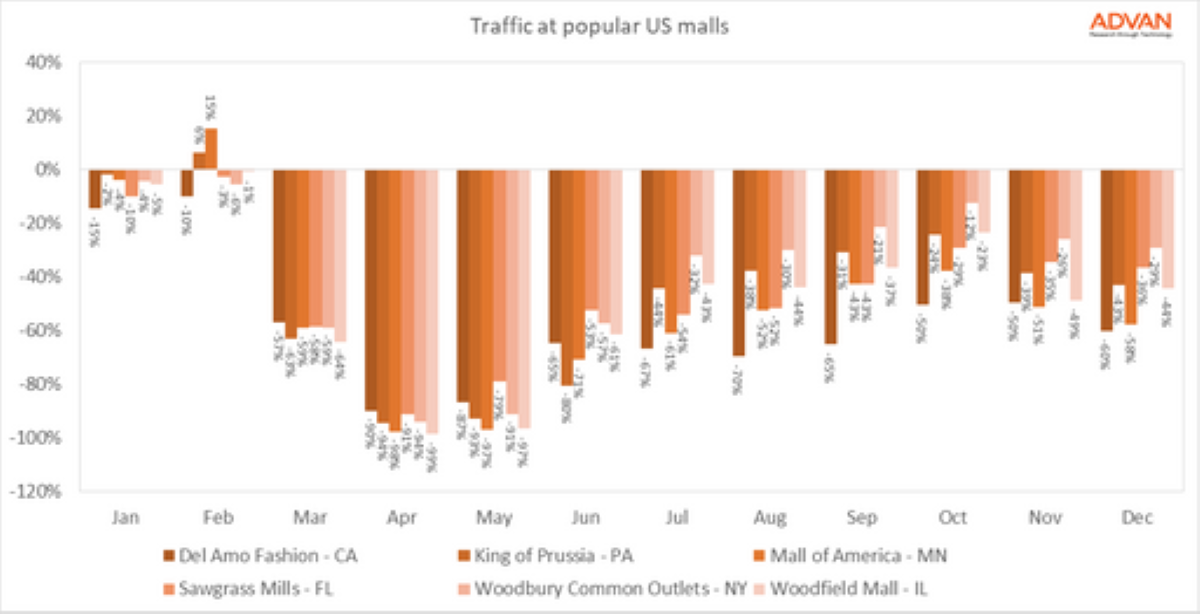
Malls around the US suffered a significant blow during what is usually the busiest shopping weekend of the year. Foot traffic was down 41% year-over-year on Black Friday and 45% on Saturday. As we reported last week, there was a pick-up in traffic during the first three weeks of November as many people opted to take care of their shopping sooner, in order to beat the rush and in anticipation of lock-down orders across the country.
With a new phase of lockdowns beginning across the US, many shoppers have opted to get a jump on Black Friday over the past week. Foot traffic to malls increased steadily across most states other than Texas where case numbers have climbed significantly, although lockdown measures have not yet been imposed. Mall visits in Texas have remained more or less flat since the start of the month.
With the UK now in its second week of nationwide lock-down we are starting to see some familiar patterns of behavior based on analysis of foot traffic data. But there are also some significant differences compared to the first wave. We looked at 5 indices for key sectors. All of our comparisons are against the average footfall in January 2020, as a pre-COVID benchmark.
Among the many social and cultural changes that the pandemic has brought about, arguably the most impactful will be the ways in which it has influenced our decisions about where to live. Not just temporary relocations while we ride out lock-downs and WFH, but permanent migration that will alter how we live and how we spend.
After a dismal April and May, when casinos across the country were closed to visitors, Nevada’s casinos have been slowly recovering. But although many casinos on the strip are now open, foot traffic remains depressed - down 45% year over year in October to date. Around the country, the pace of recovery for the sector has varied significantly by state.
In our recent webinar, we spent some time looking into foot traffic trends at airports in America and Europe. Location data is a very reliable proxy for airline passengers, since there are few reasons to be at an airport other than to board a plane. Precise mapping can filter out people who have come to collect or drop off passengers from those who have passed security in order to catch a flight.
In a previous blog post we talked about how the home improvement sector has been one of the bright spots in the pandemic. Year-over-year foot traffic to building material retailers was up 26% in September.Given this trend, we wanted to look in more detail at one of the most popular companies in the home improvement sector - Ikea.
There’s no question that the retail sector has been hit hard this year. Foot traffic at Macy’s, which was already struggling prior to the pandemic, was down 64% last quarter compared to the same quarter in 2019. Like many of its peers, Macy’s has relied on its online business to bolster revenues during a period when many of its stores were closed.
Are you back in the office? It’s a question many of us find ourselves asking our friends and peers. The answer is, it depends. Each has their own comfort level, and it also depends largely on their role and their employer.
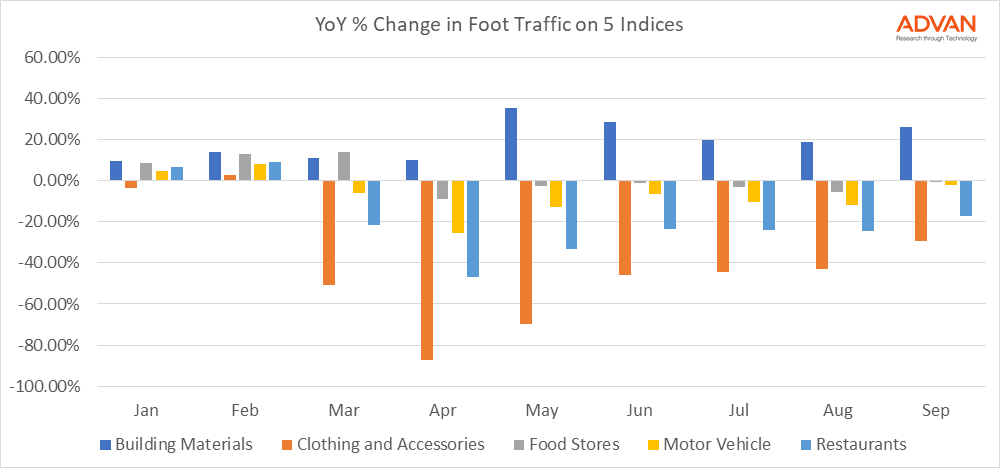
What does a COVID recovery look like for businesses? 6 months after the initial lock-down we know that, in the US, the journey has been remarkably different for different types of businesses. Our foot traffic indices capture trends that show just how varied the path has been. We looked at the percentage change in foot traffic for 5 different sectors during each month of this year.
Like many other sectors, the US car industry saw a sharp downturn in business when lock-down orders and business closures were at their peak in late March and April. Combined sales in April 2020 for the Big 3 US carmakers - GM, Ford and Fiat-Chrysler - were down 63% compared to the previous year according to GoodCarBadCar.net.
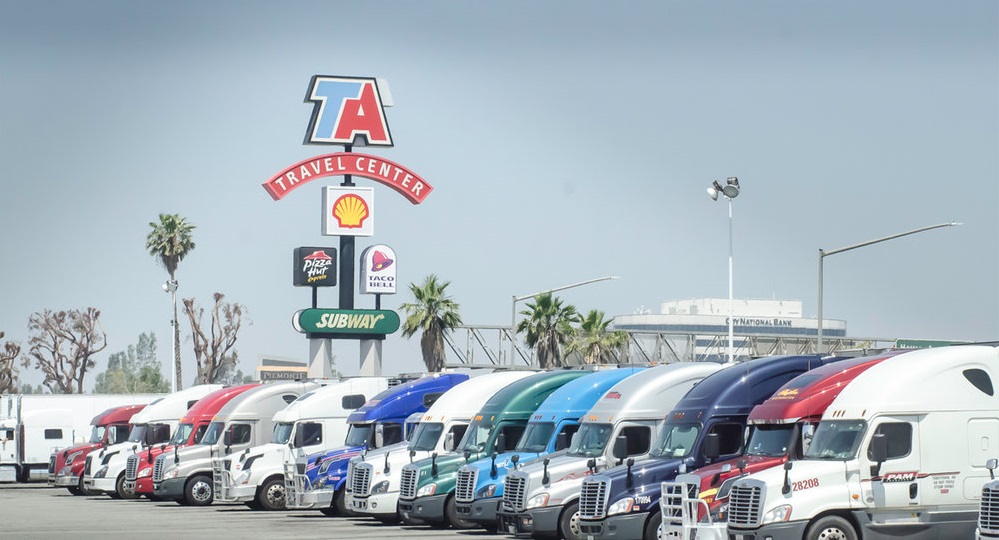
A recent article on Wall Street Journal by Peter Grant took an insightful look at how truck stops in the US have been boosted this year, in part due to the increase in demand for e-commerce and delivery. TravelCenters of America (NASDAQ: TA), the largest publicly listed operator of truck stops in the US, saw its share price increase 50% following its quarterly earning announcement in early August.
As we near the last stretch of the US summer season, we looked again at foot traffic data for US airports as one measure of the impact being felt by the travel industry. In our blog post on June 19th, we noted that traffic at US international hubs was severely depressed, with some regional hubs seeing a little more activity.


