U.S. weekly hotel performance continued to rev up with the largest week-over-week increase in occupancy this year. A level of 54.6% for 6-12 February 2022 was 4.2 percentage points better than the week prior, and in absolute terms, occupancy was highest since the second week of December. All day parts saw growth with the largest occupancy gain over the weekend (Friday and Saturday), up 6.6 percentage points to 64.1%. Of the 166 STR-defined markets, 91% reported week-over-week gains in weekend occupancy.
One of the lessons from the global pandemic was never to miss an opportunity in adversity as many suppliers around the world will tell you! The airline industry as we all know suffered more than most as borders were closed, travel restrictions applied and consumer confidence evaporated in the face of rapidly increasing infection rates in nearly every country.
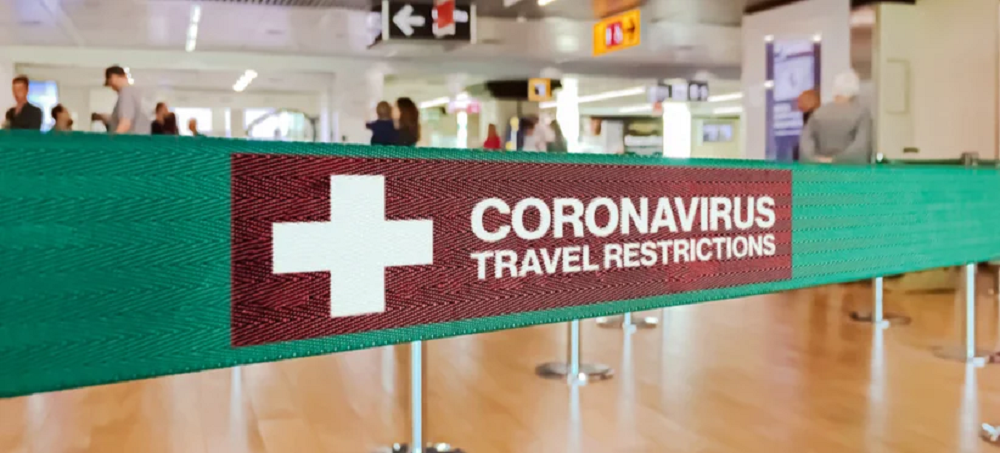
The many re-formulations of travel restrictions that have been imposed by governments on international travel these past two years have had a huge impact on the entire travel sector. We know that frequent changes to travel rules affect traveller confidence. If you can’t be sure of the travel requirements for a trip, think they might change, or are concerned about the cost of adhering to the rules imposed, then many would-be travellers will simply wait a bit longer before booking.
New research from ForwardKeys reveals that flight bookings to and from the UK have soared following the government’s announcement that COVID-19 testing would no longer be required for fully vaccinated travellers entering the UK. The day after the announcement by the UK Transport Secretary was made, combined inbound and outbound flight bookings jumped to 84% of pre-pandemic (2019) levels, outbound to 106% and inbound to 47%.
According to ForwardKeys’ Forecast data, this year, the number of Russian outbound travel is expected to increase by +64% when compared to 2021, and +96% when compared to 2020. Regarding when we can expect it to recover to 2019 levels, Nan Dai, China Market Expert at ForwardKeys says: “Looking at the current pattern and pace for bookings, it is expected to recover to 2019 levels approximately in 2025-2026.”
ForwardKeys’ latest analysis on Q1 inbound air travel in Brazil confirms the relevancy of casting a wider net during the pandemic – in terms of air connectivity and source market promotions. Meanwhile, the domestic travel market could be what keeps the ship afloat as new case numbers increase. When examining the latest ticketing data for confirmed arrivals in Brazil in January – March 2022, the total international arrivals are -54% compared to 2019.
The last weeks of December along with the first weeks of a fresh year are typically slower for hotels. Throw in lingering concerns around the pandemic and many areas of the country have seen low performance as the calendar flipped from 2021 to 2022. Not all markets are deep in deficit territory, however, as a diverse range of STR-defined markets are achieving relatively strong indicators. Our new “bubble charts” for 2022 highlight the leaders and laggards for the four weeks ending 15 January.
Every week for the last two years we have been providing a weekly update on the impact of Covid-19 on scheduled airline capacity around the world. Throughout that time, providing the air travel ecosystem with essential data has had many ups and downs, twists and turns. This week is no exception as airlines remain spooked by the latest wave of Covid-19 and have once again been cutting capacity with another 18 million seats removed from sale through to the end of March, resulting in over 51 million seats being 'lost' from the first quarter of this year.
Notable Hit 1: (UAL:NASDAQ) On Thursday January 21, 2022 United Airlines Holdings, Inc. (UAL) posted better-than-expected revenues of $8.192bn surpassing the consensus estimate of $7.93bn or by +3.3% and in the same direction as Advan's forecasted sales. The revenue was up 140% YoY - Advan's foot traffic data captured an increase in foot traffic of +79% YoY at United's passenger terminals for Q4 2021. Advan's footfall data has a correlation of 0.94 on a YoY basis with UAL's top-line revenue over the last 12 quarters.
A new report from ForwardKeys reveals the recent lockdowns in China, imposed in response to outbreaks of the Omicron strain of Coronavirus, have cast a long shadow over Chinese New Year travel plans.The latest data, as of 11th January, shows flight bookings for the upcoming holiday period, 24th January – 13th February, were 75.3% behind pre-pandemic levels but still ahead by 5.9% of last year’s dismally low levels.
Airline capacity continues to fall as Omicron spreads with 33 million seats now dropped in two weeks to the end of March. The great thing about data is not just the actual numbers but the trends and patterns that emerge; unfortunately, those trends this weekend are probably what we anticipated. England provided their customary two batting collapses inside four days to be “whitewashed” in Australia and global aviation capacity fell again week-on-week.
The first week of 2022 (2-8 January) was somewhat typical for a first week in January. U.S. hotel industry occupancy dipped to 45.4%, which was eight percentage points lower than what it was in the comparable week of 2019 but eight percentage points higher than a year ago. In STR’s 23 years of daily performance measurement, this most recent week’s occupancy was among the lowest for the comparable time period—better than what was seen in 2000 and 2011 but worse than most all of the early 2000s. The highest occupancy for this week was posted in 2018 at 56.8%, with the next highest at in 2007 (54%).
The rise of the Omicron variant coincided with the start of the 2021 holiday travel season, and many worried that the rise in cases would throw a wrench into Americans’ much anticipated travel plans. We dove into the foot traffic data to find out – how did the current COVID wave affect holiday travel? Despite the fourth and fifth COVID waves, location analytics data shows that the hotel industry has been on the path to recovery for quite some time. In July, at the height of the summer travel season, all the hotel chains analyzed showed impressive year-over-two-year (Yo2Y) growth in visits.
Global airline capacity has fallen this week as the impact of travel restrictions begins to be felt across the European market with 3.4 million fewer seats in Western Europe and 720,000 fewer in Eastern Europe. Ryanair did warn us all that this was going to happen, and it has - a 24% reduction in Western Europe and 20% in Eastern Europe. It’s slightly ironic that last week the UK Minister of Transport eased travel testing requirements around the Omicron variant just as capacity was cut, finger on the pulse and UK Government decisions have never been aligned during the pandemic, have they?
The devil really is in the data this week, or to be more precise it is behind the data, but let’s start by looking at how 2021 finished. Global airline capacity ended at 5.7 billion seats compared to the 8.7 billion reported in 2019, so 35% below pre-Covid levels, and of course, demand is much lower for those 5.7 billion seats. Positively, the second half of 2021 saw a stronger recovery than the first half, and global domestic capacity was at 80% of 2019 levels thanks to markets such as China, the United States and Russia.
How did people get anywhere before Google Maps? The GPS app leads all travel apps for most new installs in the year 2021. Below you can see the 10 most downloaded travel mobile apps and OTA (online travel agency) apps across the world and in the US. You can find our full list of 2021 worldwide download leaders here, and compare them with 2020's most downloaded apps. If you need to fully understand what a download is and what is does/does not measure, we have that for you as well.
Seats are not the same as passengers and just because aircraft fly, doesn’t mean they are full. Whilst scheduled capacity gives a current and future view of what is happening – it doesn’t tell you what has happened and how busy those planes actually were. Passenger booking data (how many travelled) and load factors (expressed as a percentage of the seats which had passengers sat in them) do that and provide a benchmark, a view that can be used for future trends and forward-looking indicators across many sectors.
STR’s final 51-chart map of the year shows recent national/regional trends and many states finishing 2021 strong. Further, trend lines for revenue per available room (RevPAR) on a total-room-inventory (TRI) basis provide ample evidence of the hotel industry’s extraordinary rebound, particularly in the second half of the year. Despite expectations for some travel hesitancy related to the spread of the Omicron variant, RevPAR for the four weeks ending with Week 50 (11 December) remained near (or above) 2019 levels for a vast majority of states. Of course, the most recent weekly index comparisons with 2019 are against normal, off-peak months.
In our last global P&L article, we noted that hotel profitability improved across much of the globe as the industry continued its slow recovery. In this latest update with October data, we saw similar trends in P&L data although there were notable outliers in each world region. Among the major European markets, Berlin achieved an October gross operating profit per available room (GOPPAR) of US$95.82, which was 111% of the 2019 comparable. Berlin was the only major market in Europe that was able to surpass its October 2019 GOPPAR level.
In a somewhat typical post-Thanksgiving week (28 November-4 December), U.S. hotel occupancy rose from the previous week to 54.8%. Occupancy indexed to 2019 was 91, which was good but lower than the previous three weeks. However, when compared with 2010, a year like 2021 because of calendar make up and the rebuilding after the Great Recession, occupancy was 10% higher. This week’s average daily rate (ADR) surprised on the downside, falling 0.6% week on week. But with the gain in occupancy, weekly revenue per available room (RevPAR) increased by 3% from the prior week.


