In this alternative review of the summer 2022 travel season, Juan A. Gomez, Head of Market Intelligence at ForwardKeys, poses the question, “How would European travel recovery have evolved without the airport chaos and flight cancellations?” Following some setbacks at the beginning of the year – namely the emergence of the Omicron Covid variant and the escalation of the Russo-Ukrainian war – travel recovery in Europe appeared to be firmly on the right track heading into summer.
After the hiatus of the past couple of years, OAG Megahubs is back! In a marked change from 2019, Megahubs 2022 demonstrates that, at least for the moment, US airports are the most internationally connected airports in the world. Thirteen of the Top 20 most internationally connected airports are in the USA with Chicago’s O’Hare International Airport (ORD) topping the table. On the busiest day in 2022, there were 43,350 possible international connections at ORD within a six-hour window. The airport has airline services to 66 international destinations and, combined with the extensive domestic network available at the airport, makes for a winning hub operation.
As anticipated, U.S. hotel demand for the week of 11-17 September 2022 soared back, increasing 13% week on week (WoW) and pushing occupancy to a six-week high of 69.6%. Weekday (Monday-Wednesday) occupancy was slightly better at 69.9%, with the measure reaching 75.5% in the Top 25 Markets—the second highest level of the pandemic-era behind the week ending 18 June 2022. Nominal average daily rate (ADR) made its way to a seven-week high (US$156), up 5.8% WoW and +18% year on year.
STR’s latest global bubble chart update shows strong top-line performance indicators for much of the world during the four weeks ending 20 August 2022. Among the developments since our previous update, countries around the Mediterranean region led in overall performance, while more markets overall eclipsed pre-pandemic levels of occupancy. Among the 48 countries with room supply of more than 50,000 hotel rooms, 11 reported occupancy above 75%, which was four more than the previous 28-day period.
Air travel to the southeast corner of Europe substantially exceeded pre-pandemic (2019) levels in the peak summer months of July and August. The two largest destinations, Turkey and Greece, both exceeded pre-pandemic levels of international visitor arrivals by 9% and 2% respectively. Air travel to Albania (a relatively small destination with less than 1% market share of European flight arrivals) was also up by 28%. While no other major country destinations recovered to the numbers seen in 2019, Slovenia, just 7% down, Iceland, 8% down, and Portugal, 10% down, came close.
Although global airline capacity remains above the 100 million seats a week mark, it is likely that this will be the last week that we manage to break that barrier for the rest of the year. Week-on-week some four million seats were dropped from this week’s operating programmes. Next week’s data is already hovering just above the 100 million seat mark, and allowing for the current rate of capacity drop each week, we will be back in the high nineties in seven days’ time.
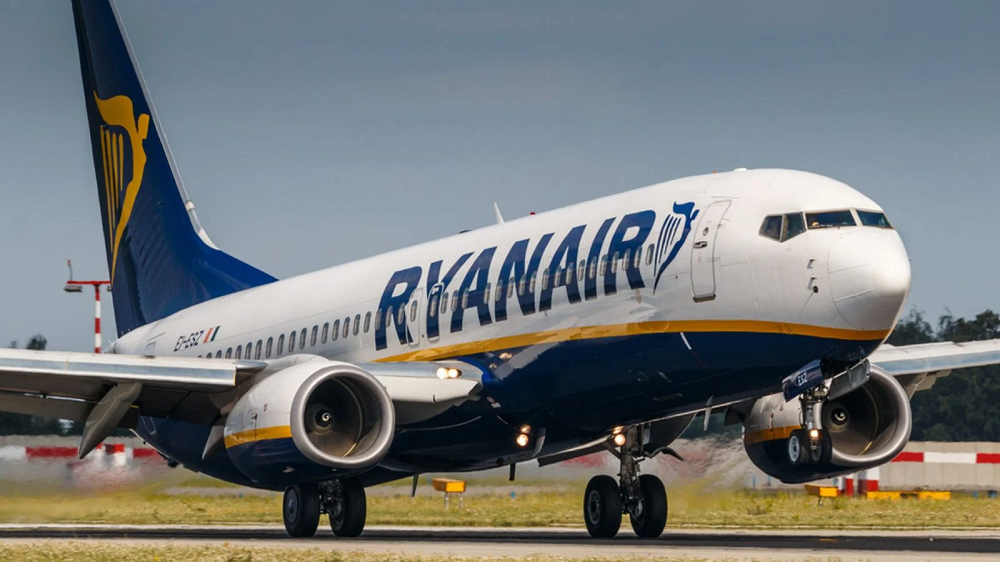
Ryanair is now the fifth largest airline in the world (in terms of capacity) and returned to profitability in the second quarter of 2022, making it the most successful of the three largest European low-cost carriers. Drawing on OAG data for airline capacity and flight cancellations, as well as information published in airline financial statements for the period April to June 2022, we compare Ryanair with easyJet and Wizz Air on some key metrics to understand what is behind Ryanair’s success.
There are some interesting movements in the weekly capacity update from OAG, even though global airline capacity looks to be as stuck as the Manchester United back four! Weekly airline capacity is still at 102.4 million seats with 79,000 seats lost week-on-week, but dramatically Western Europe is now the largest regional market overtaking North America and holding first place in the global rankings. This is an “enjoy it while you can” moment for Western Europe as this is a function of the different school holiday seasons in each market and come September normal service will be resumed.
Not surprisingly, recent economic conditions have affected consumer behavior this summer. On one hand, consumers are ramping up travel and spending in the latest phase of the COVID-19 pandemic. On the other hand, inflation, global uncertainty, and the possibility of a recession seem to be causing some consumers to curtail their spending. Looking at de-identified Yodlee spend data, we’ve found some consumer spending trends that may help investors and strategists uncover new opportunities.
Summer travel is booming this year, but it’s also been extremely chaotic. Constant flight delays, cancellations, and lost luggage are making post-lockdown travel a nightmare. But new data from the Transportation Department show that airlines, not bad weather, are the ones to blame for recent disruptions. So what happened to airlines in recent years that could have caused this chaos? While the industry started to recover in late 2020, the current headcounts in the US are nowhere near the pre-pandemic level.
This week’s airline capacity numbers look pretty similar to last week's (which in turn were like the previous weeks) and it seemed that we had perhaps peaked at around 102 million seats a week. However, then China reported another lockdown, this time in Hainan, where most areas have been locked down today in response to a domestic COVID-19 outbreak. The impact of the latest lockdown is not reflected in this week’s numbers, but we should expect to see at least a million seats removed next week as the two major airports are impacted.
A modest half a million more seats week on week once again takes global capacity above 102 million as we enter the peak holiday month of the year. This means a remarkable 25% more seats than this time last year, and at 14% below 2019 levels, we edge ever closer to pre-pandemic levels. Looking forward, it looks like capacity is baked in at more than 100 million for the rest of the month, and feels like every flight operating is crammed with holiday makers and a few businessmen still working, who typically seem to be in either seat B or D!
While the calendar shows that the summer of 2022 is pushing toward its conclusion, travel season remains in high gear around the U.S. Aligned with that season, the latest four-week “bubble” charts from STR show that leisure-oriented travel remains the predominant force behind the top performing U.S. hotel markets. For the four-week period ending with 16 July, Oahu led the Top 25 Markets in average occupancy (84.2%) with a conspicuous boost during the Fourth of July holiday—the same period when most markets saw expected and significant demand declines.
In recent weeks, news of airlines cancelling flights and images of long queues at European airports have dominated mainstream media, with many travellers reported having missed their flight due to lengthy delays even after check-in. To shed light on how bad the situation really is, ForwardKeys has taken a closer look at air traffic disruption by analysing recent cutbacks in capacity around the world.
Despite some airports capping airline capacity without consultation in the last week - and the sad, if inevitable, decision of one UK airport to begin the closing process - it has been another week of capacity reaching above 102 million seats, and we should probably enjoy that heat whilst we can. Unsurprisingly, it is only the larger airports that are capping airline capacity for the peak holiday season, this inevitably means we will see capacity fall in the coming weeks in some key locations.
We took a look at airport foot traffic data from the past few months to understand how the travel sector is reacting to easing pandemic restrictions, newfound inflation concerns, and rising gas prices. After two long pandemic years, people are ready to fly again. But a new challenge is throwing a wrench in the budding air travel recovery – airport staffing woes. Many airport and airline employees, including pilots and service workers, were laid off during COVID, and airports are finding that resuming normal operations will take time.
This week saw several airlines making capacity cuts in the United Kingdom, airline COOs departing from two of Europe’s major carriers and Virgin Atlantic announcing a new route to Florida. SAS called their pilots' bluff, and were double bluffed themselves into an application for Chapter 11, and, reassuringly, despite everything global capacity increased slightly week-on-week to 102.1 million, leaving us just 14% below the 2019 mark.
As shared in a presentation on summer travel trends and tourism prospects for Spain delivered on the 30th of June by the Spanish Ministry of Industry, Trade and Tourism and ForwardKeys, confirmed bookings for travel to Spain in July and August point to “a summer like before the pandemic”, with the country having recovered nine in ten international bookings made in 2019.
Airlines with high cancellation rates gained seven points in market share by daily active users (DAUs) year-to-date, but simultaneously lost just as much market share by new installs. It's not too hard to see what is going on here. Fliers are launching the app to sort out cancellations, then they are moving on to check out the more reliable carriers. DAUs typically equate to loyal customers. In this case, Spirit, JetBlue, Frontier, Allegiant and Alaska are gaining "Ghost DAUs". The here today, gone tomorrow type.
The summer travel outlook report, produced for the World Travel Market (WTM) by ForwardKeys, reveals that in the third quarter of the year, July, August and September, global air travel is set to reach 65% of where it was before the pandemic in 2019. However, the revival is patchy, with some parts of the world doing much better than others and some types of travel, particularly beach holidays, being much more popular than urban city visits and sightseeing.


