For the past two quarters, Boston has ranked as the most liquid commercial property market in the U.S., bumping Manhattan into second place, according to the RCA Capital Liquidity Scores. In the chart below we illustrate how Boston has usurped Manhattan, showing the six inputs which are weighted to calculate the overall scores. –For Boston, the component of unique, active buyers has slipped only slightly in the past four quarters, while for Manhattan this input has been falling since the end of 2019, dropping at an accelerated pace over the past two quarters.
Jumbo-conforming mortgage rate spread widened during the pandemic.Low interest rates during the pandemic didn’t favor homebuyers with large-balance mortgage loans the same way as it did other homebuyers. While the mortgage rate dropped to a record low in 2020, the jumbo-conforming mortgage rate spread widened. In other words, jumbo loans were relatively more expensive than conforming loans.
The headline rate of U.S. property price growth quickened in May, powered by accelerating increases in apartment prices and gains across all major property types, the latest _RCA CPPI: US_ summary report shows. The US National All-Property Index grew 0.8% from April and 8.9% from a year ago. Apartment sector prices were the fastest growing in May at 10.1% year-over-year, overtaking industrial at 9.5%. Office price growth came in at 2.9% and the retail sector turned in a 2.3% annual gain.
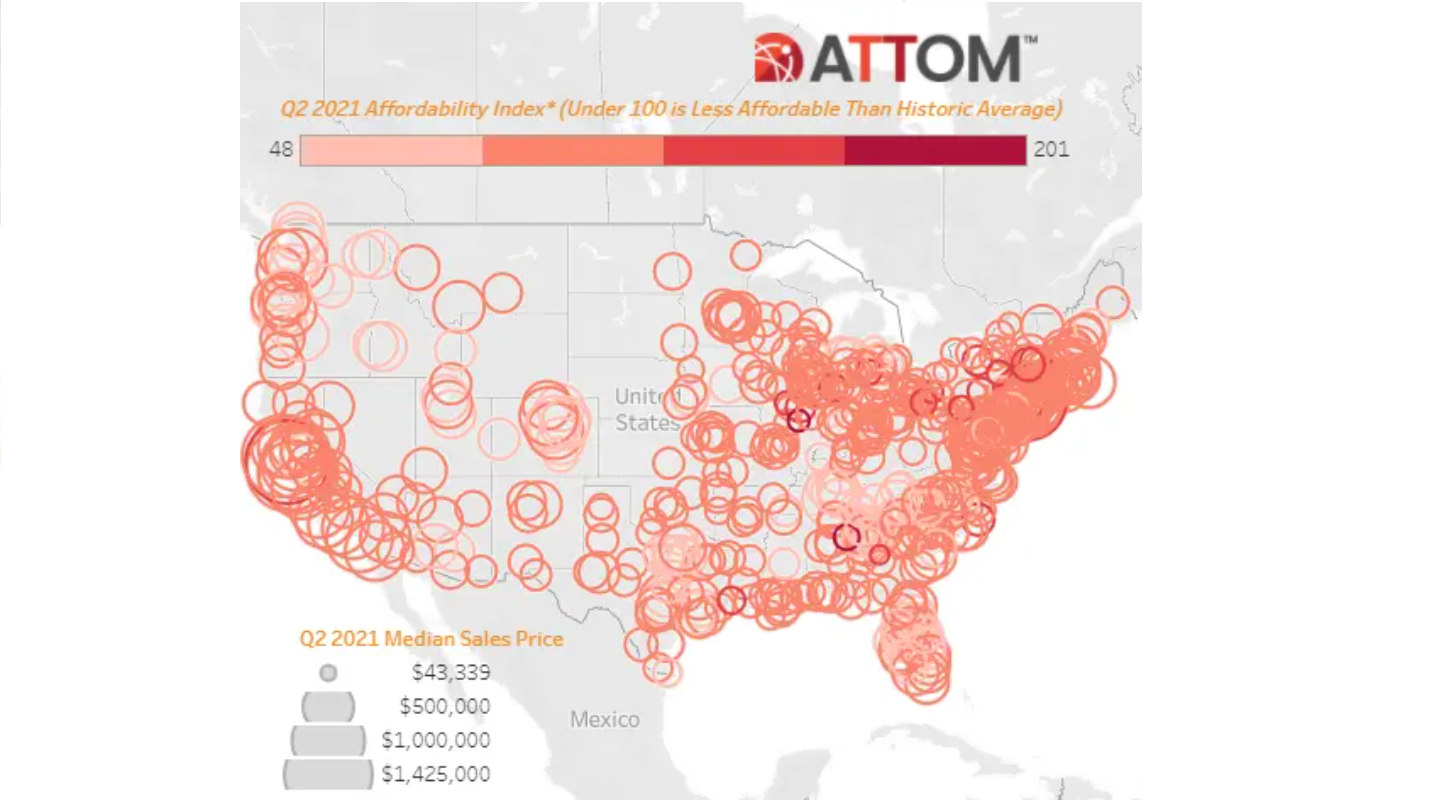
ATTOM, curator of the nation’s premier property database, today released its second-quarter 2021 U.S. Home Affordability Report, showing that median home prices of single-family homes and condos in the second quarter of this year are less affordable than historical averages in 61 percent of counties across the nation with enough data to analyze. That was up from 48 percent of counties in the second quarter of 2020, to the highest point in two years, as home prices have increased faster than wages in much of the country.
To assess how severely the rental market has been disrupted by the COVID-19 pandemic, and how quickly it is returning to pre-pandemic prices, we use historical rent data to estimate “projected” rent prices from April 2020 onward. These projections assume that rent growth in 2020 and 2021 mirrors pre-pandemic growth and follows typical seasonal trends in each city studied. For more details on these projections, see the Methodology section below.
U.S. commercial real estate transaction volume jumped in May compared to a year prior when the pandemic put the brakes on activity, the latest _US Capital Trends_ report shows. Apartment sector activity was more than double that seen a year ago and deal volume surpassed that of the office and industrial sectors combined. For the first five months of 2021, the apartment sector is the only major property type to eclipse deal levels in the same months of 2020 and the average of the years leading up to the pandemic.
Housing prices continue to surge—frustrating potential homebuyers. “It’s becoming clear that record-high price growth and an enduring shortage of available homes are beginning to hinder would-be homebuyers,” said Matthew Speakman, an economist at Zillow. “Sales volume continues to struggle to regain the momentum it built late last year.” Residential homeowners and politicians are pointing fingers at investment firms, but data points to other culprits. At the same time, commercial real estate won’t fully rebound for another couple of years.
Canadian investors have been one of the most resilient sources of capital throughout the pandemic era so far. Since the beginning of 2020 they have largely maintained their capital outlay, though there has been a marked shift in where that capital has headed. Up until 2019, the U.S. had been garnering an increasing share of Canada’s overseas spending. However, since 2020, Canadian investors have diverted their attention outside North America, with around half of outbound allocations leaving the continent.
Data made available just 48hrs behind real-time reveals a 30pt rise in visits to London Estate Agents versus the autumn of last year, the period prior to the last lockdown. This rise suggests warming in the capital’s residential property market as people rush to complete before the end of the stamp duty holiday on 30 June. Official statistics released this week by the Office for National Statistics shows how, despite a small recent drop, property market has been running at its fastest pace since before the financial crisis in 2012.
Investors intent on not letting a crisis go to waste will need to see beyond the distressed investing playbook that was formulated during the Global Financial Crisis (GFC). A different kind of crisis warrants a different distressed investment strategy and those investors strictly playing by past rules are likely to miss out. Distressed investing in the GFC era was about firms stepping in to help rebalance the capital stack. There were cash-flowing assets that simply had too high of a debt burden relative to income
Total construction starts dropped 1% in May to a seasonally adjusted annual rate of $902.8 billion, according to Dodge Data & Analytics. The brunt of the decline was borne by residential starts, while nonresidential and nonbuilding starts continued their recovery from the COVID-19 pandemic. “The weight of higher material prices and a lack of skilled labor are having a direct and notable influence on residential construction activity,” said Richard Branch, Chief Economist for Dodge Data & Analytics.
U.S. single-family rent growth increased 5.3% in April 2021, the fastest increase since May 2006, according to the CoreLogic Single-Family Rent Index (SFRI). The index slowed in 2020, but even when compared with 2019, rent growth is running above pre-pandemic levels. The index measures rent changes among single-family rental homes, including condominiums, using a repeat-rent analysis to measure the same rental properties over time.
With mortgage rates declining to ever new lows during 2020, the mortgage market had the largest number of originations in 17 years. The volume was driven by no-cash-out refinance: more than one-half of the originations, and 4-in-5 refinance loans, were no-cash-out during 2020. Interest rates on fixed-rate mortgages were at an all-time low at the beginning of 2021 and have moved higher since then. While forecasts vary, the consensus view among economists is that mortgage rates will rise between one-fourth to three-fourths of a percentage point during the next 12 months.
ATTOM, licensor of the nation’s most comprehensive foreclosure data and parent company to RealtyTrac (www.realtytrac.com), the largest online marketplace for foreclosure and distressed properties, released its May 2021 U.S. Foreclosure Market Report, which shows there were a total of 10,821 U.S. properties with foreclosure filings — default notices, scheduled auctions or bank repossessions — down 8 percent from a month ago but up 23 percent from a year ago. Foreclosure starts, which represent the initial notice of default, grew by 36 percent year-over-year.
2021 for the multifamily industry has been partially characterized by a very active new construction pipeline and a robust rebound in apartment demand. In ALN newsletters and blog posts these developments have been touched upon from various angles including price class, market size, and evaluation of specific markets. One area that has yet to be addressed is how all of the action of 2021 has played out across the urban-suburban-outlying area divide.
The amount of equity in mortgaged real estate increased by $1.9 trillion in Q1 2021, an annual increase of 19.6%, according to the lastest CoreLogic Homeowner Equity Report . The average annual gain in equity was $33,400 per borrower — the largest average equity gain in at least 10 years. The nationwide negative equity share for Q1 2021 was 2.6% of all homes with a mortgage, the lowest share of homes with negative equity since CoreLogic started tracking this number in the third quarter of 2009.
As we approach the midpoint of the year, it’s worth examining how commercial real estate markets are faring in comparison with the year of Covid’s eruption and prior years. RCA’s tracking of global commercial real estate sales shows all three global zones — the Americas, Asia Pacific, and Europe, the Middle East and Africa (EMEA) — remain deeply impacted. Volumes observed now across all zones globally are lower than both 2020 and the average of 2017-19 activity, but the severity of the drop varies across the world.
In March 2021, 4.9% of home mortgages were in some stage of delinquency (30 days or more past due, including those in foreclosure), a sharp decrease from February 2021 according to the latest CoreLogic Loan Performance Insights Report. The 0.8 percentage point decrease in the delinquency rate from February was the largest since the start of the pandemic and could be partly attributed to the largest one-month increase in employment since August 2020.
The last decade significantly shifted the urban geography of the United States. The longest economic expansion on record brought new opportunities and challenges, then came to a screeching pandemic halt in 2020. The growth was long-lived but uneven. New and existing innovation hubs and oil towns boomed, while some markets struggled to shake off sluggishness after the Great Recession. Throughout the 2010s, America’s housing growth both reflected and reinforced these trends.
Cross-border commercial property investment by Chinese firms has been on the wane since China’s government implemented curbs on capital outflows in 2017, and there’s no indication that these capital controls are going to be lifted any time soon. The charts below show just how significant the impact on overseas investment has been. Between 2015 and 2017, mainland Chinese investors deployed just over $91 billion into income-producing commercial real estate globally.


