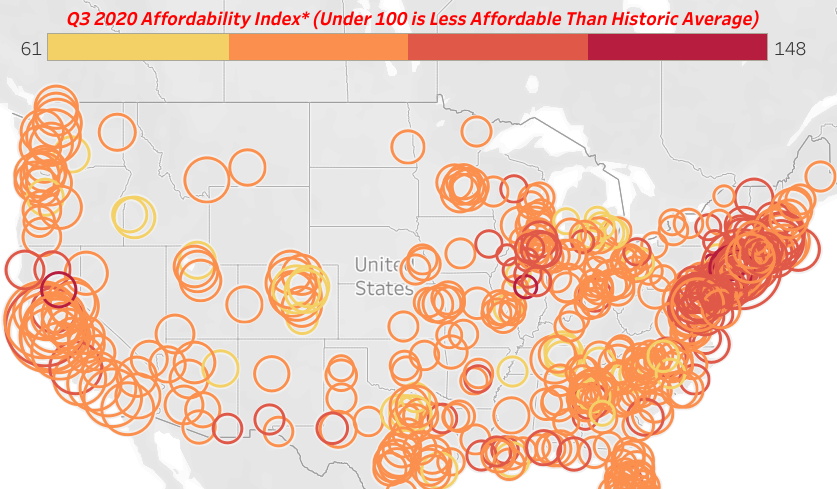
Median home prices of single-family homes and condos in the third quarter of 2020 are less affordable than historical averages in 63 percent of counties with enough data to analyze, up from 54 percent a year ago.
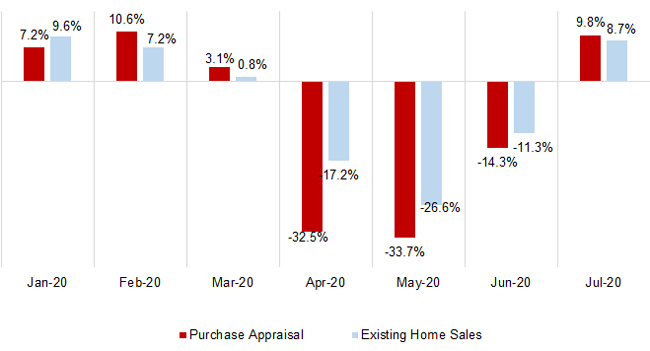
In the wake of the COVID-19 pandemic, purchase-loan appraisals took a blow from disruptions inflicted upon homebuying and selling activities under nationwide lock-down and social distancing restrictions. After all, there is less demand for appraisal services by lenders when home sales are down. Now, with much of the country re-opening, the good news is that home sales have rebounded quickly.
The amount of equity in mortgaged real estate increased by $620 billion in the second quarter of 2020 from the second quarter of 2019, an annual increase of 6.6%, according to the latest CoreLogic Equity Report. Borrower equity hit a new high in the second quarter of 2020, and borrowers have gained over $6 trillion in equity in the last 10 years.
The widening pandemic led President Trump to declare a national emergency on March 13, sparking shelter-in-place directives across many communities. The shuttering of commercial establishments subsequently put many American workers out of work. As such, many homeowners affected by sudden job loss were ill prepared to maintain payments on their home mortgage loans.
53,621 single-family homes and condominiums in the United States were flipped in the second quarter. Those transactions represented 6.7 percent of all home sales in the second quarter of 2020, or one in 15 transactions. That figure was down from 7.5 percent of all home sales in the nation during the prior quarter, or one in 13, but up from 6.1 percent, or one in 17 sales, in the second quarter of last year.
Through what has been an unusual year, to say the least, the multifamily industry has in many ways been on the front lines of the disruption to lives and livelihoods. This impact has been borne out across multiple metrics, but nowhere so clearly as in multifamily demand. Through the first eight months of 2020 apartment demand fell by 42% compared to the same period last year – even as new deliveries were almost on par with last year’s volume.
U.S. Single-Family Rents Up 1.7% Year Over Year in July. Rent increases slowed across all price levels, though rents for lower-priced homes increased faster than those of higher-priced homes in July compared with a year earlier. Honolulu saw the largest decrease in rent prices, falling 1.3% from a year earlier.
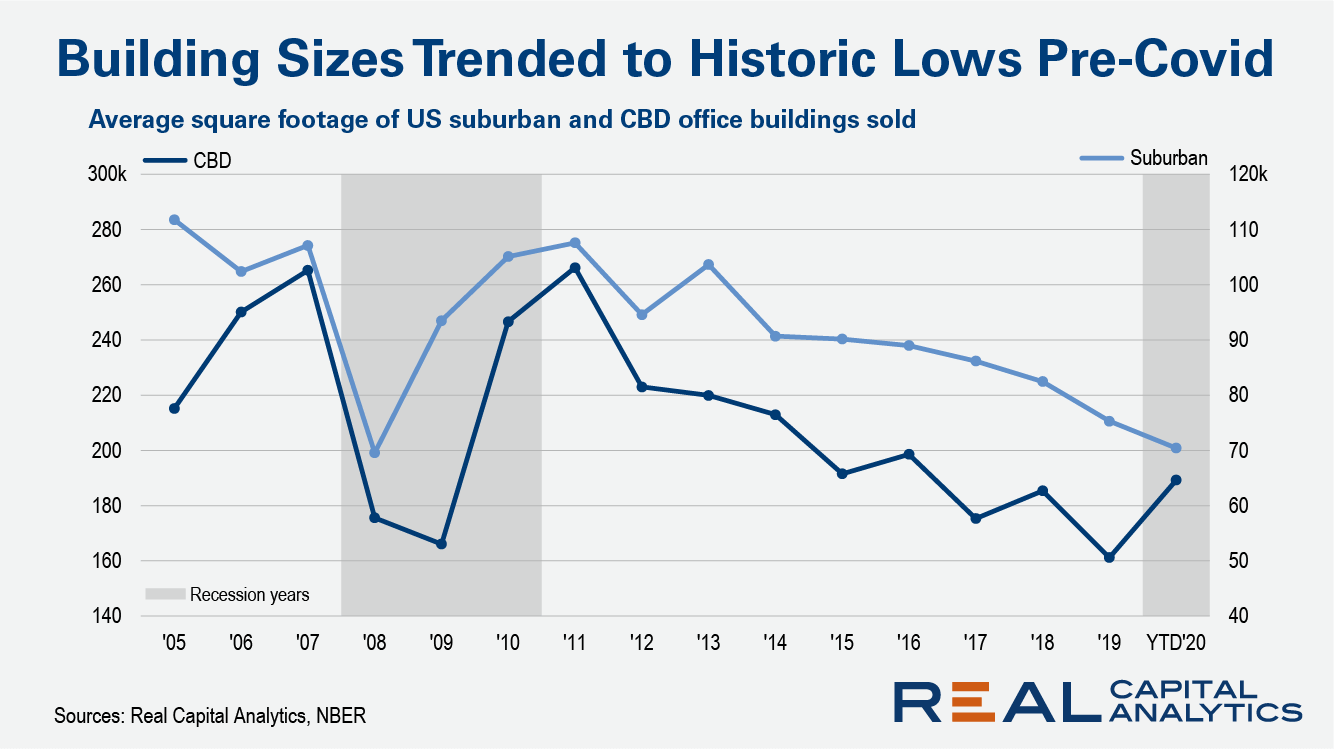
U.S. sales involving large office buildings had been on the decline throughout the economic expansion. As more small buildings sell, other measures of market health such as the dollar volume of deal activity can reveal a different meaning. A $100 billion market where half of the volume was concentrated in the purchase of expensive office towers is qualitatively distinct from a more broad-based market driven by the sale of a multitude of small buildings.
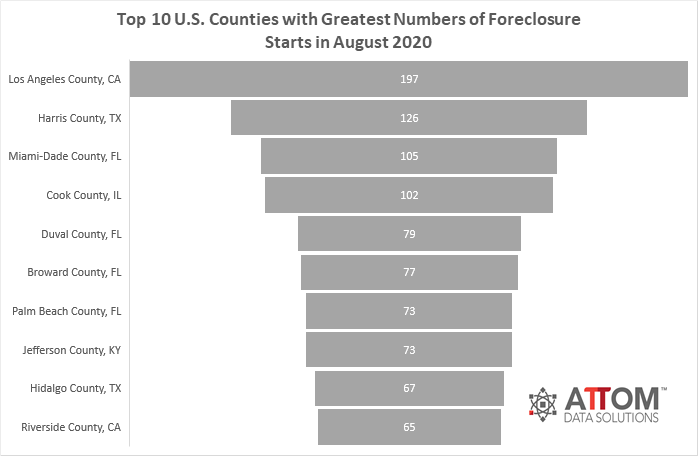
U.S. properties with foreclosure filings — default notices, scheduled auctions or bank repossessions — saw a slight uptick in August 2020 from July 2020, with 9,889 filings reported. That number increased monthly by 11 percent, but is still down 81 percent from last year.
There were a total of 9,889 U.S. properties with foreclosure filings — default notices, scheduled auctions or bank repossessions — in August 2020, up 11 percent from a month ago but down 81 percent from a year ago. “While foreclosure activity remains over 80% below 2019 totals, there was a significant increase in foreclosure starts in August compared to July,” said Rick Sharga, Executive Vice President at RealtyTrac.
Widespread difficulty with housing costs has been a troubling constant. Despite a slight improvement in this month’s data, 29 percent of Americans failed to pay their rent or mortgage in full during the first week of September, and 8 percent had not completed their August payment by the end of the month.
The COVID-19 pandemic put tremendous pressure on the new mortgage market in the United States through May 2020. While COVID-19 has made the in-person home inspection process more challenging, it has not slowed the pace of new mortgage applications and re-financing through this time period.
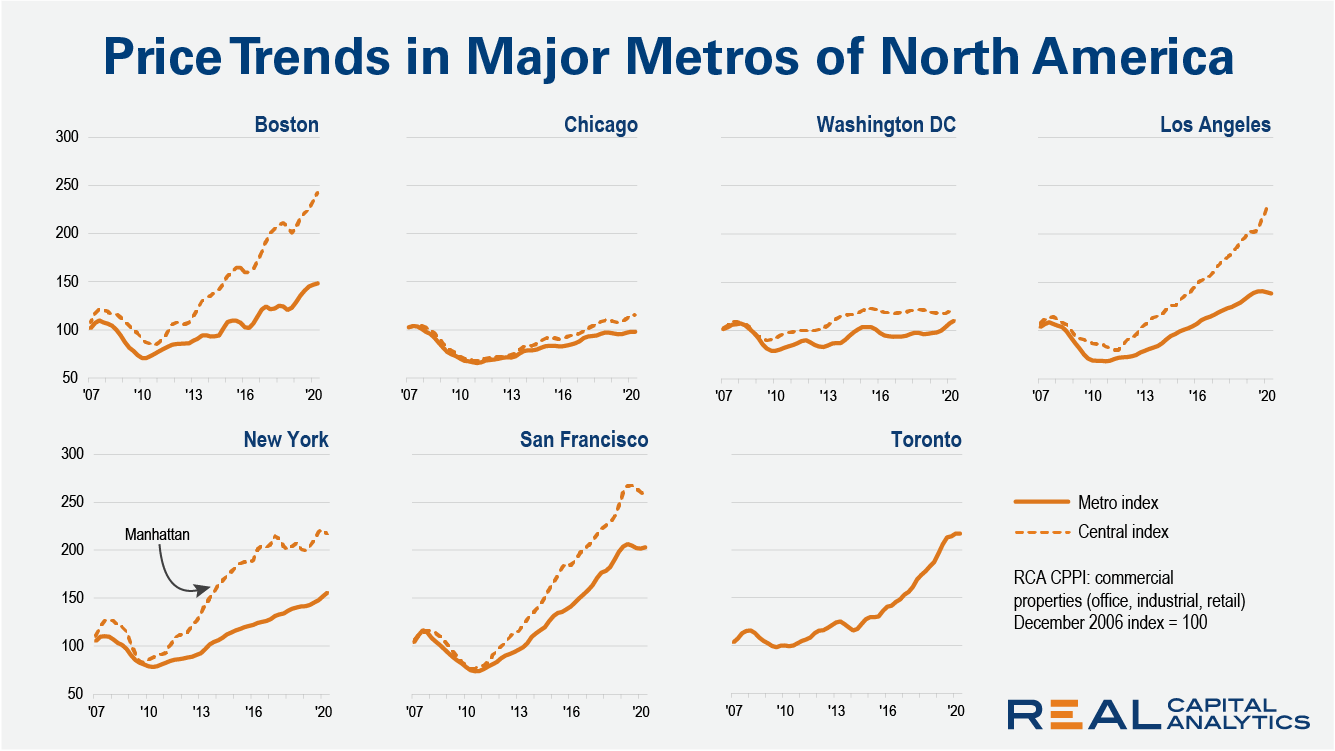
Despite historic challenges to commercial real estate deal activity in 2020, prices in most leading North American metros continued to move higher in the second quarter of the year, according to the latest RCA CPPI Global Cities report. New York metro area prices, which have lagged Manhattan price gains over the past decade, increased 9.0% from a year prior.
The nation’s overall delinquency rate was 7.1% in June. All states logged annual increases in both overall and serious delinquency rates in June. In June 2020, 7.1% of home mortgages were in some stage of delinquency (30 days or more past due, including those in foreclosure), slightly lower than the May 2020 rate of 7.3%, but a 3.1-percentage point increase from June 2019.
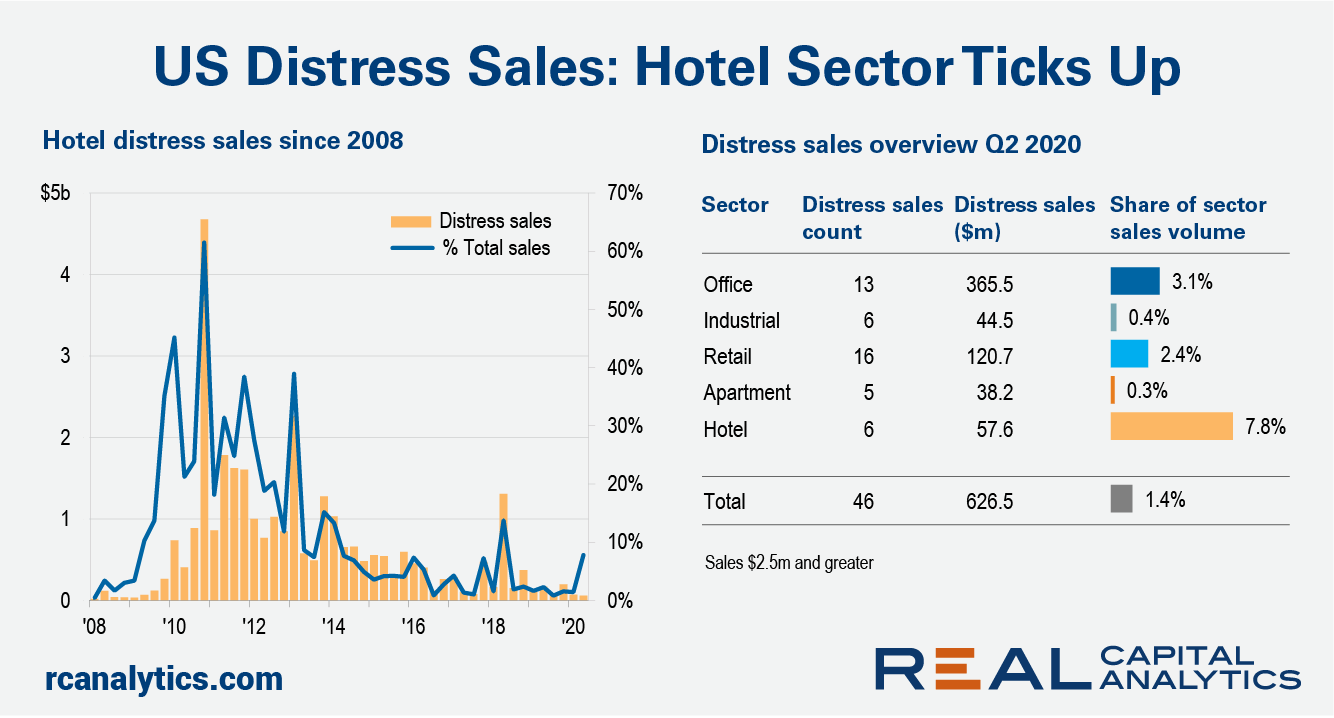
Rising distressed sales of commercial properties can be the push that topples commercial property prices, but with the exception of the hotel sector, such activity is still a small portion of the U.S. market. The economic calamity from the Covid-19 crisis has changed investor perceptions of prices with few still willing to step up to the high pricing set before the upheaval.
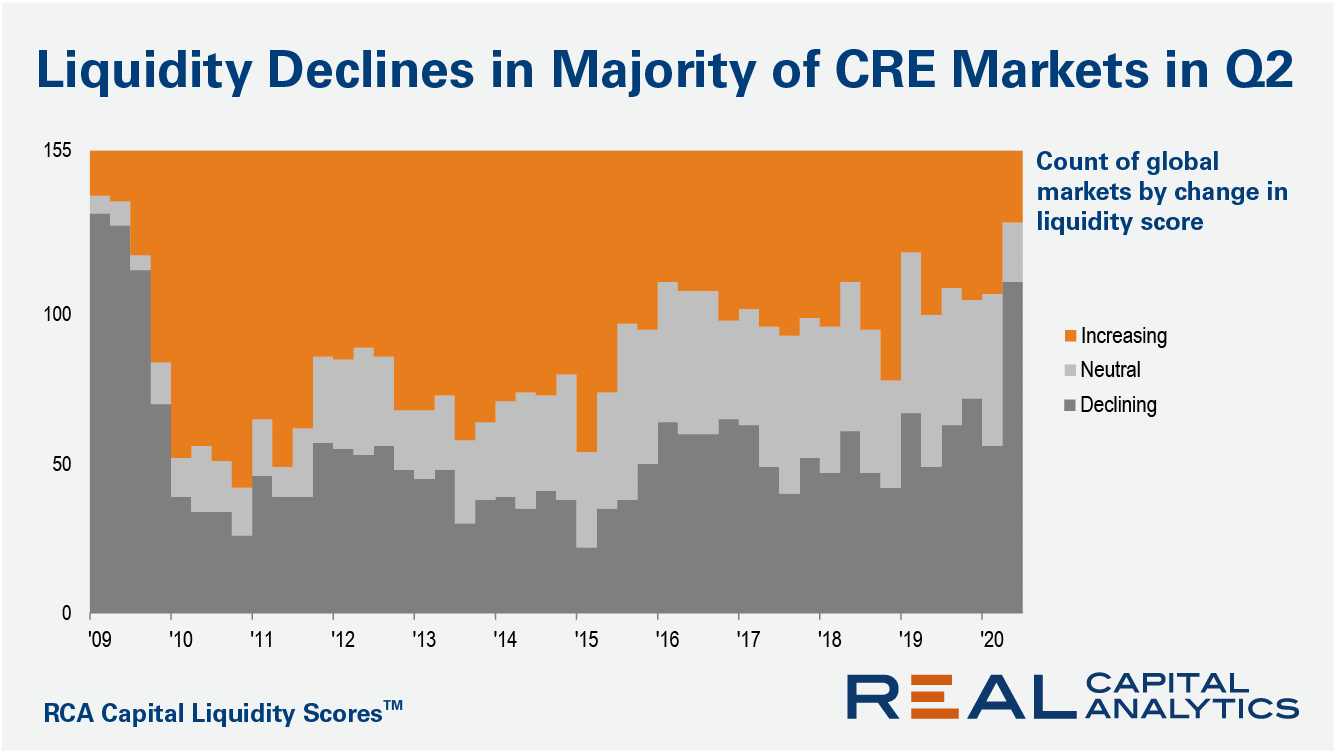
Market liquidity fell in 111 of 155 global commercial real estate markets in the second quarter of 2020, according to the midyear update of the RCA Capital Liquidity Scores. The count of markets posting lower quarter-on-quarter levels of liquidity is the worst since the Global Financial Crisis.
According to a Harris Poll survey conducted at the end of April this year, 39% of urban dwellers said the COVID-19 crisis has prompted them to consider leaving for a less crowded place. In addition, a number of recent news articles bring into question desirability of high-density living. In the following analysis, we examine recent changes in demand for condominiums as well as any potential impact on prices and inventory.
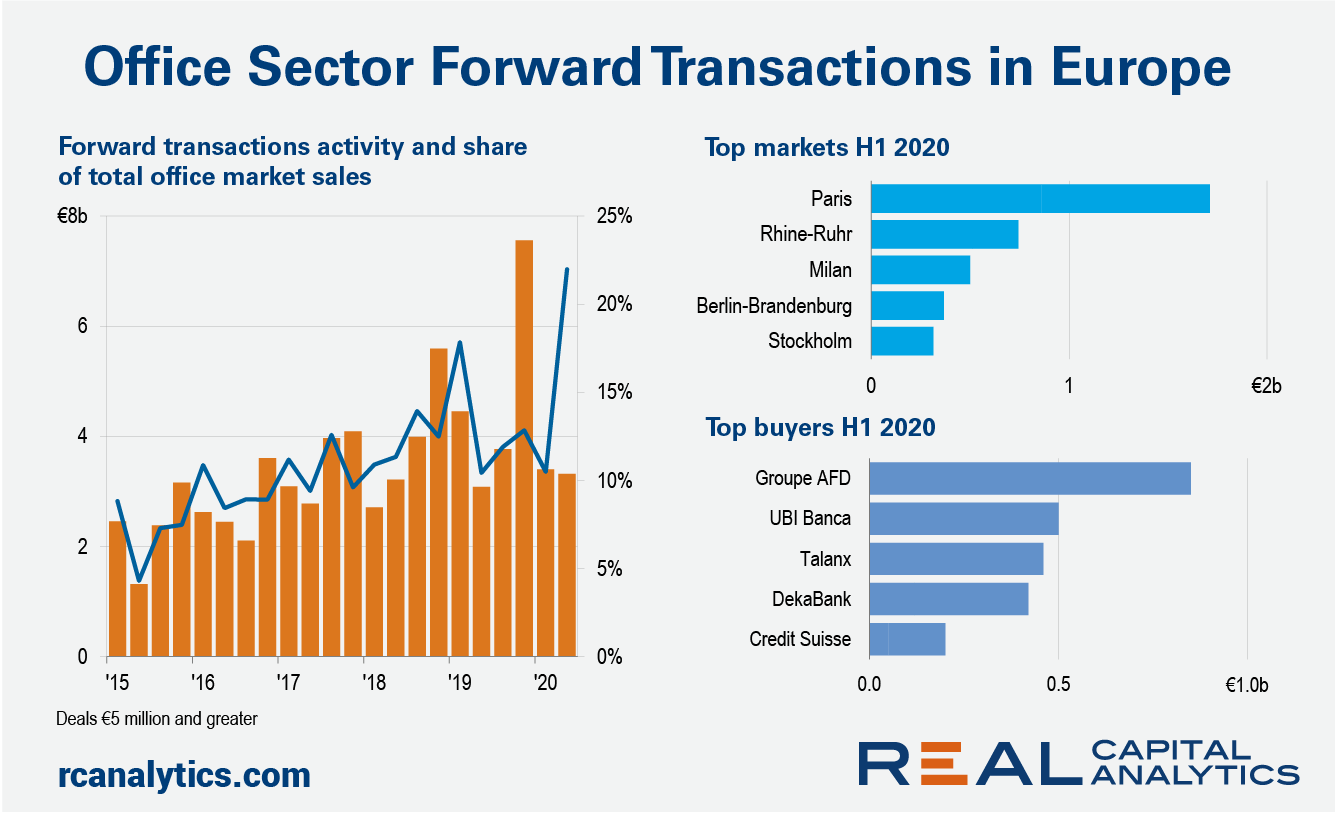
Investors stuck to the forward transactions route to acquire European office properties in the second quarter of 2020, indicating that investor demand for the asset type is still alive despite concerns over future needs for corporate space. Forward commitments leapt to a record proportion of European office deal volume, with the jump in share reflecting the resilience of these deals and the slump in the office market overall.
National home prices increased 5.5% year over year in July 2020, according to the latest CoreLogic Home Price Index (HPI®) Report. The July 2020 HPI gain was up from the July 2019 gain of 3.4% and was the highest year-over-year gain since August 2018. Strong demand, low mortgage interest rates and low supply of for-sale homes helped push home prices higher in July.
Due to a confluence of factors such as increased construction deliveries, reduced tourism and business travel, very high average rents, and a workforce more mobile than that in many areas of the country the Bay Area market in California has been especially negatively impacted from a multifamily perspective so far this year. For that reason, in this space today we’ll be taking a closer look at recent performance for the area across a variety of metrics.


