Home prices nationwide, including distressed sales, increased year over year by 17.2% in June 2021 compared with June 2020 and increased month over month by 2.3% in June 2021 compared with May 2021 (revisions with public records data are standard, and to ensure accuracy, CoreLogic incorporates the newly released public data to provide updated results).
National home prices increased 17.2% year over year in June 2021, according to the latest CoreLogic Home Price Index (HPI®) Report . The June 2021 HPI gain was up from the June 2020 gain of 4.5% and was the highest year-over-year gain since 1979. The increase in home prices was fueled by low mortgage rates, low for-sale supply and a rebounding economy. Projected increases in for-sale supply and moderation in demand as prices become out of reach for some buyers could slow home price gains over the next 12 months
Industrial investment in Asia Pacific broke a high-water mark at the end of 2020, but investors aren’t done yet. Prior to 2021, quarterly volume had surpassed the $10 billion level only twice – in the first quarter of 2018 with the privatization of GLP, and in the fourth quarter of 2020, when over $12 billion of industrial deals were completed. The exchange of the Milestone Industrial Portfolio for A$3.8 billion ($2.8 billion) in June, Australia’s biggest ever industrial deal, helped push overall APAC industrial investment on level footing with the office sector.
Europe’s commercial property market moved back into the black in Q2 2021 after four quarters of declines in deal activity caused by the pandemic, the latest _Europe Capital Trends_ report shows. Commercial property sales increased 20% compared to a year ago, led by the U.K. where sales jumped 77%. Industrial sector deals and a couple of large London office transactions boosted the U.K. deal volume total. London was the most active commercial property market for the first six months of the year, reclaiming the top spot from Paris, which fell to third position.
Australian commercial real estate sales rose in the second quarter, fueled by increased deal appetite among domestic investors and a multibillion-dollar logistics deal, the latest _Australia Capital Trends_ report shows. Sales of income-producing properties priced A$1 million and greater totaled A$13.4 billion (US$9.9 billion) in Q2 2021, a 15% improvement on deal levels of a year ago. The biggest boost for the quarter was Blackstone’s sale of the 45-property Milestone Industrial Portfolio. The transaction was the largest portfolio deal on record in Australia.
To use a technical term, housing markets across the nation are “hot.” The news is filled with stories of bidding wars, homes selling in hours and homes selling significantly above the list price — not to mention listing inventory at record low levels and supply-chain constraints pushing lumber prices up 42% YoY in March, adding to new construction costs. Certainly, the housing market has been a bright spot during the COVID-19 pandemic.
Welcome to the August Apartment List National Rent Report. Our national index increased by 2.5 percent from June to July, continuing a months-long trend of rapidly accelerating rent growth. So far in 2021, the national median rent has increased by a staggering 11.4 percent. To put that in context, in the pre-pandemic years from 2017-2019, rent growth from January to July averaged just 3.3 percent. This month’s spike continues to push rents well above where they would be if growth had remained on its pre-pandemic trend.
Due to reopening, along with an assist from the summer half-term holiday (31 May-4 June), U.K. hotel occupancy came in at 43.1% in May 2021. That was up from May 2020 (23.0%) but substantially below May 2019 (78.9%). Because of the pandemic impact on 2020 data, STR is using 2019 as the recovery benchmark. Average daily rate (ADR) was even further behind the pace at GBP67.33, up from GBP58.69 in May 2020 but down from GBP93.65 in May 2019. However, both the occupancy and ADR levels from May 2021 were the highest in the U.K. since September 2020.
Chicago Area and East Coast States Remain More Exposed to Pandemic’s Impact During Second Quarter of 2021; Most Vulnerable Areas Are More Scattered Around Nation Than in Prior Quarter; Western States Continue to Have Most Favorable Market Conditions. ATTOM, curator of the nation’s premier property database, today released its second-quarter 2021 Coronavirus Report spotlighting county-level housing markets around the United States
U.S. single-family rent growth increased 6.6% in May 2021, the fastest year-over-year increase since at least January 2005, according to the CoreLogic Single-Family Rent Index (SFRI). The May 2021 increase was nearly four times the May 2020 increase. The index measures rent changes among single-family rental homes, including condominiums, using a repeat-rent analysis to measure the same rental properties over time.
In April 2021, 4.7% of home mortgages were in some stage of delinquency (30 days or more past due, including those in foreclosure), which was the first year-over-year decrease and the lowest overall delinquency rate since March 2020 according to the latest CoreLogic Loan Performance Insights Report. The 1.4 percentage point decrease in the delinquency rate from April 2020 marked a turning point for mortgage performance and was enabled by an employment and income recovery that helped homeowners remain or return to “current” mortgage payment status.
The CoreLogic Loan Performance Insights report features an interactive view of our mortgage performance analysis through April 2021. Measuring early-stage delinquency rates is important for analyzing the health of the mortgage market. To more comprehensively monitor mortgage performance, CoreLogic examines all stages of delinquency as well as transition rates that indicate the percent of mortgages moving from one stage of delinquency to the next.
Like many markets worldwide, Mainland China has worked diligently to establish a new, albeit temporary, normal. That has included tight border controls, enhanced testing measures and small but strict lockdowns to prevent new surges in COVID caseloads. As a result, travel in China has quickly rebounded in both the leisure and business travel segments. Sure, performance declines have occurred during lockdowns, but rebounds have quickly followed, and through the first half of 2021, hotel performance has remained pretty much near normal based on the market’s historical trends.
The strong results for the multifamily industry seen in the first three months of this year continued through June. The upcoming July edition of the ALN monthly newsletter will cover mid-year results in more detail, but the general nationwide numbers are certainly worth highlighting. As always, numbers will refer to conventional properties of at least 50 units. Despite various supply chain and labor issues this year, just less than 190,000 new units were delivered through the first six months of 2021.
National home prices increased 15.4% year over year in May 2021, according to the latest CoreLogic Home Price Index (HPI®) Report. The May 2021 HPI gain was up from the May 2020 gain of 4.2% and was the highest year-over-year gain since November 2005. Low mortgage rates and low for-sale inventory drove the increase in home prices. While a pick-up in construction and an increase in for-sale listings as more homeowners get vaccinated may help moderate surging home price growth, affordability challenges may drive some potential home buyers out of the market which could reduce demand.
Home prices nationwide, including distressed sales, increased year over year by 15.4% in May 2021 compared with May 2020 and increased month over month by 2.3% in May 2021 compared with April 2021 (revisions with public records data are standard, and to ensure accuracy, CoreLogic incorporates the newly released public data to provide updated results). The CoreLogic HPI Forecast indicates that home prices will increase on a month-over-month basis by 0.8% from May 2021 to June 2021, and on a year-over-year basis by 3.4% from May 2021 to May 2022.
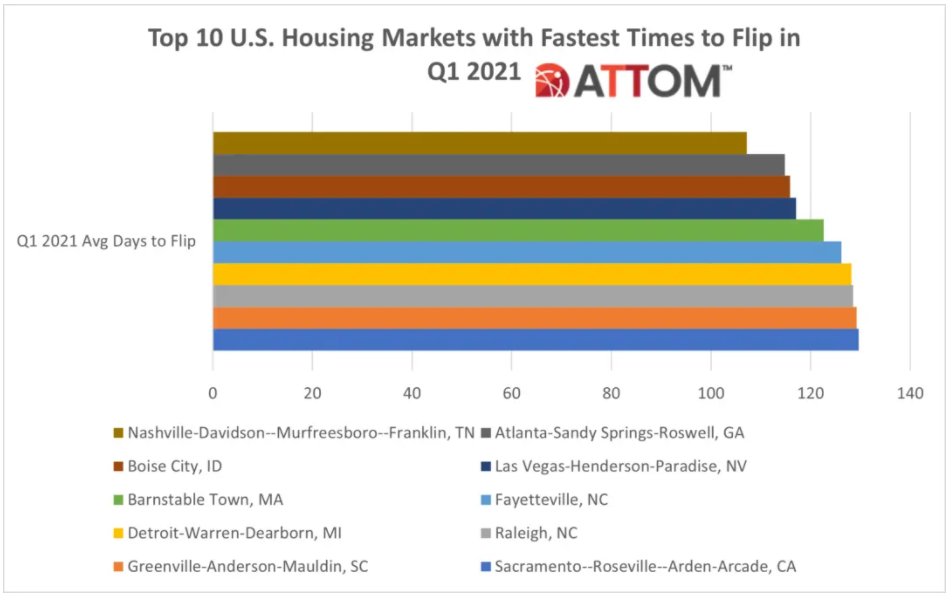
According to ATTOM’s recently released Q1 2021 U.S. Home Flipping Report, both the home flipping rate and gross profits declined nationwide in the first quarter of 2021. With home flips representing just 2.7 percent of all home sales in Q1 2021, the home flipping rate fell to the lowest level since 2000. ATTOM’s latest home flipping market analysis found that the gross profit on the typical U.S. home flip declined in Q1 2021 to $63,500, translating into a 37.8 percent ROI compared to the original acquisition price.
The mid-year review edition of the ALN newsletter will be published in July, but with only one day remaining in June for property updates to be collected, the data for the first half of 2021 is largely in place. One observation that jumps out from the data is the representation of Florida near the top of the list of markets with the strongest average effective rent growth so far this year. Florida markets comprise four of the top 10 markets while no other state boasts more than one, and seven of the top 15 markets – no other state has more than Arizona’s two.
Everyone seems to love the U.S. industrial sector these days, but when did so many investors come to that conclusion and how long can it continue? The rise of e-commerce has been a driving force behind changing investor perceptions on the sector, but there are two misleading signals in the trends for e-commerce. The industrial sector was long viewed as sleepy and slow-moving, and few investors saw exciting opportunities within such a low volatility sector. Industrial deal volume represented only 15% of investment in the big four sectors
Welcome to the July Apartment List National Rent Report. Our national index increased by 2.3 percent in June, continuing the trend of rapid price growth since the start of the year. So far in 2021, rental prices have grown a staggering 9.2 percent. To put that in context, in previous years growth from January to June is usually just 2 to 3 percent. After this month’s spike, rents have been pushed well above our expectations of where they would have been had the pandemic not disrupted the market.


