Big-box stores Target Corporation (NYSE: TGT) and Walmart Inc (NYSE: WMT)—which both recently reported their quarterly earnings—have faced excess inventory challenges over the last few months, slashing prices even as inflation has soared to new heights. Our credit and debit card transaction data reveals that in 2022, monthly average transaction values have generally increased year-over-year at Walmart Inc, but decreased slightly at Target. Additionally, our analysis shows that the share of online sales at both retailers is still elevated compared to pre-pandemic levels.
This Placer Bytes dives into recent foot traffic trends for Best Buy and GameStop to understand how inflation and rightsizing efforts are impacting visits to these two electronics retail leaders. Best Buy’s brick and mortar visits were relatively unaffected by the pandemic, with the brand showing a particularly strong Black Friday performance in 2021. But in recent months, as inflation drove consumers to hold off on larger purchases, including electronics, Best Buy visits have taken a hit.
The rise in the use of Food Delivery apps has been well documented with the pandemic serving up a hearty main course for many of the industry’s participants. However, as we have emerged from the depths of lockdowns delivering consistent tailwinds for growth in 2020 and 2021, we ask the questions - how has this sector performed through the first half of 2022? And what is the outlook in the current economic environment?
After a wave of new streaming services have crowded consumers’ Roku screens and spurred requests for shoppers’ roommate’s cousin’s girlfriend’s father’s password, have we finally hit a saturation point for streaming services? Two recent consolidations suggest that we may have, with HBO Max and Discovery+ to merge into one service and Walmart (which sold its Vudu service to Fandango) to partner with Paramount+ by offering the service free for Walmart+ customers.
Many companies provide their employees with benefits, perks, and flexibility to foster employee satisfaction. In our recent collaboration with USNews, we looked at a combination of less tangible factors like feelings of fulfillment at work and a sense of community, alongside material factors like good compensation, to identify Nvidia, KLA, Zoom, Atlassian, Enphase, and Qualcomm as the companies with the happiest employees. But how about the runner-ups? Here are the full rankings of companies according to these metrics.
The rise in retail foot traffic and consumer demand in the pet sector has been a recurring theme since the early days of the pandemic. With Petco building on the success of its pet wellness and omnichannel ecosystem, we dove into the recent visit data and took a closer look at the chain’s launch into smaller, rural markets. Pet adoptions surged in the early stages of the pandemic, driving significant foot traffic to Petco. As the majority of these pets remain in their new homes, overall visits to Petco are continuing on their positive trend in comparison to 2019.
Peloton IAP Revenue reached a new all-time-high in May, earning 41% above its previous best month, May 2021. Since April, monthly IAP Revenue estimates have been above the May 2021 peak. While IAP Revenue has never looked better for Peloton, monthly active users (MAU) declined -36% year-over-year (YoY) in Q2 and negative YoY growth continues in the summer months. Average MAU for Peloton and fitness competitors (Nordic Track, Echelon, Bowflex) has declined -53% since April 2021, as Gym and Fitness Studio apps grew average MAU 84%.
Beauty products are often seen as an “affordable luxury,” and shoppers looking for budget-friendly splurges are increasing their offline beauty visits even as discretionary spending in other categories drops. To better understand the current beauty surge, we dove into Ulta Beauty’s year-to-date foot traffic performance to see how the wider economic situation is boosting this already strong retailer.
Beauty Retail and Direct-to-Consumer (D2C) Apparel apps are driving more daily active users (DAU) in the last 30 days than during the peak of 2021 holiday shopping. Daily users engaging with D2C Apparel apps have increased 5% from December 2021, and 2% for Beauty Retail apps. Historically for these retail categories, they reach a new all-time-high engagement rate each December. In the last three years, the record engagement would not be surpassed until Q4.
The sporting goods space had a particularly strong 2021 as consumers stocked up on home workout equipment during the pandemic. With fitness foot traffic on the rise, we dove into the visit data for two leading sporting goods brands – DICK’s Sporting Goods and Hibbett Sports – and took a closer look at the trends driving brick-and-mortar visits to the chains. Though offline fitness has returned, year-over-three-year (Yo3Y) visits to DICK’s and Hibbett demonstrate that the chains are maintaining their pandemic-driven gains.
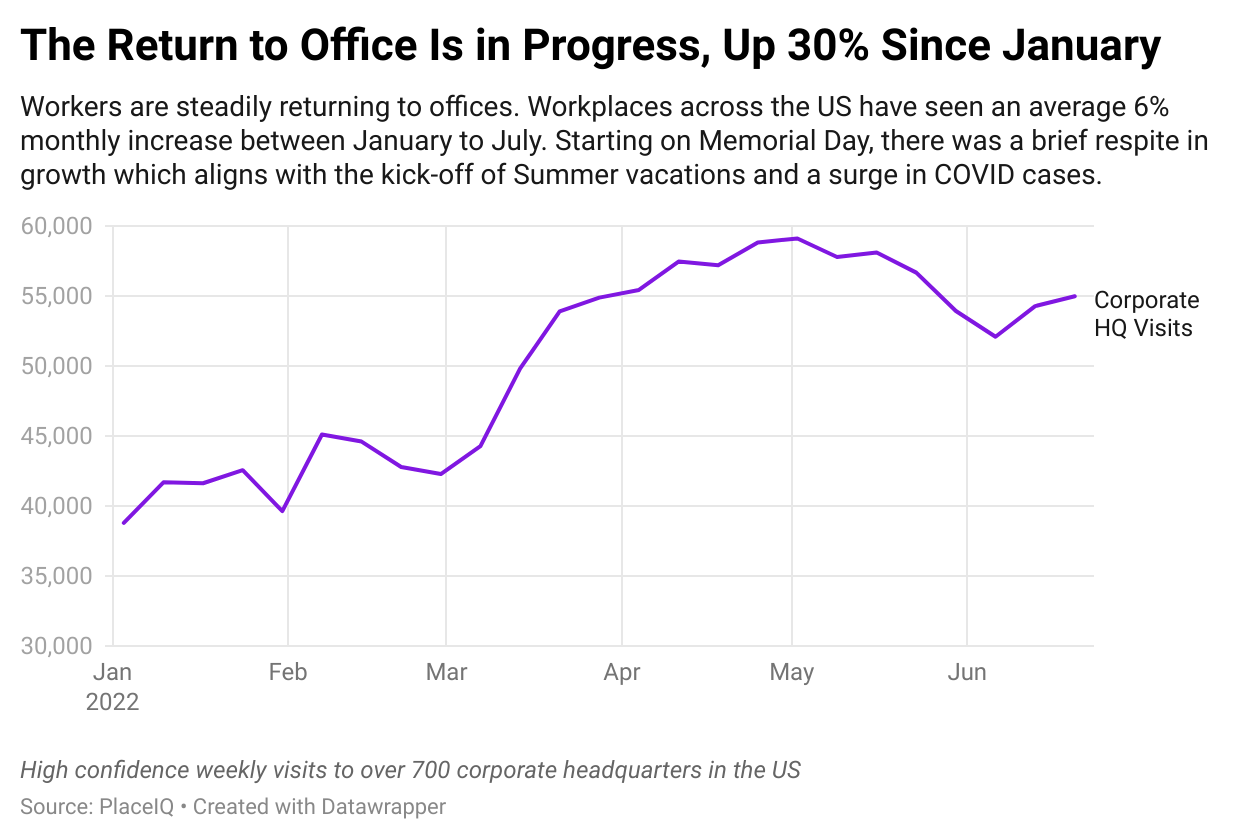
While the debate between remote, on-site, and hybrid work continues to bubble, visitation to offices is steadily tracking upwards. There’s been a lot of discussion these past few months about the return to the office, working from home, and hybrid scenarios. We’ve read arguments for one way or the other, but the facts on the ground show that a steady, stable return to the workplace is underway. Offices are seeing 30% more traffic than they saw in January, as measured by PlaceIQ’s movement data metrics.
On March 11, 2020, the World Health Organization (WHO) put everyone on notice when they announced that the COVID-19 outbreak was officially a pandemic. In the two-plus years since the pandemic, a lot has changed, including the spending habits of advertisers who found themselves trying to make sense of shifting consumer behaviors and shrinking ad budgets. As the pandemic waned, advertisers understandably increased spending as they looked to capitalize on the spending surge and recoup lost revenue.
Heading into 2020, cycling studios and spin classes were gaining speed. As studios closed, at-home cycling brands kept the trend in focus. But troubles at Peloton earlier this year followed by a recent announcement from Soul Cycle that it was closing a quarter of its studios seem to indicate that the workouts have gone off course. In today’s Insight Flash, we examine how spin classes have fared versus overall athletic clubs in our CE Transact data, then deep dive into specific trends for Peloton class attendance using our CE Web data, followed by tracking the markets where SoulCycle is closing from our CE Transact data.
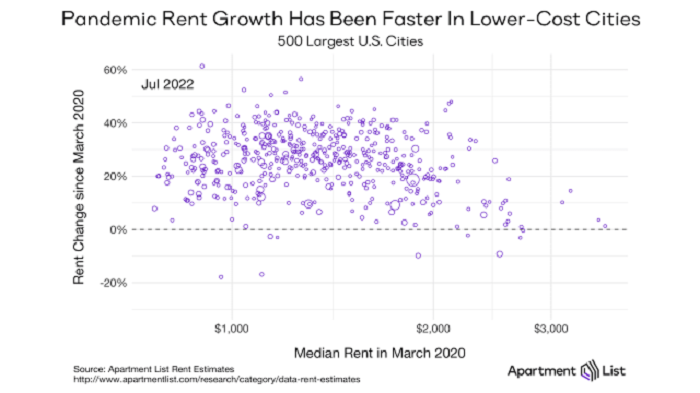
Since 2020, rent growth in the United States can be broken into two phases. The first started with the COVID-19 pandemic in March 2020 and lasted roughly one year. During this time, expensive cities - particularly denser metropolitan ones - experienced a surge in vacant apartments and a sustained drop in rent prices. Meanwhile, in cheaper and more-suburban cities, rent drops were short-lived and price growth accelerated within months. We witnessed a steady price convergence, as expensive cities got cheaper and cheaper cities got more expensive.
In July 2022, the grocery industry reportedly experienced the biggest year-over-year price hikes since the 1970s, affected by factors such as inflation and ongoing supply chain issues. So how has consumer spending at specific supermarket chains fared against this backdrop? Using consumer transaction data, we analyzed how U.S. consumer spending at major grocery store companies—including Ahold Delhaize; Albertsons Companies, Inc (NYSE: ACI); Aldi; H-E-B; The Kroger Company (NYSE: KR); Publix; and Trader Joe’s—changed between July 2021 and July 2022.
As consumers look to maximize their spending power amidst record inflation, discount stores have become increasingly attractive to bargain shoppers. Dollar General has long been synonymous with dollar stores, and in recent years, the chain has charted a course to expand beyond the dollar store category and into the discount grocery and home goods spaces. We dove into the foot traffic data to explore how Dollar General is cementing itself as a true one-stop shop for the value-oriented consumer.
Latin America, home to some of the most urbanized cities in the world, is one of the fastest growth spots for ride-hailing. Traffic congestion, limited public transport infrastructure make it difficult to cope with peak demand during morning commute times in large cities like Sao Paulo, Mexico City and Bogota. Amidst the intense rivalry amongst ride hailing companies in Latin America, Measurable AI’s transactional e-receipt panel reveals that Uber and 99 (owned by Chinese ride-hailing company Didi Chuxing) are the major rivals in these two markets.
As y/y inflation in the UK continues to create woes for shoppers, which businesses are suffering as well? In today’s Insight Flash, we dig into not only where average ticket has increased the most, but also look at which subindustries might be seeing the impact of trade up/trade down. Since the beginning of the year, the largest changes in average ticket have been concentrated in travel-related industries, likely partly due to longer trips during the holiday period but also partially driven by rising costs as demand and fuel prices make transport more expensive.
Universities play a significant role in shaping the skills of the local workforce. This week, we focus on the largest state universities and uncover their skill specialties. We also assess the role that state universities play in supplying the skills required in the local job market. The map below shows the skill specialty of the largest state university system by enrollment. For a skill to be a university system’s specialty, it has to be overrepresented in the profiles of graduates from the university system, relative to graduates from other universities.
With the most recent department store visit data, we dove into the impact of rightsizing measures and looked at the particularly strong foot traffic to higher-end chains to understand how the category is dealing with the current economic situation. Department stores had a rough start to the year due to the January Omicron wave. And although visits began picking up in February, March’s inflation and fuel price surge opened the year-over-three-year (Yo3Y) visit gaps again. Now, following a difficult May and June, the Yo3Y visit gaps began narrowing once more.


