Student housing investment volume in the U.S. reached $1.7 billion in the second quarter of 2021. While this level represents a high-triple-digit rate of increase compared with the same period a year ago, it is still 12% below the average level for a second quarter between 2017 and 2019. Sales of student housing assets had ground to a halt in Q2 2020 amid Covid-19 disruption to the commercial real estate market and as universities and students across the U.S. pivoted to remote learning.
Investment in commercial property outside London has set a new record for the first nine months of the year, powered by investor demand for industrial assets. U.K. regional property sales volume reached £27.7 billion ($37.6 billion) in the year through September, a 22% increase on the average January-to-September period in the five years prior to Covid. Compared to 2020, transaction volume is up nearly 60% year to date.
The CoreLogic Home Price Insights report features an interactive view of our Home Price Index product with analysis through August 2021 with forecasts from August 2022. CoreLogic HPI™ is designed to provide an early indication of home price trends. The indexes are fully revised with each release and employ techniques to signal turning points sooner. CoreLogic HPI Forecasts™ (with a 30-year forecast horizon), project CoreLogic HPI levels for two tiers—Single-Family Combined (both Attached and Detached) and Single-Family Combined excluding distressed sales.
National home prices increased 18.1% year over year in August 2021, according to the latest CoreLogic Home Price Index (HPI®) Report. The August 2021 HPI gain was up from the August 2020 gain of 5.9% and was the highest 12-month growth in the U.S. index since the series began in 1976. The increase in home prices was fueled by low mortgage rates, low for-sale supply and an influx in homebuying activity from investors. Projected increases in for-sale supply and moderation in demand as prices grow out of reach for some buyers could slow home price gains over the next 12 months.
An increasing number of millennials, those born from 1981 to 1996, are in or are approaching their first-time homebuying years. Older millennials, meanwhile, are in the age-range for a move-up purchase. According to the CoreLogic® Loan Application Database, millennials made up 67% of first-time home purchase applications and 37% of repeat home purchase applications in 2021. Millennials have made up the largest share of home purchase mortgage applications since 2016, accounting for 51 percent of home-purchase mortgage applications in 2021, up five percentage points from 2019
Home equity – the difference between the value of a home and the amount of mortgage debt on the home – is an important component of overall household wealth. Changes in the amount of home-equity wealth will be primarily affected by growth in home values and pay down of mortgage loan balances. For the last few years, home-value appreciation has been the major creator of wealth.
At the end of September 2021 – 18 months after the passage of the CARES Act which provided millions of homeowners the protection of COVID-19 payment forbearance – many mortgage loans are expected to reach the end of forbearance. That is, of an estimated 1.7 million mortgage loans that are in forbearance at the start of August, more than 1.2 million loans will reach the maximum 18-month term limit at the end of September, representing 73% of the total forbearance plans.
The infamous dot plot from the Federal Reserve meeting last week suggests an expectation of a 2022 liftoff for U.S. interest rates. But who knows, forecasting interest rates is not like forecasting commercial property market trends: a lot can happen quickly. Still, seeing that chart, market professionals are asking if cap rates will go up if that expectation comes to pass in 2022. My question is, why should cap rates start responding to interest rates now all of a sudden?
Welcome to the October Apartment List National Rent Report. Our national index increased by 2.1 percent from August to September. Although month-over-month growth has slowed slightly from its July peak, rents are still growing much faster than the pre-pandemic trend. Since January of this year, the national median rent has increased by a staggering 16.4 percent. To put that in context, rent growth from January to September averaged just 3.4 percent in the pre-pandemic years from 2017-2019.
The composition of lenders in the U.S. commercial mortgage market has largely returned to its form before the Covid-19 crisis struck, the latest US Capital Trends report shows. CMBS originators, who had been particularly hard hit in the second quarter of 2020, captured an 18% share of the commercial mortgage market in the past quarter, which put them behind only regional/local banks as the largest source of financing. The rebound reflects an easing of the uncertainty in the lending market, which had limited CMBS originators to just a 1% share of lending a year ago.
U.S. single-family rent growth increased 8.5% in July 2021, the fastest year-over-year increase in 16.5 years, according to the CoreLogic Single-Family Rent Index (SFRI). The index measures rent changes among single-family rental homes, including condominiums, using a repeat-rent analysis to measure the same rental properties over time. The July 2021 increase was nearly five times the July 2020 increase, and while the index growth slowed last July, rent growth is running well above pre-pandemic levels when compared with 2019.
The pandemic has influenced homebuyers’ decision on where to buy a home. Our previous analysis showed that homebuyers who relocated to another metro in 2020 were often choosing metros that were either adjacent to their current location, had a lower cost of living or both. Although homebuyers were considering affordability and proximity while buying homes even before COVID-19, the migration rate grew during the pandemic. With the combination of low inventory, low interest rates and a shift to a more flexible working environment
A year and a half into the Covid-19 pandemic and loss rates for U.S. commercial real estate loans are not looking that bad. With the exception of the hotel and CBD office sectors, loss rates so far are well below the pace set through this stage of the Global Financial Crisis. The macroeconomic factors driving loan performance were simply different in this downturn. Investor tolerance for risk has followed a unique path during the Covid-19 downturn, one that varies from that seen during the GFC.
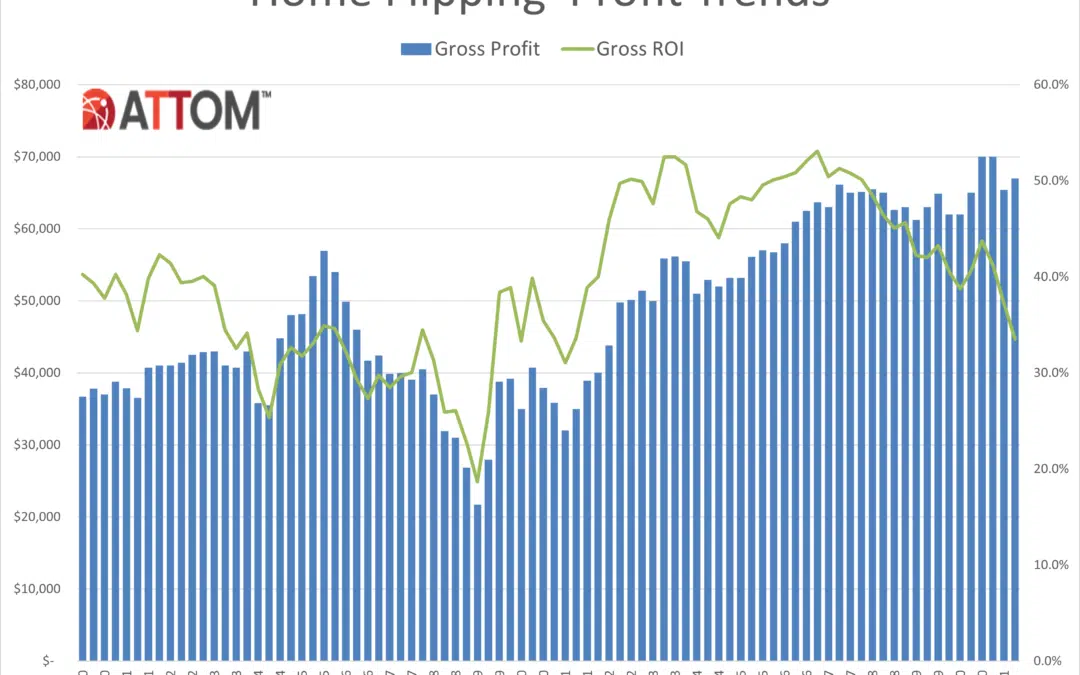
ATTOM, curator of the nation’s premier property database, today released its second-quarter 2021 U.S. Home Flipping Report showing that 79,733 single-family homes and condominiums in the United States were flipped in the second quarter. Those transactions represented 4.9 percent of all home sales in the second quarter of 2021, or one in 20 transactions – the first increase in more than a year. The second quarter home flipping rate was up from 3.5 percent, or one in every 29 home sales in the nation, during the first quarter of 2021.
The CoreLogic Loan Performance Insights report features an interactive view of our mortgage performance analysis through June 2021. Measuring early-stage delinquency rates is important for analyzing the health of the mortgage market. To more comprehensively monitor mortgage performance, CoreLogic examines all stages of delinquency as well as transition rates that indicate the percent of mortgages moving from one stage of delinquency to the next.
The nation’s overall delinquency rate was 4.4% in June. The serious delinquency rate fell to its lowest level since May 2020. In June 2021, 4.4% of home mortgages were in some stage of delinquency (30 days or more past due, including those in foreclosure), which was a 2.7-percentage point decrease from June 2020 according to the latest CoreLogic Loan Performance Insights Report . However, overall delinquencies were still above the early 2020 pre-pandemic rate of 3.6%.
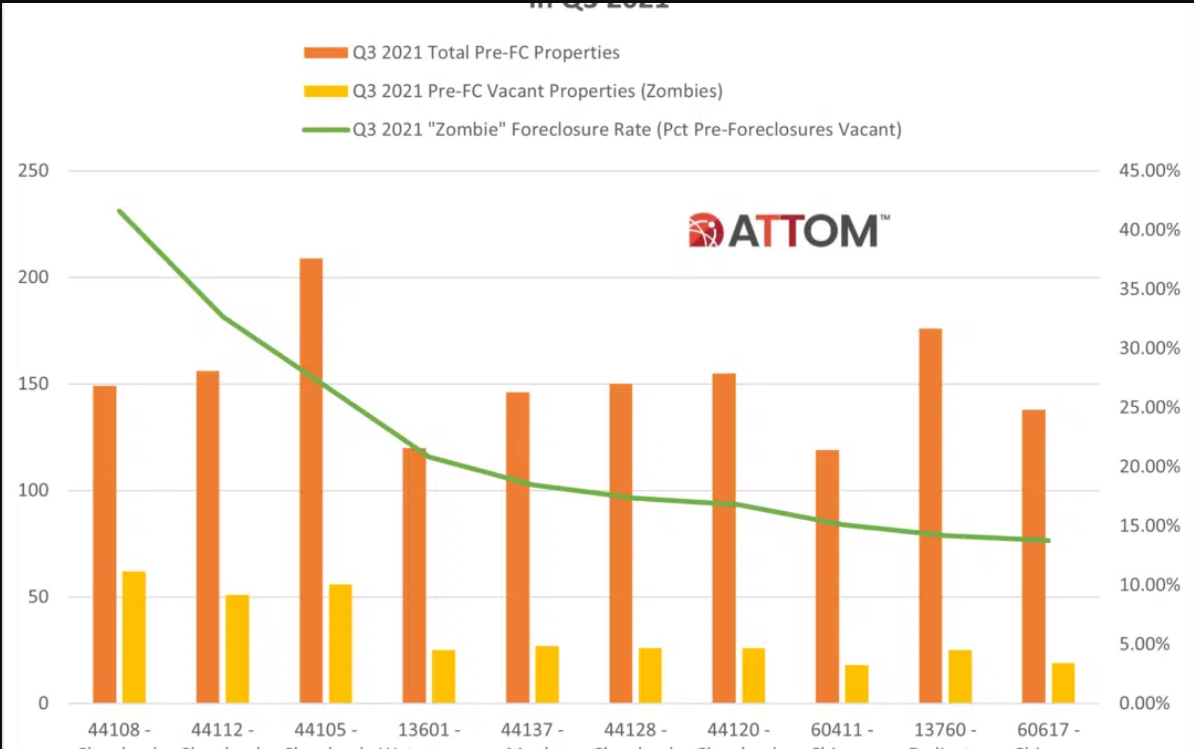
ATTOM’s newly released Q3 2021 Vacant Property and Zombie Foreclosure Report found that 1.3 million residential properties in the U.S. sit vacant, representing 1.4 percent, or one in 74 homes, across the nation. According to ATTOM’s latest vacant properties analysis, while the number of properties in the process of foreclosure in Q3 2021, is down 3.7 percent from Q2 2021 and down 0.2 percent from Q3 2020, among those pre-foreclosure properties, the number of those sitting vacant in Q3 2021 is down quarterly by 6.7 percent and annually by 5.3 percent.
The Dodge Momentum Index dropped 3% in August to 148.7 (2000=100) from the revised July reading of 154.0. The Momentum Index, issued by Dodge Data & Analytics, is a monthly measure of the first (or initial) report for nonresidential building projects in planning, which have been shown to lead construction spending for nonresidential buildings by a full year. The commercial planning component lost 2% in August, while the institutional component fell by 6%.
The inflation statistics this summer have captured headlines. Economic policy mavens often look at a price index excluding food and energy, referred to as the core price index, which tends to be more stable over time and a less noisy barometer of underlying inflationary trends. Newsworthy was the spike in core inflation: the Consumer Price Index, or CPI, measured a jump in core inflation to 4.5% in June, the highest in 30 years. Rent comprises 40% of the core CPI price index. Tenant rent and housing characteristics are used to impute an “equivalent” rent for owner-occupied homes in the index.
National home prices increased 18% year over year in July 2021, according to the latest CoreLogic Home Price Index (HPI®) Report . The July 2021 HPI gain was up from the July 2020 gain of 5.3% and was the highest 12-month growth in the U.S. index since the series began in 1976. The increase in home prices was fueled by low mortgage rates, low for-sale supply and a rebounding economy. Projected increases in for-sale supply and moderation in demand as prices grow out of reach for some buyers could slow home price gains over the next 12 months.


